A significant market rotation is underway. The S&P 500 and Nasdaq closed lower as technology stocks bore the brunt of selling pressure, with investors weighing geopolitical developments related to Iran. Our research team has been tracking a distinct shift in capital flows, and the numbers tell a compelling story about where money is moving right now.
Why Is Big Tech Dropping?
Technology stocks are driving the broader market lower as investors reassess risk exposure in light of Iran-related developments. The data shows tech-heavy index funds declining while oil-related assets post gains, a rotation pattern consistent with periods of geopolitical uncertainty.
For traders wondering why the stock market is going down today, the answer sits at the intersection of geopolitical risk and sector rotation. When market participants adjust portfolios based on international developments, high-growth technology shares often experience elevated volatility. Our analysis indicates that the current geopolitical focus on Iran is creating a risk-off environment for equities, with the tech sector absorbing the most damage.
The fact that both the S&P 500 and Nasdaq ended lower on tech weakness confirms that broader market health remains tightly linked to technology sector performance. The data shows a strong correlation between Iran-related headlines and the specific asset classes experiencing the most movement, though multiple factors may be contributing to current price action.
Why Are Tech Stocks Down Today?
We went straight to the numbers to gauge the severity of this move. Our research team has verified the recent 10-day price changes across key market sectors, and the picture is clear.
Key Data: The Technology Select Sector SPDR Fund (XLK) is leading the decline with a 10-day price change of -5.40%. The Nasdaq 100 ETF (QQQ) reflects this weakness at -3.23%, while the S&P 500 ETF (SPY) posts -1.19% over the same period.
The -5.40% drop in XLK explains exactly why the Nasdaq is under pressure. Because technology makes up a massive portion of the broader market, the S&P 500 ETF (SPY) is also feeling the drag. These figures suggest that tech weakness is a significant contributor to the broader index declines.
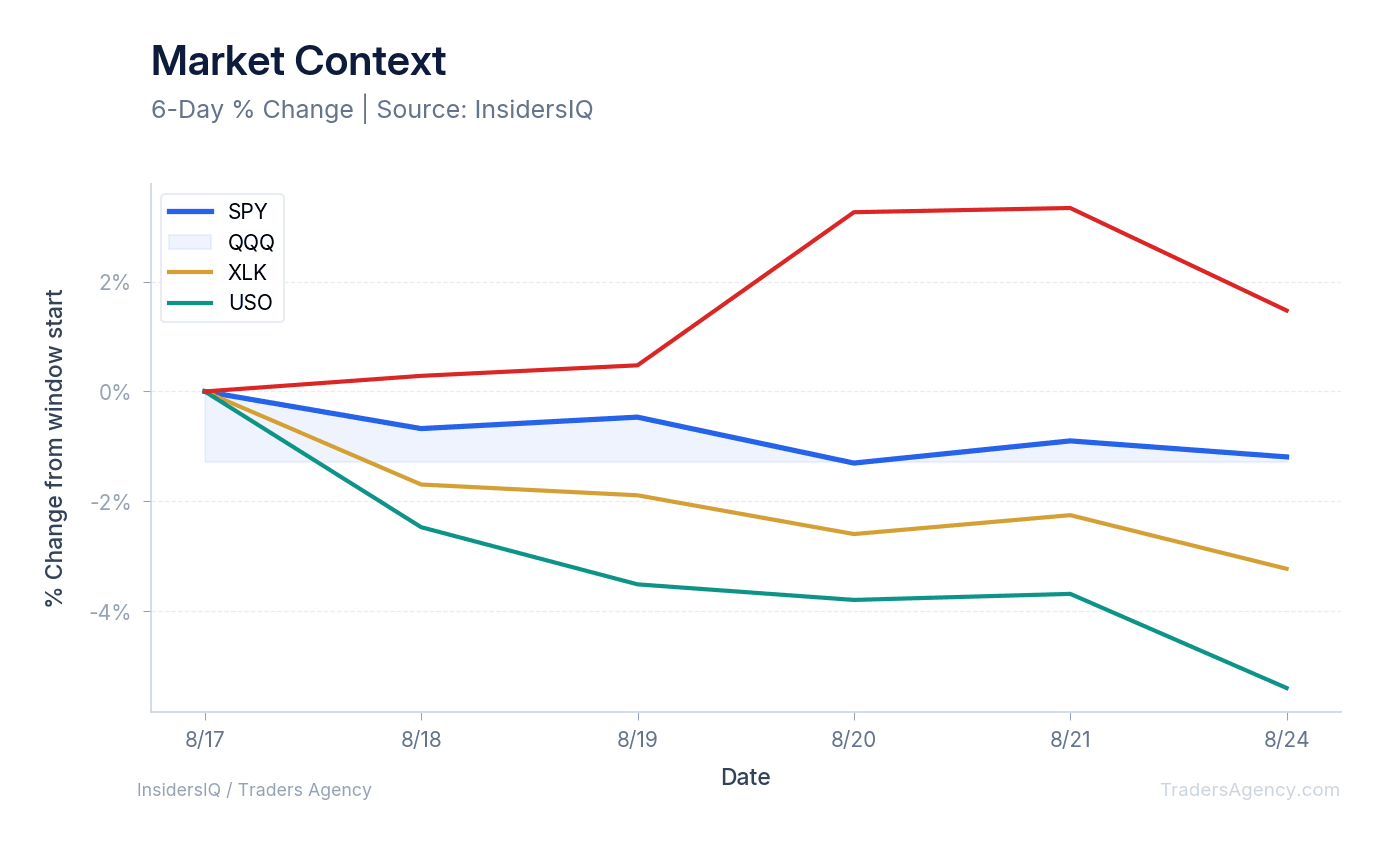
While equities face downward pressure, commodities are telling a different story. The United States Oil Fund (USO) has posted a 10-day price change of +1.47%. This positive movement in USO aligns with reports that investors are weighing Iran-related geopolitical risk. The contrast between the -5.40% drop in XLK and the +1.47% rise in USO paints a clear picture of how different asset classes are responding.
What Does This Mean for the Market Right Now?
This is creating a clear divergence between technology equities and energy assets. As investors price in geopolitical developments regarding Iran, tech-heavy funds like XLK and QQQ are declining while oil-tracking funds like USO find support.
The Rotation Signal: XLK down -5.40% vs. USO up +1.47% over 10 days. This is a classic defensive rotation pattern, with capital leaving high-growth tech and flowing toward energy exposure.
Traders need to recognize the mathematical relationship between these asset classes. When people ask why big tech is dropping, they need to look at where the money is going. The U.S. stock market is heavily weighted toward technology. When XLK falls by more than five percent over a 10-day period, it can contribute meaningfully to dragging SPY down by -1.19%.
Our team views this divergence as the primary narrative for the current trading sessions. If you are holding tech stocks, the -3.23% drop in QQQ over the last 10 days is the metric to monitor. The spread between SPY and QQQ shows that selling is heavily concentrated in the Nasdaq. Because SPY is only down -1.19%, non-tech sectors in the S&P 500 are holding up considerably better than pure technology plays.
Want expert trading insights delivered daily?
Join thousands of traders who rely on Traders Agency for market analysis and trade ideas.
Join Traders AgencyWhat Should Traders Watch as Investors Weigh Iran Developments?
Our research team is monitoring several specific data points to gauge the next market direction. If you are trying to manage positions during this period, here is what our analysis suggests you should watch:
- XLK Price Action: The technology sector is the epicenter of the current selloff. With XLK down -5.40% over the last 10 days, watch to see if this selling pressure accelerates or finds a floor.
- USO Response: The +1.47% gain in USO over the last 10 days shows that oil is reacting to Iran-related developments. Monitor USO for continued strength, which could signal further geopolitical pricing.
- QQQ and SPY Spread: The Nasdaq 100 ETF (QQQ) is down -3.23%, while the S&P 500 ETF (SPY) is down -1.19%. A widening gap would indicate that the selloff remains isolated to technology, while a narrowing gap could suggest broader market weakness spreading beyond tech.
For those watching for signs of a broader market breakdown, the current data shows a concentrated tech pullback rather than a total market collapse. However, the situation remains fluid as investors continue to weigh Iran-related developments. The performance of these four specific ETFs will likely dictate the tone for the coming trading sessions.
The Bottom Line
The S&P 500 and Nasdaq ended lower primarily due to weakness in technology shares, as investors weigh geopolitical developments regarding Iran. We see tech declining, evidenced by the -5.40% drop in XLK, while oil has moved higher, shown by the +1.47% rise in USO. We are closely monitoring QQQ and SPY to see if this tech-led decline spreads further into the broader market or stabilizes here.
This is a moment to be tactical, not reactive. Know your exposure, watch the data, and trade accordingly.
Want expert trading insights delivered daily?
Join thousands of traders who rely on Traders Agency for market analysis and trade ideas.
Join Traders AgencyKey Takeaways
- Both the S&P 500 and Nasdaq closed lower, with technology stocks absorbing the heaviest selling pressure as investors weigh Iran-related geopolitical developments.
- XLK, the technology sector ETF, dropped 5.40%, signaling a concentrated and significant pullback in tech rather than a broad market collapse.
- USO, an oil-focused ETF, rose 1.47%, reflecting a rotation pattern where capital moves from high-growth equities into commodity-linked assets during geopolitical uncertainty.
- QQQ and SPY are the key instruments to monitor in coming sessions to determine whether the tech-led decline spreads to the broader market or stabilizes.
- The article frames this as a moment for tactical positioning, with the emphasis on monitoring sector-level data rather than reacting to headline noise.
DISCLAIMER: Traders Agency does not offer financial advice. The information provided is for educational purposes only and should not be considered financial advice. Traders Agency is not responsible for any financial losses or consequences resulting from the use of the information provided. Trading carries inherent risks and may not be suitable for all individuals. You are advised to conduct your own research and seek personalized advice before making any investment decisions, recognizing the potential risks and rewards involved.
See more from Traders Agency on Google
Make us a preferred source and our market analysis will appear more prominently in your Google Search, Top Stories, and AI results.
Add to Preferred Sources