
You've probably seen it happen on a trading forum: a stock rips higher, and someone posts that retail is buying it hand over fist. Twenty minutes later, someone else argues the move is actually institutional accumulation disguised as a breakout. Both traders are staring at the same chart and walking away with opposite conclusions. By the end of this guide, you'll know how to read the actual clues yourself instead of trusting forum guesswork.
Retail vs institutional order flow is the practice of distinguishing trades placed by individual traders from trades placed by large institutions, using clues like trade size, timing, and execution venue. The distinction matters because institutional money tends to move markets over days and weeks, while retail activity often clusters around news, social media chatter, and the opening bell.
We built this guide because so many of our members ask us how to track institutional trading without access to a professional terminal. You don't need one. You need to know what to look for, and we're going to show you exactly that.
What Is Retail vs Institutional Order Flow?
Bottom Line: No single clue proves whether retail or institutional traders are driving a move; trade size, timing, execution venue, and flow trackers only become useful when checked together alongside existing technical and fundamental analysis. When retail and institutional flow diverge, treat it as a volatile, higher-risk setup and size positions conservatively rather than treating it as a reliable shortcut to front-run institutions.
Retail vs institutional order flow refers to the split between orders placed by individual traders through retail brokerages and orders placed by professional institutions like hedge funds, mutual funds, and market makers.
Retail flow is typically smaller in size, concentrated around the market open and major news events, and routed through retail brokers to wholesalers. Institutional flow tends to be larger, spread across the trading day, and executed through algorithms designed to minimize market impact. Neither group trades in a vacuum. Retail and institutional orders constantly interact, and the balance between them shifts a stock's short-term direction. Once you understand these retail vs institutional trading patterns, you can figure out whose money is actually driving a move before you put your own capital behind it.
How Can You Tell Retail Flow from Institutional Flow?
You can tell retail from institutional flow by examining three data points together: average trade size, time-of-day clustering, and execution venue. No single signal is definitive, but combined they paint a reasonably clear picture.
Retail orders are usually small, often under 100 shares per trade, and arrive in bursts tied to headlines or social posts. Institutional orders get broken into smaller pieces by execution algorithms specifically so they don't look institutional, which is exactly why you need more than one signal. We teach our members to treat this as a weight-of-evidence exercise rather than a single yes-or-no test.
- Step 1: Check the average trade size – Pull up time-and-sales data and look at the median trade size over a rolling window, not just the biggest prints.
- Step 2: Map the timing – Note whether volume clusters at 9:30-10:00 AM ET (often retail-heavy) or builds steadily into the 3:30-4:00 PM close (often institutional).
- Step 3: Look at the venue – Check whether volume is routing through wholesalers and payment-for-order-flow channels or hitting lit exchanges directly.
How Do Trade Size and Execution Venue Signal Retail vs Institutional Flow?
Average trade size is one of the clearest retail vs institutional order flow signals available to non-professional traders, because institutions routinely break large orders into smaller slices to avoid moving the price against themselves.
A retail trader buying $2,000 worth of a $50 stock places one order for 40 shares. An institution building a $10 million position in the same stock might execute that through hundreds of child orders of 200-500 shares each, spread across hours. Average trade size alone can mislead you if you're only glancing at one print, which is why we always pair it with execution venue data.
| Trader Type | Position Size | Typical Execution |
|---|---|---|
| Retail Trader | $2,000 (40 shares @ $50) | Single order, routed to a wholesaler |
| Institutional Desk | $10,000,000 | Hundreds of 200-500 share child orders over hours |
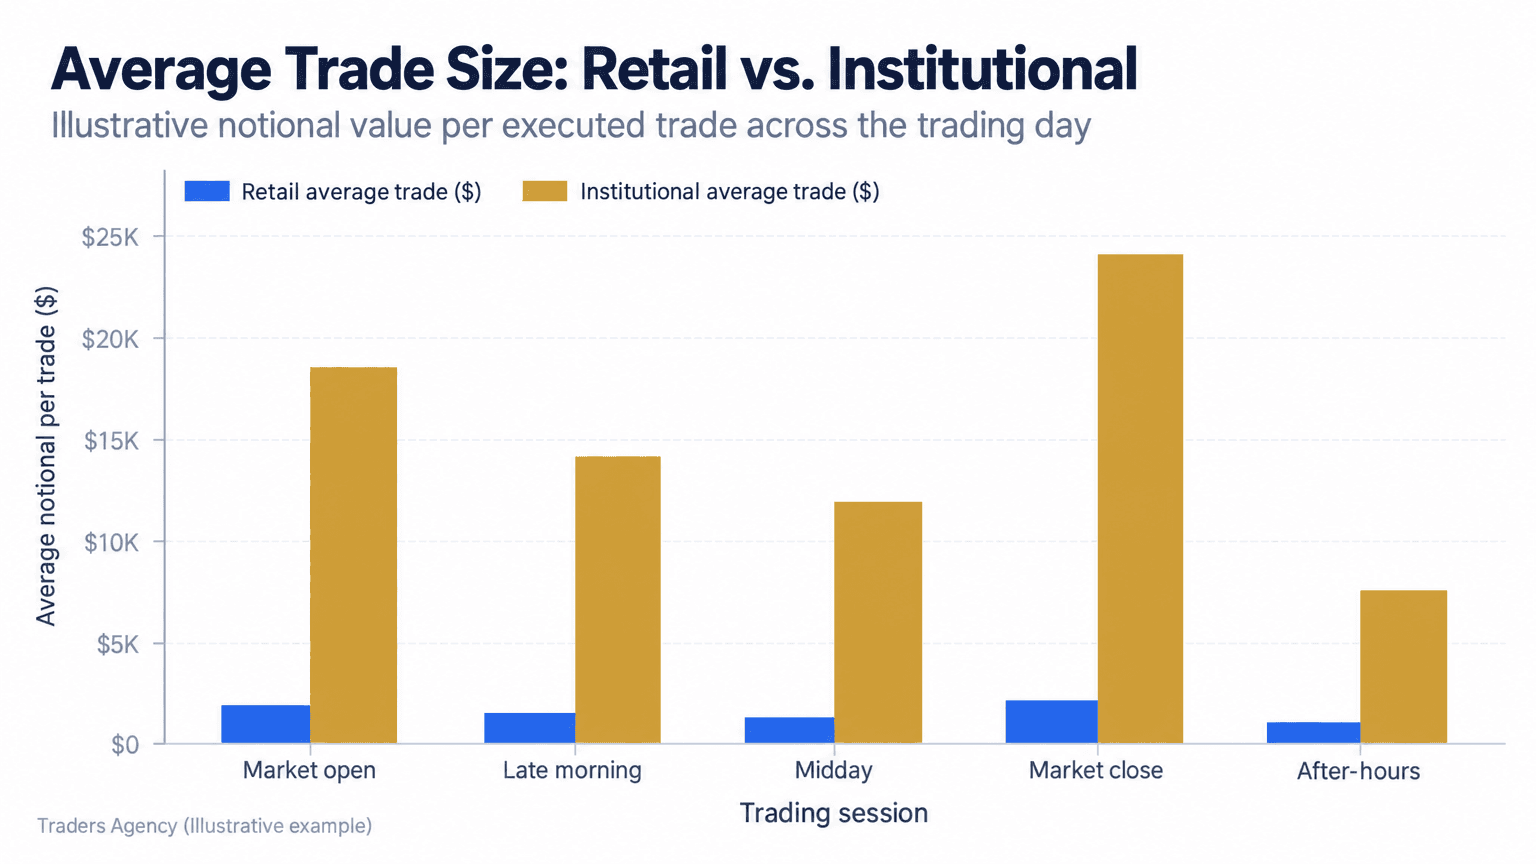
Execution venue adds a second layer. Most retail brokers route orders to wholesalers, so a heavy share of wholesaler-executed volume often points to retail participation. Institutional desks lean more on direct exchange access and dark pools to control slippage on large blocks.
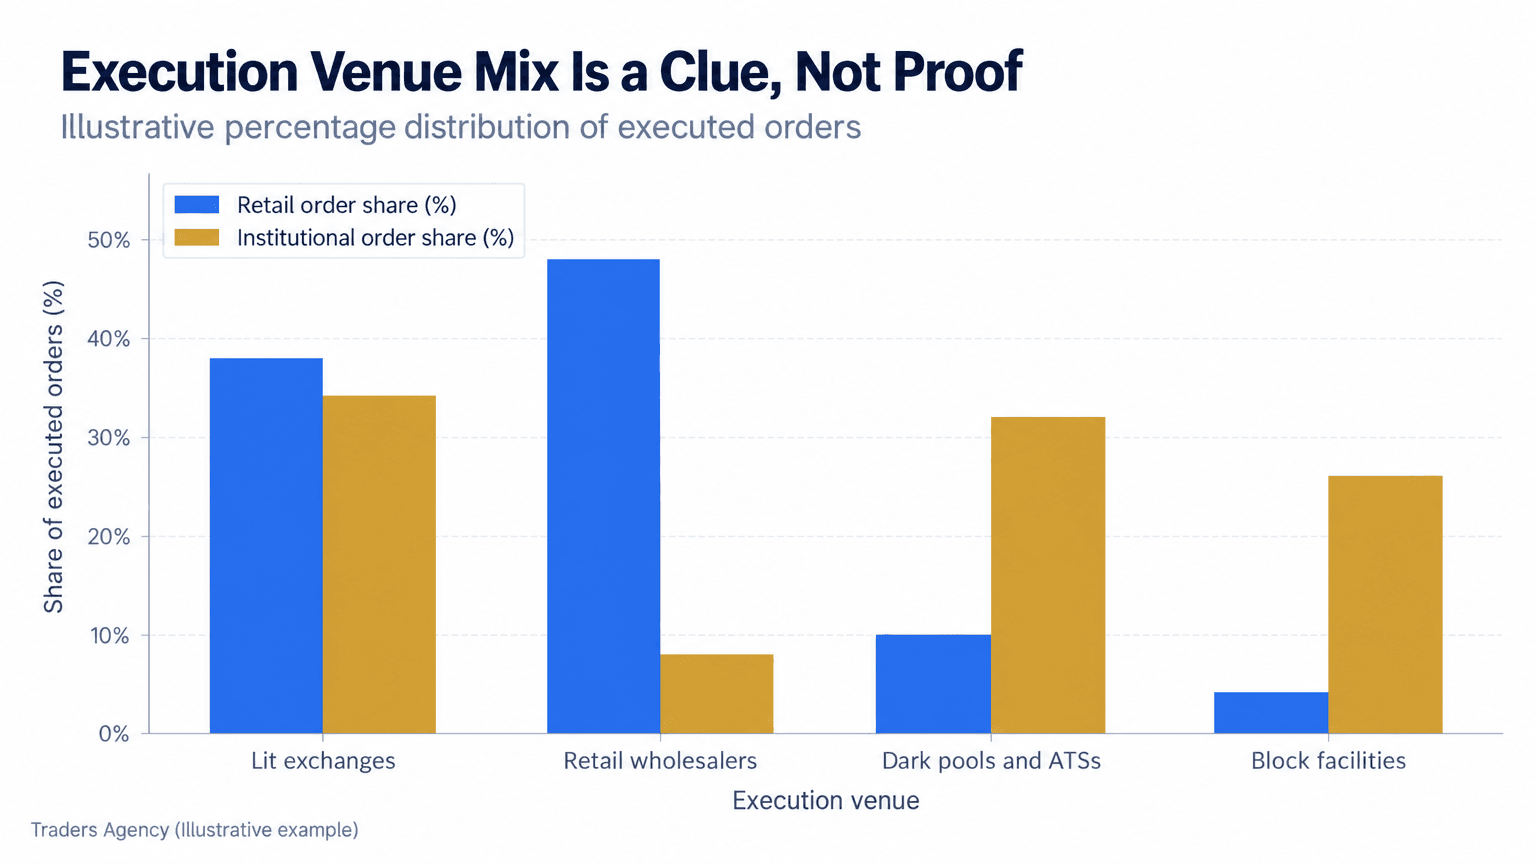
Key Concept: Treat trade size and venue mix as supporting evidence, not proof. Some institutional flow does route through wholesalers, and some sophisticated retail traders use direct market access too. The signal only becomes useful when you stack multiple data points together.
What Time-of-Day Patterns Reveal Retail and Institutional Trading?
Time-of-day patterns are a reliable secondary signal in retail vs institutional order flow analysis, because retail activity tends to spike at the open while institutional buying often builds steadily and peaks near the close.
The first 30 minutes of trading usually see a rush of retail orders reacting to overnight news, pre-market chatter, and app notifications. Institutional desks, by contrast, often use the middle of the day to work large orders quietly, then increase participation into the close to meet benchmark execution targets.
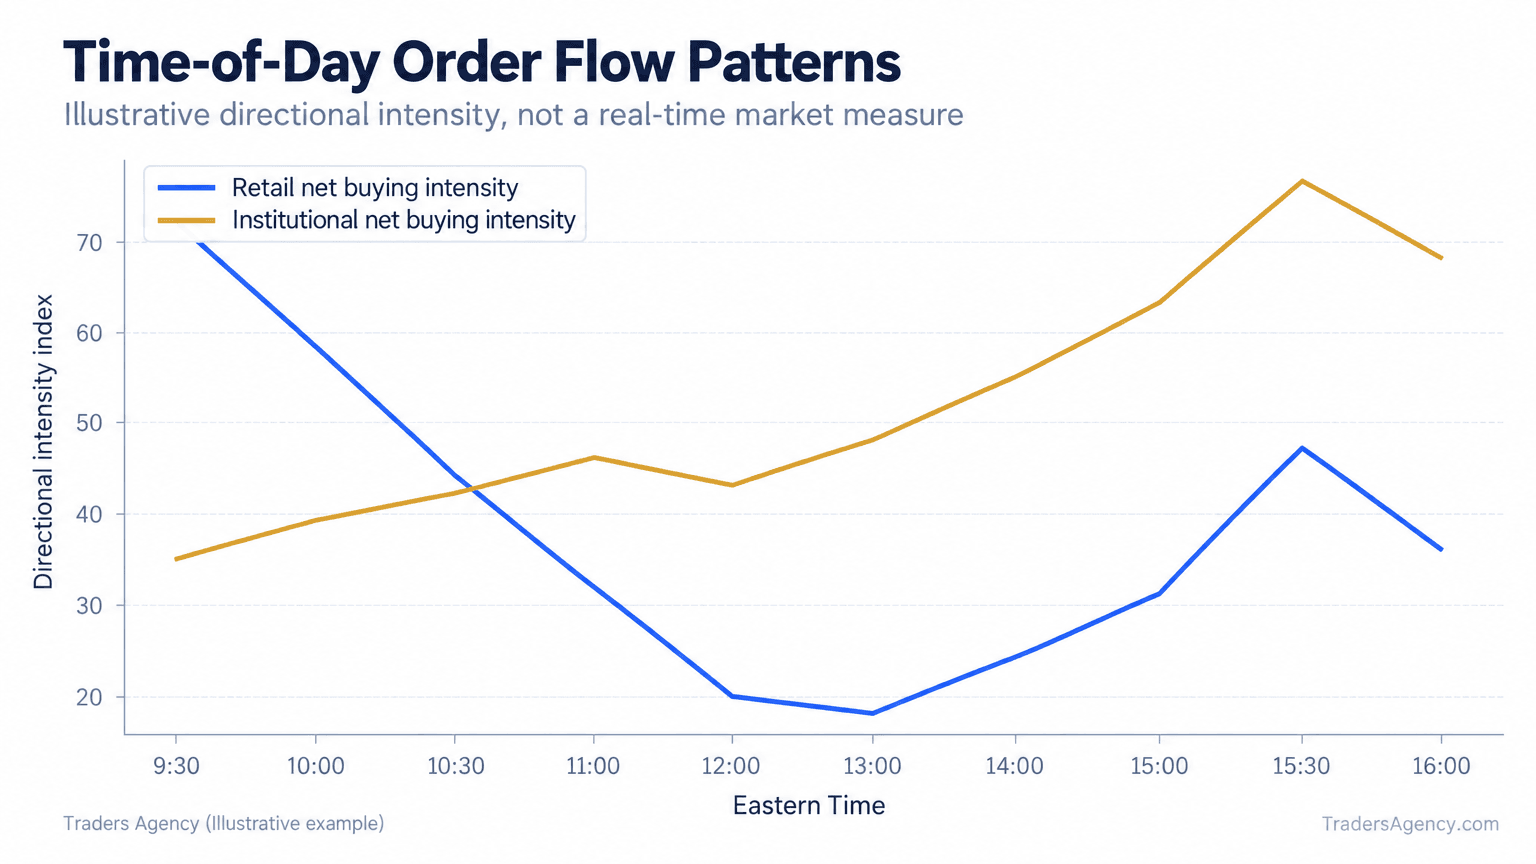
If you're scanning an institutional order flow indicator on TradingView or a similar platform, cross-check the signal against the time stamp. A buy signal firing at 9:32 AM carries very different weight than the same signal firing at 3:45 PM.
Want expert trading insights delivered daily?
Join thousands of traders who rely on Traders Agency for market analysis and trade ideas.
Join Traders AgencyUsing Flow Trackers to Spot Retail Activity
A handful of research providers publish retail flow trackers that estimate aggregate retail buying and selling activity across the market, built from brokerage and exchange data rather than guesswork. We use these trackers as a market-wide baseline instead of relying on just one ticker's time-and-sales tape.
When retail flow trackers show heavy buying across meme-adjacent names while broad institutional positioning data shows funds trimming exposure, that gap is worth paying attention to. We don't treat any single tracker as gospel. Combining a flow tracker with your own trade-size and venue analysis gives you a far sharper read than relying on a random forum thread for your answer.
What Happens When Retail Flow Diverges from Institutional Flow?
Divergence happens when retail traders are aggressively buying a stock while institutional positioning data suggests funds are flat, reducing, or outright shorting the same name.
This is the setup behind several well-known 2021-era squeezes, where retail buying pressure overwhelmed institutional short positioning for a period of days. It's also one of the riskiest setups a trader can try to play, because divergence can resolve in either direction and often resolves violently.
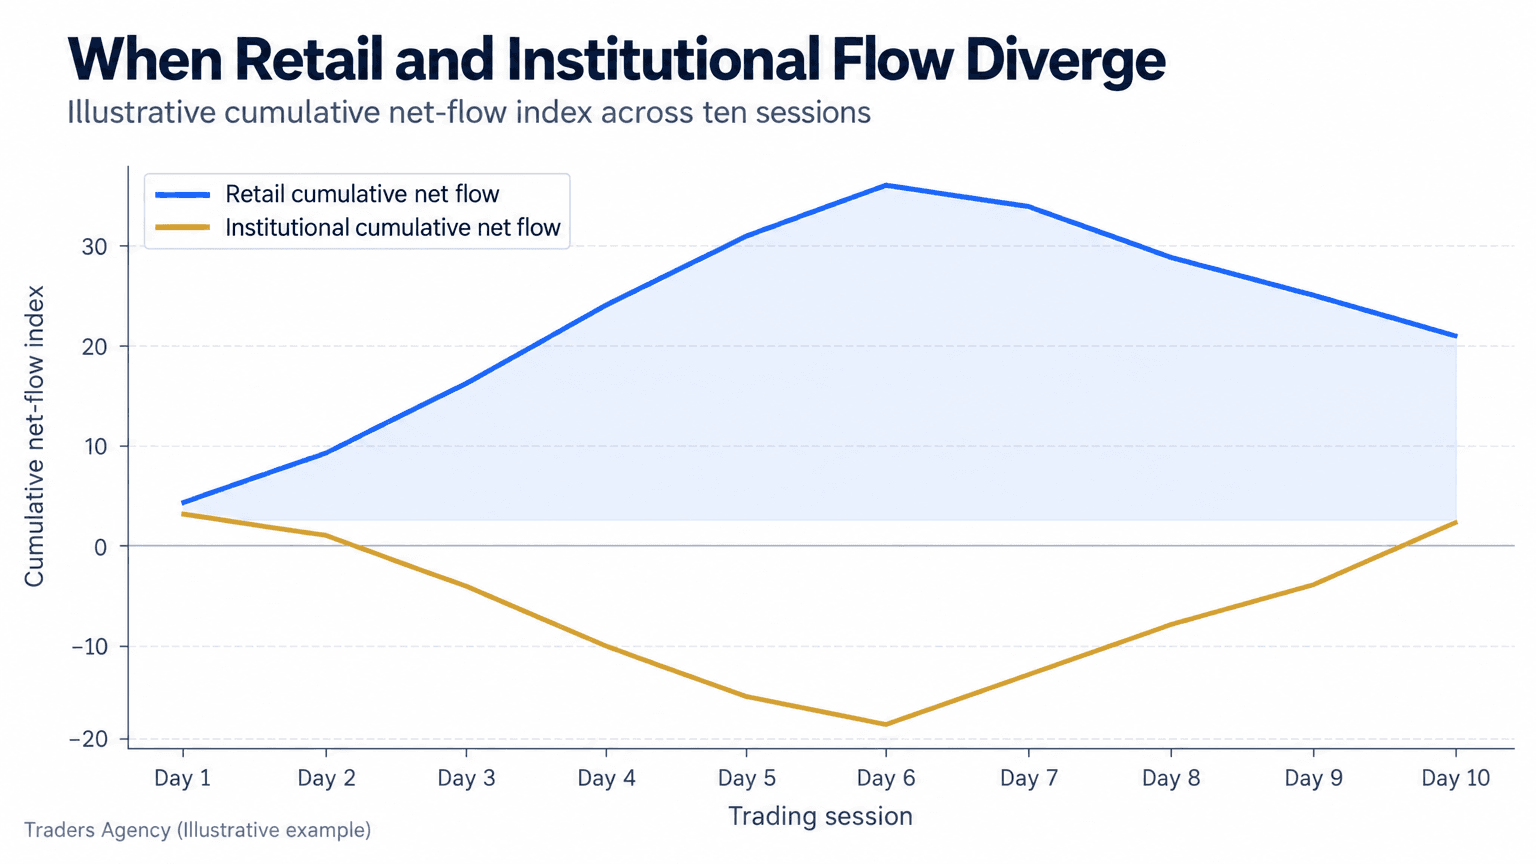
Here's what we tell our members about divergence trades:
- Size down aggressively. These setups move fast in both directions, and normal position sizing can expose you to outsized losses.
- Define your exit before entry. Decide your stop loss and profit target before you place the trade, not while you're watching it move.
- Watch for convergence. When institutional flow data starts tilting back toward retail sentiment, the move often loses steam quickly.
- Never assume retail wins. Institutions have more capital and more patience. Betting against them because a forum is excited is not a strategy.
Watch Out: Divergence trades are among the most volatile setups in the market. If you trade them at all, treat them as a small, defined-risk slice of your activity, never as a core strategy.
Common Mistakes When Reading Order Flow Data
The most common mistake we see is treating a single data point, like one large trade print, as confirmation of institutional buying without checking time-of-day context or venue data.
- Confusing volume with conviction. High volume can mean heavy retail churn rather than directional institutional accumulation.
- Ignoring sector-wide flow. A single stock's order flow means less without checking whether the whole sector is seeing similar activity.
- Over-relying on free indicators. Many free institutional order flow indicator tools on charting platforms use proxy calculations, not verified institutional data, so treat them as a starting point rather than a conclusion.
- Skipping the research. If you're studying methodology around institutional order flow, cross-reference it against live market data rather than trading off theory alone.
Putting This Into Practice
Order flow analysis works best as a confirmation tool, not a standalone entry signal. We teach our members to use it alongside their existing technical and fundamental work, never as a replacement for it.
This approach favors traders who are patient enough to check multiple signals, trade size, timing, venue, and third-party trackers, before acting. It does not favor traders looking for a fast, single-indicator shortcut to front-run institutions, because that kind of certainty simply doesn't exist in retail-accessible data. Keep your position sizing conservative when trading on flow divergence specifically, since these are among the most volatile setups in the market.
Want expert trading insights delivered daily?
Join thousands of traders who rely on Traders Agency for market analysis and trade ideas.
Join Traders AgencyDISCLAIMER: Traders Agency does not offer financial advice. The information provided is for educational purposes only and should not be considered financial advice. Traders Agency is not responsible for any financial losses or consequences resulting from the use of the information provided. Trading carries inherent risks and may not be suitable for all individuals. You are advised to conduct your own research and seek personalized advice before making any investment decisions, recognizing the potential risks and rewards involved.
See more from Traders Agency on Google
Make us a preferred source and our market analysis will appear more prominently in your Google Search, Top Stories, and AI results.
Add to Preferred Sources