
Hey, Ross here:
On Friday I told you why the selling got so ugly late Thursday.
We had an estimate from 1 p.m. on the day.
Then stocks fell even further.
Now we have an estimate for the full day. Take a look.
Chart of the Day
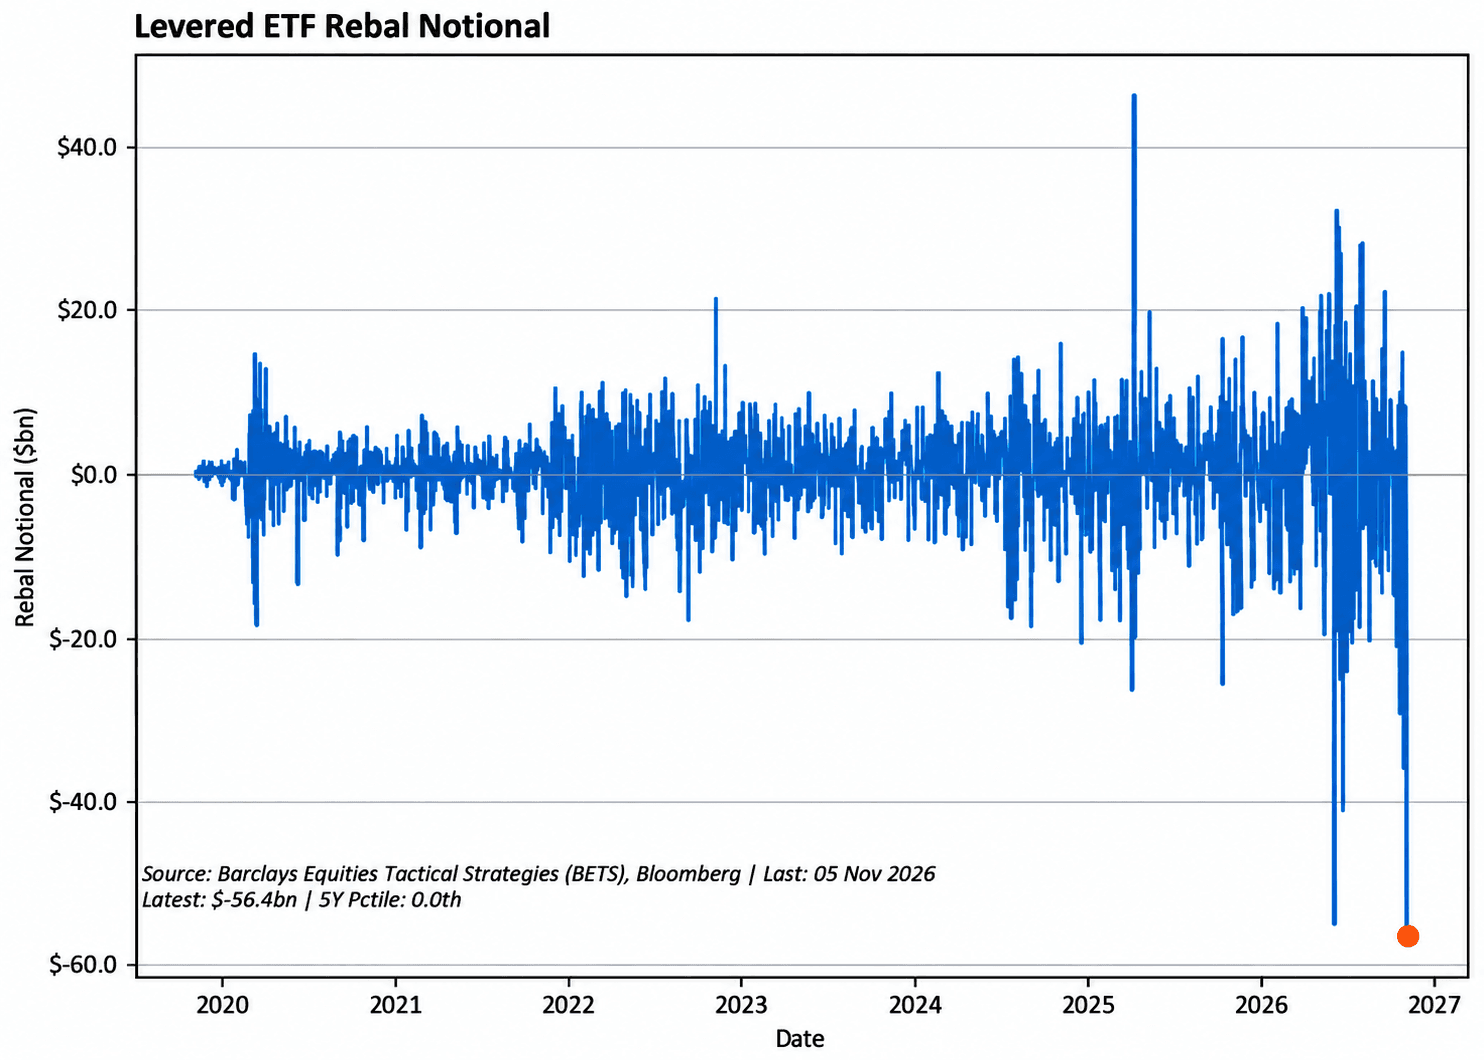
This chart estimates how much stock exposure leveraged ETFs had to buy or sell to reset for the next day.
Look at Thursday. Barclays estimates those funds faced the biggest forced sale on record.
That backs up what we saw Friday. The deeper stocks fell, the more those funds had to unload.
But that’s only what happened INSIDE the funds.
What were the people who invested in them doing?
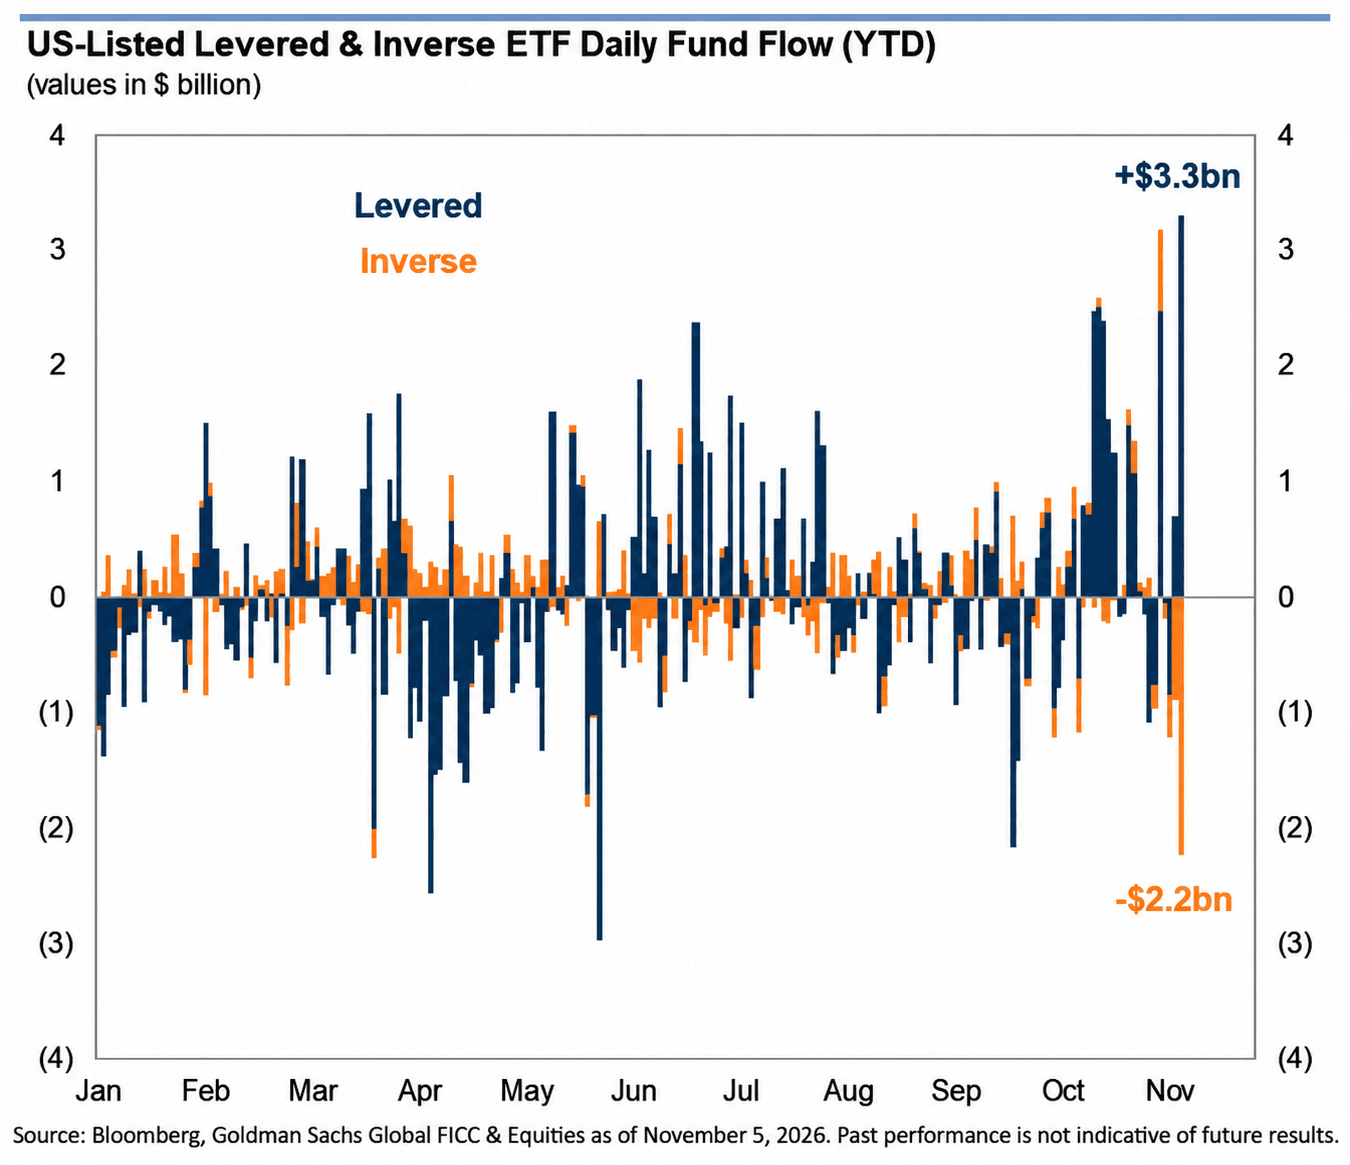
Look at the leveraged ETFs in this chart. These funds give traders a way to bet on a bounce and multiply their gains if stocks rise. Investors put $3.3 billion into them Thursday.
Now look at the inverse ETFs. Those funds gain when stocks fall. Investors pulled $2.2 billion out of them.
So, while leveraged ETFs were being forced to massively unwind positions (fuelling the market drop)…
Traders were already aggressively buying the dip…
While simultaneously exiting funds that would have allowed them to profit if stocks dropped further.
Strange behavior, no?
And that leads us to the insight below.
Insight of the Day
Anomalous behavior can lead to profitable moves.
When you’ve been trading the markets as long as I have, you learn a lot about spotting patterns.
Because ultimately, trading is all about pattern recognition.
For example, you can watch a stock long enough and you get a feel for how it trades.
Maybe buyers step in every time it drops to $40.
After a few bounces off that price, you know where to look for them next time.
But more important than spotting patterns…
Is learning to spot breaks in patterns – anomalies.
Because what I’ve learned over the many years…
Is that these anomalies can pinpoint huge price moves.
Because when established patterns break – there tends to be very good reasons behind them (even if we don’t know it yet).
That’s also why I look beyond the index after a selloff.
I want to see which stocks are drawing buyers while the rest of the market is getting hit.
In this morning’s live market breakdown, I walked through what I’m watching after the selloff.
If you missed it, you can click here to watch the free replay.
Customer Story of the Day
“Best service available, and I have tried them all.
Ross is the only one who spends his time trying to TEACH you how to do it rather than telling you buy this sell that.
It’s like the old saying, “Give a man a fish you feed him for a day, Teach a man to fish, you feed him for life.”
As a lifetime private trading club member I would Highly, Highly recommend TA to anybody, and I have recommended it to several of my friends and family.”
Embrace the surge,

Ross Givens
See more from Traders Agency on Google
Make us a preferred source and our market analysis will appear more prominently in your Google Search, Top Stories, and AI results.
Add to Preferred Sources