
The S&P 500 just staged one of its fastest reversals in recent memory, ripping more than 6% higher over the past five trading days. That is the biggest gain the index has seen since last year's tariff tantrum. We have been tracking this aggressive shift in momentum closely, and the numbers tell a clear story. Here is exactly what traders need to know right now.
A move of this size forces every market participant to rethink their short-term positioning. When the market climbs 6% in a single trading week, it creates immediate friction for short sellers and drags cash off the sidelines. The speed of this recovery is the defining feature of the current environment.
We are digging into the underlying data to see if this momentum can actually hold. The contrast between short-term velocity and the medium-term trend points to a highly volatile market. Our research team has broken down the specific metrics driving this price action.
What Triggered the S&P 500 Rapid-Fire Comeback?
The recent surge was driven by a sudden and extreme shift in momentum, producing a 6% gain in just five days. That aggressive buying pressure marks the single largest move the index has posted since last year's tariff tantrum.
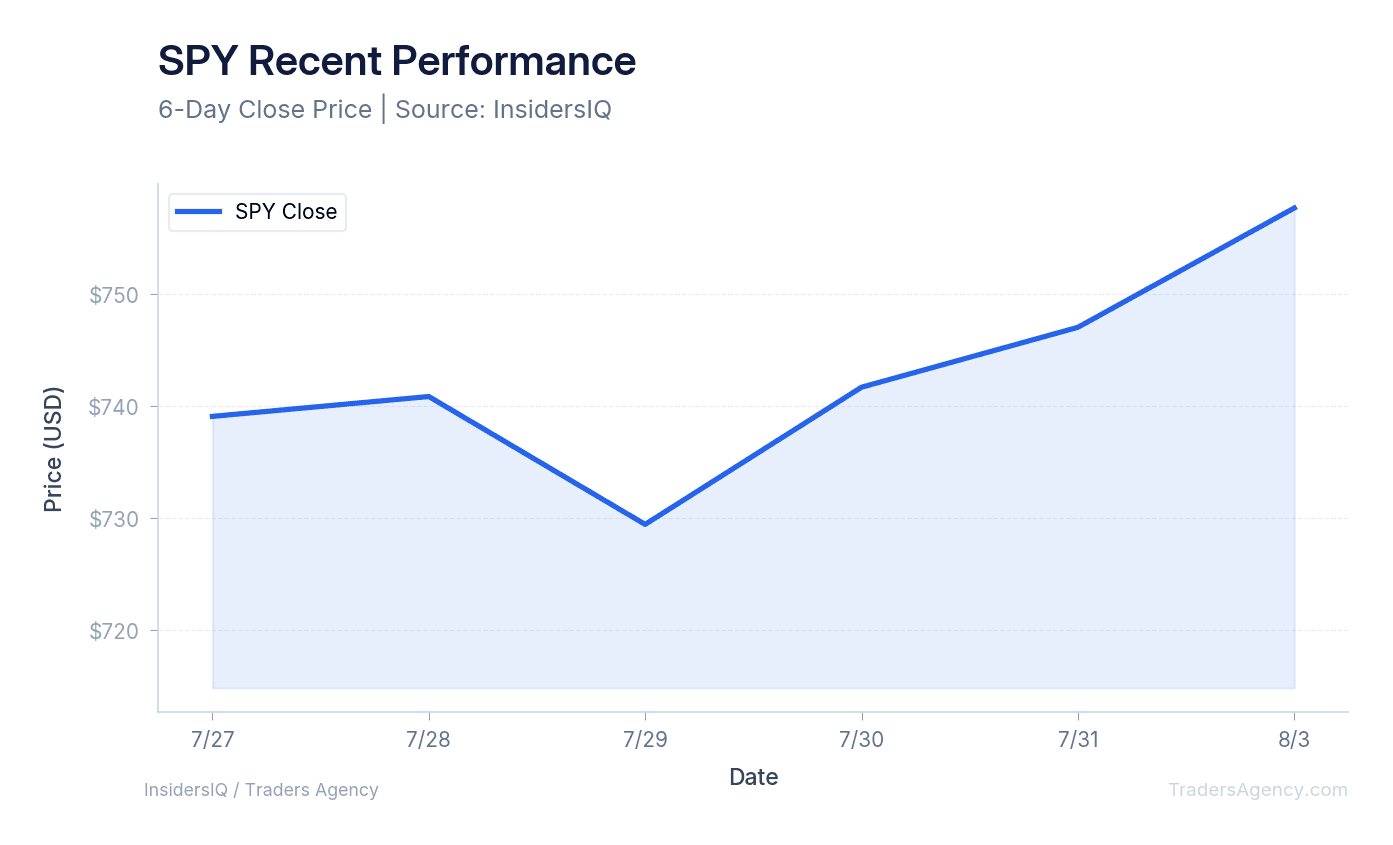
Our analysis of the primary index tracker reveals a telling timeline. The SPY ETF shows a 10-day price change of just +2.51%. When you set that 10-day figure against the five-day surge of 6%, the math suggests the market was lower in the first half of the 10-day window before the reversal.
The Number: SPY posted a 10-day return of +2.51%, yet the last five days alone accounted for a 6% gain. That means the first half of the window was lower before the snapback.
The Fear & Greed reading and the retail sentiment metrics help round out the picture of what is driving this price action.
What Do Investors Need to Know About This Rally?
Current market sentiment is leaning heavily toward greed. The Fear & Greed index is sitting at 68, and retail attention remains active, with 2,748 WallStreetBets mentions and a retail sentiment score of 0.03.
That Fear & Greed reading of 68 is a major focal point for us. This metric aggregates several market indicators to measure the emotion driving price action, and a reading of 68 places the market firmly in Greed territory. Buyers are aggressively stepping in and willingly accepting higher risk.
Pair that sentiment with the 6% five-day surge and the picture sharpens fast: participants are afraid of missing the move. We are also watching the retail side closely. The 2,748 mentions on WallStreetBets show retail traders are actively discussing this rally across social channels.
Yet the sentiment score of 0.03 points to a relatively neutral, only slightly positive tone among those retail participants. In a broad market rally like this one, the rising tide of the index tends to lift most individual equities, which makes these sentiment metrics worth tracking.
How Does This Compare to Last Year's Tariff Tantrum?
This 6% surge over five days is the biggest gain the index has posted since last year's tariff tantrum. Both events feature extreme short-term velocity, forcing traders to adjust their exposure quickly or get left behind.
The comparison matters for our analysis. During that earlier episode, the market took a sharp, headline-driven selloff followed by a recovery. Whether the current price action follows that same blueprint remains to be seen.
Broad index ETFs like SPY often become the go-to vehicle for capturing these rapid market-wide recoveries. The +2.51% 10-day return on SPY captures the extreme volatility of this stretch.
Rapid recoveries tend to test the psychological discipline of traders. The fear of missing out can push late capital into the market, driving the Fear & Greed index even higher than its current elevated level of 68. Traders have to stay objective when historical patterns repeat this closely.
Want expert trading insights delivered daily?
Join thousands of traders who rely on Traders Agency for market analysis and trade ideas.
Join Traders AgencyFactors to Consider Right Now
The main factor to weigh is balancing the 6% five-day gain against the broader 10-day trend. Traders have to measure this extreme short-term momentum against the risk of buyer exhaustion.
With the Fear & Greed index at 68, the market is officially in Greed territory. That reality has to shape every risk management decision from here. Buying into a market that just rallied 6% in five days demands strict stop-loss placement and careful position sizing.
We are paying very close attention to the retail sentiment score of 0.03. That low positive reading, despite a massive rally, signals real disbelief among retail traders. They are clearly talking about the market, as the 2,748 mentions show, but they are not overwhelmingly bullish in their language.
This gap between price action and retail sentiment is a classic wall of worry. The market is climbing while a large slice of retail remains skeptical. When we evaluate this environment, these are the signals we are tracking:
- Velocity: The sheer speed of the 6% five-day surge
- Divergence: The modest +2.51% 10-day SPY return against that five-day rip
- Sentiment: The extreme Greed reading of 68 on the index
- Retail tone: The muted 0.03 retail sentiment score across 2,748 mentions
The Most Important Things to Know Right Now
During a rapid recovery, the two things that matter most are price velocity and sentiment extremes. A 6% move in five days is a statistical outlier that fundamentally changes the immediate risk profile of the market.
We believe chasing extended moves without a plan is a fast way to lose capital. The SPY 10-day return of +2.51% shows the market was trading lower just days ago. Traders who panicked and sold during the drawdown missed the 6% recovery.
For anyone watching from the sidelines, periods of high volatility are the best free education available. Studying how the market behaves with a Fear & Greed index at 68 is a lesson in market psychology that costs nothing and requires no capital at risk.
We note that this is the biggest gain since last year's tariff tantrum, though whether the current pattern repeats that episode remains to be seen.
What Should Traders Watch Next After This Surge?
We have flagged several specific data points and behavioral shifts to monitor over the coming days. The aftermath of a 6% five-day surge demands careful observation and strict discipline.
1. The SPY 10-Day Trend
We are watching the SPY ETF to see if the +2.51% 10-day return can expand. If the index consolidates and holds these gains, it validates the underlying buying pressure. A failure to hold would suggest the comeback was nothing more than a temporary rally.
2. Shifts in the Fear & Greed Index
The current reading of 68 puts the market firmly in Greed. We want to see whether this pushes higher into Extreme Greed or begins to cool as the rally matures. A rising index would point to more speculative buying from latecomers.
3. Retail Sentiment Divergence
The gap between the 6% market gain and the muted 0.03 retail sentiment score is unusual. We are monitoring the 2,748 WallStreetBets mentions to see if retail traders eventually capitulate and turn aggressively bullish. A sudden spike in retail sentiment often marks the end of a short-term rally.
4. Historical Resistance Levels
Because this is the biggest gain since last year's tariff tantrum, we are studying the price levels that halted that earlier rally. Markets have memory, and the resistance zones from last year's recovery may come back into play.
The Bottom Line
This rapid-fire comeback has completely reset the market's short-term trajectory. A 6% surge in five days, producing a +2.51% 10-day return for SPY, shows buying velocity that cannot be ignored. With the Fear & Greed index at 68 and retail sentiment registering just 0.03 across 2,748 mentions, we are holding to strict risk management while respecting the upward momentum. We will keep tracking these metrics to gauge the true staying power of this rebound.
Want expert trading insights delivered daily?
Join thousands of traders who rely on Traders Agency for market analysis and trade ideas.
Join Traders AgencyKey Takeaways
- The S&P 500 gained more than 6% in just five trading days, marking its largest single-week move since last year's tariff tantrum.
- SPY's 10-day return of only +2.51% against a 5-day gain of 6% confirms the index was lower in the first half of that window, meaning the reversal was sharp and compressed.
- The Fear and Greed Index is sitting at 68, signaling greed territory, which historically raises the odds of short-term consolidation after a fast run-up.
- Retail sentiment registered just 0.03 across 2,748 mentions, suggesting the broader public has not fully chased this move yet.
- Short sellers face immediate pressure when the market climbs 6% in a week, and cash on the sidelines tends to get pulled in, which can extend momentum but also sets up crowded positioning.
DISCLAIMER: Traders Agency does not offer financial advice. The information provided is for educational purposes only and should not be considered financial advice. Traders Agency is not responsible for any financial losses or consequences resulting from the use of the information provided. Trading carries inherent risks and may not be suitable for all individuals. You are advised to conduct your own research and seek personalized advice before making any investment decisions, recognizing the potential risks and rewards involved.
See more from Traders Agency on Google
Make us a preferred source and our market analysis will appear more prominently in your Google Search, Top Stories, and AI results.
Add to Preferred Sources