You've probably watched a stock price stall at a specific whole number and wondered why it simply refused to break out. The answer is usually hiding in the order book. When you rely solely on candlestick charts, you're looking at the past. Level 2 market data gives you a glimpse into the immediate future by showing exactly what traders are planning to do next. Our team considers this forward-looking visibility a massive advantage. We rely on this data to see exactly where buyers and sellers are stacking their orders. By the end of this guide, we'll teach you how to read the tape, spot hidden orders, and identify genuine buying pressure before the price actually moves.
What Is Level 2 Market Data?
Bottom Line: Level 2 market data gives traders visibility into the live order book, showing stacked bids and asks that can explain why prices stall at key levels. The core discipline is treating order walls as conditional signals: when the wall holds, it may support a trade; when it disappears, the reason to stay in the trade disappears with it. Position sizing and screen time are the two practical levers that separate consistent tape readers from those chasing unreliable setups.
Level 2 market data provides a multi-tiered view of the stock market order book, displaying the exact number of shares traders are bidding to buy or asking to sell at specific price points. This depth of market information reveals the underlying supply and demand dynamics driving a stock's price direction.
When you look at a standard stock quote, you only see the highest price someone is willing to pay and the lowest price someone is willing to accept. Level 2 data pulls back the curtain. It shows you the entire queue of limit orders waiting to be filled.
Think of it like looking at a line outside a store. A basic quote tells you someone is at the door. The order book tells you exactly how many people are in line and how much money they have to spend. The Securities and Exchange Commission (SEC) emphasizes the importance of understanding order execution, and seeing the full book is a big part of that.
Key Concept: Level 2 market data is a real-time display of all open buy and sell orders at multiple price levels. It shows you the full depth of supply and demand behind a stock's current price, giving you forward-looking information that candlestick charts alone cannot provide.
What Is the Difference Between Level 1 and Level 2 Market Data?
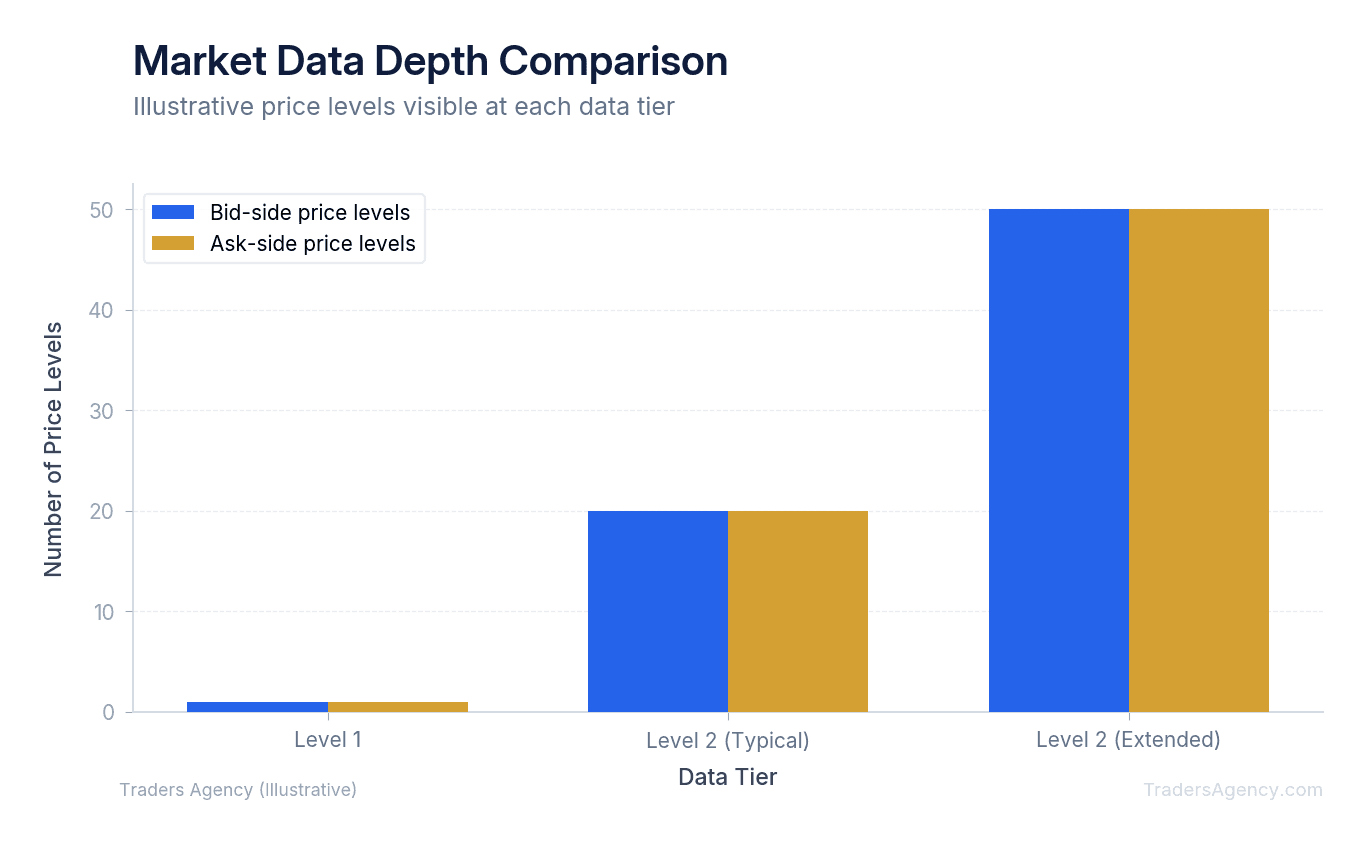
The main difference between Level 1 and Level 2 market data is the depth of information provided. Level 1 only shows the single best bid and ask price available in the market. Level 2 displays multiple price tiers, revealing dozens of pending orders stacked behind the current market price.
Traders comparing Level 1 vs Level 2 market data quickly realize that Level 1 is insufficient for active day trading. If a stock is trading at $150.00, Level 1 might show a bid of $149.99 and an ask of $150.01. It tells you nothing about what happens if a large order sweeps those prices.
Here's a practical example using TSLA. If TSLA is trading at $200.50, Level 1 data gives you a very narrow view. You have no idea if there are ten shares or ten thousand shares waiting just outside that penny spread.
Level 2 data solves this problem completely. It lists the exact share quantities sitting at $200.45, $200.40, and $200.00. This visibility prevents you from buying into a hidden wall of sellers. It also helps you identify massive pools of liquidity where institutional buyers are waiting to scoop up shares.
| Feature | Level 1 Data | Level 2 Data |
|---|---|---|
| Price Levels Shown | 1 bid/ask pair | 20+ price levels each side |
| Order Size Visibility | Top of book only | Full depth at every level |
| Market Maker IDs | Not shown | Displayed per order |
| Use Case | Casual monitoring | Active day trading and scalping |
| Cost | Free with most brokers | Free to $25/month depending on platform |
How Do You Read Level 2 Market Data?
You read Level 2 market data by analyzing the size and concentration of orders on the bid and ask sides of the book. By comparing the total number of shares buyers want to purchase against what sellers are offering, you can determine the immediate path of least resistance.
The order book is divided into two columns. The left side shows the bids (buyers), and the right side shows the asks (sellers). Each row displays the market maker or exchange routing the order, the specific price, and the size of the order.
Order sizes are typically displayed in round lots (multiples of 100 shares). If you see a size of 50 on the bid side, that represents 5,000 shares. We teach our members to look for abnormalities in these numbers.
Identifying Bid and Ask Stacking
Stacking occurs when multiple large orders cluster at a specific price level. If you see sizes of 100, 250, and 400 all sitting at an ask price of $25.50, that is a massive wall of 75,000 shares acting as resistance.
When the price approaches $25.50, the stock will likely struggle to break through unless there is extreme buying volume. We prefer to short into these large ask walls or take profits on long positions just below them at $25.45.
Spotting Imbalances
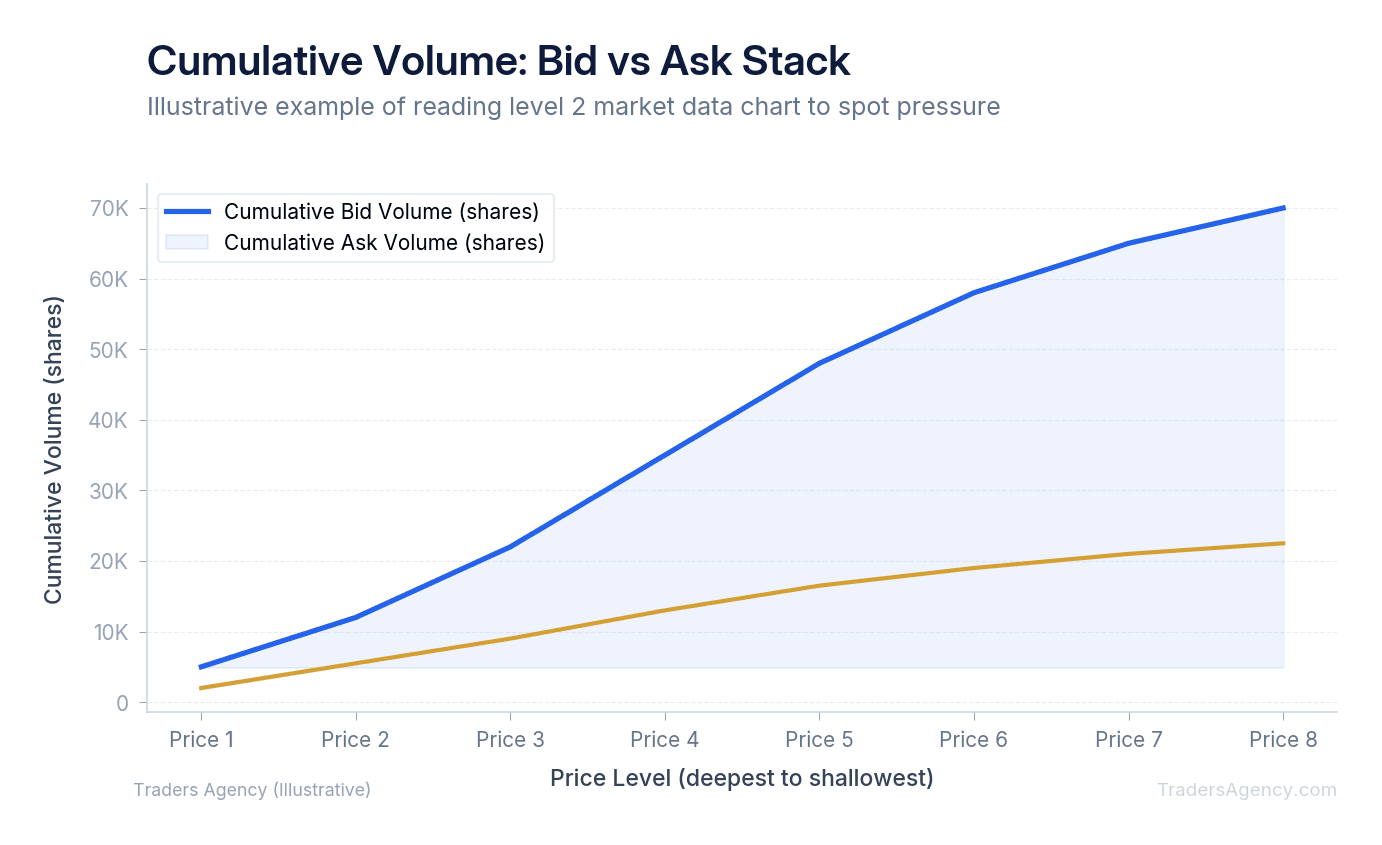
An imbalance happens when one side of the book is significantly heavier than the other. If the bid side has a total of 10,000 shares waiting to buy, but the ask side only has 1,000 shares waiting to sell, the price is highly likely to move up. There is simply not enough supply to satisfy the demand.
Reading a Level 2 market data chart alongside the raw order book helps confirm these imbalances visually.
Key Concept: A 10:1 bid-to-ask imbalance is a strong directional signal. When buyers outnumber sellers by that margin at the current price level, expect upward pressure. The reverse applies for heavy ask-side imbalances.
How Do You Spot Market Maker Activity and Hidden Orders?
Institutional traders and market makers do not want you to see their massive orders. If a hedge fund needs to buy 100,000 shares of AAPL, showing that entire order on the book would cause the price to instantly spike.
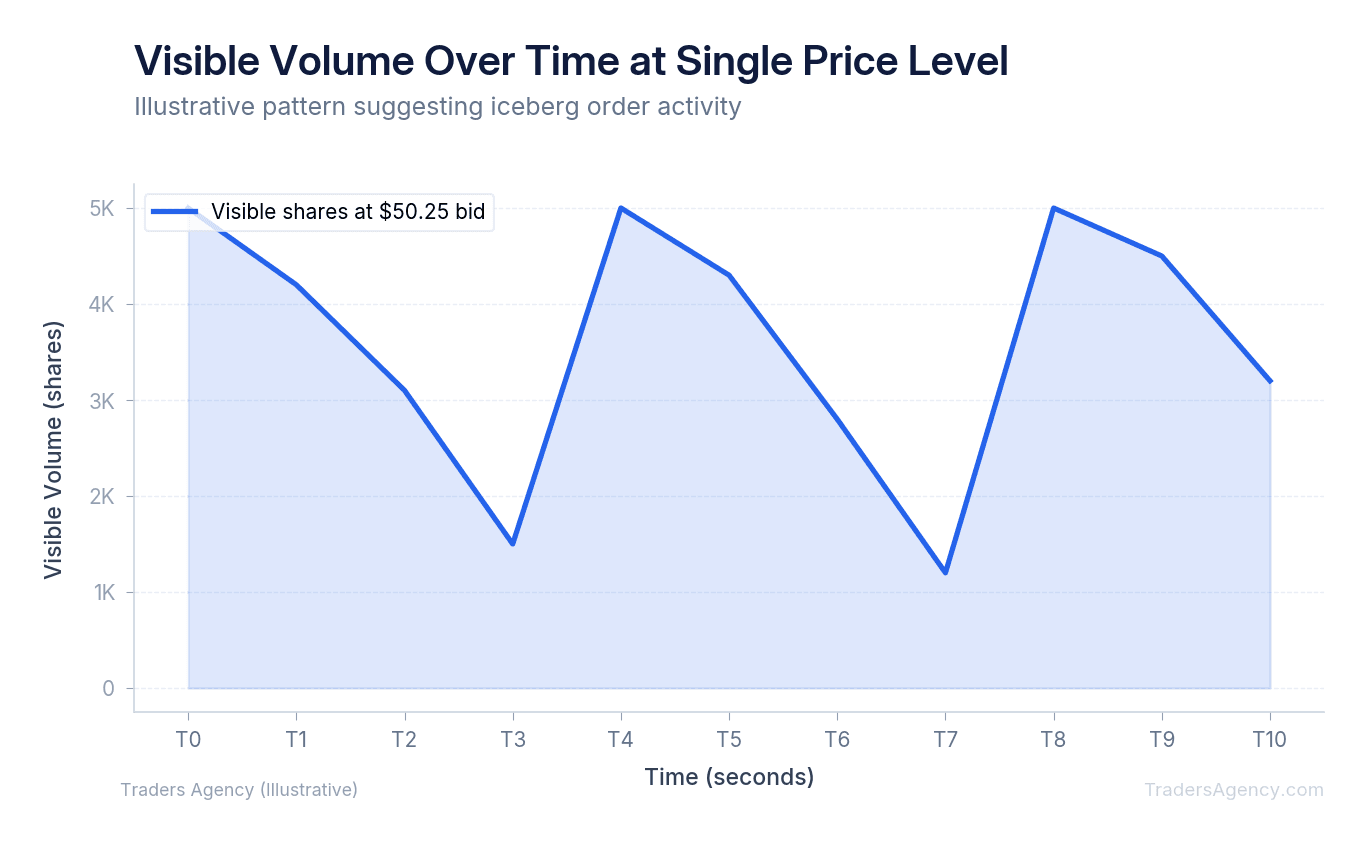
Instead, they use hidden orders or iceberg orders. They might only display 1,000 shares on the bid at a time. Market makers are paid to provide liquidity, meaning they are constantly buying and selling to keep the market moving. You will frequently see their specific identification codes, like NITE or ARCA, dominating the order book.
Here's our step-by-step process for identifying and trading around iceberg orders:
- Watch the Refresh: To spot a hidden order, watch how the order book reacts to active trading volume. Say you see a bid for 1,000 shares at $45.00. The time and sales window shows that 3,000 shares were just sold at $45.00. Logically, that bid should disappear because the order was filled.
- Identify the Iceberg: If that $45.00 bid immediately refreshes and shows another 1,000 shares, you have found an iceberg order. A large institutional buyer is sitting at that price, absorbing all selling pressure. We recommend placing your own buy orders just above this level, perhaps at $45.02. You are using the institution's massive hidden buy order as your personal stop-loss support.
- Ride the Bounce: Once the sellers exhaust their shares into the hidden buyer, the supply dries up. The institutional buyer will often have to raise their bid to keep accumulating shares, driving the price higher. Your entry at $45.02 is now in profit, and your risk was strictly defined by the $45.00 floor.
| Parameter | Value |
|---|---|
| Stock | Example ticker at $45.00 support |
| Entry | $45.02 (just above iceberg bid) |
| Stop Loss | $44.95 (below hidden order level) |
| Risk per Share | $0.07 |
| Target | $45.50+ (once supply exhausts) |
Want expert trading insights delivered daily?
Join thousands of traders who rely on Traders Agency for market analysis and trade ideas.
Join Traders AgencyWhere Can You Get Level 2 Market Data for Free?
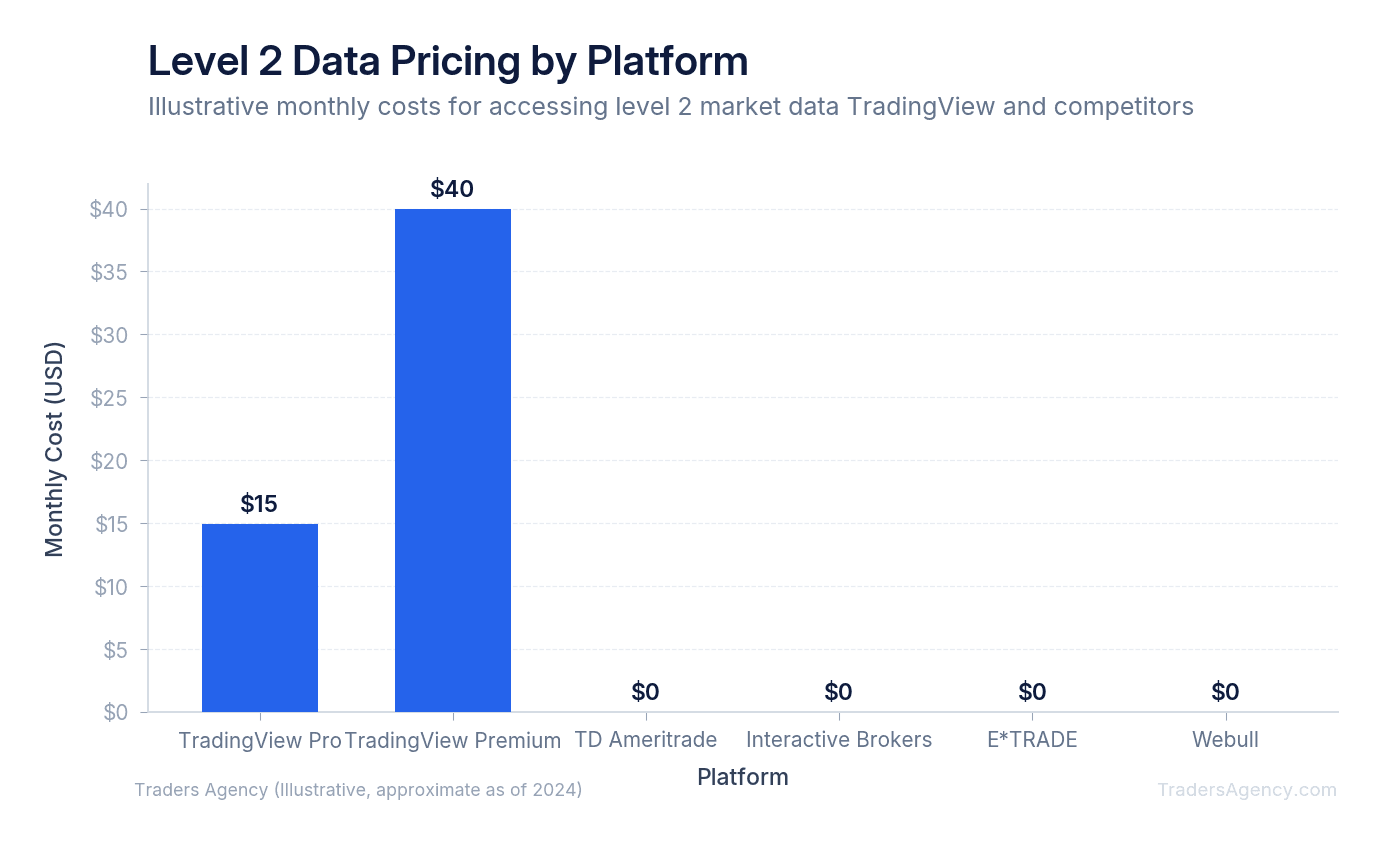
You can get Level 2 market data for free through select brokerages like Webull, moomoo, and Thinkorswim, provided you maintain an active funded account. Other platforms require a monthly subscription fee to access real-time depth of market data directly from the major stock exchanges.
Many new traders want to access Level 2 data without paying expensive monthly fees. Most zero-commission brokers offer promotional periods for this data. However, professional traders often prefer dedicated charting software. The quality of your data feed directly impacts your trading performance. Free feeds often only show a single exchange, like the Nasdaq Basic feed. This means you are missing all the orders routed through other major exchanges.
Setting Up Level 2 Data on TradingView
TradingView does not provide full depth of market data on their basic free tier. To get Level 2 data access on TradingView, follow these steps:
- Subscribe to a paid TradingView plan (Premium or higher recommended for active traders).
- Purchase the specific exchange data add-on such as Nasdaq TotalView or ARCA Book.
- Open the Depth of Market (DOM) panel on your charting screen to view the full order book.
This setup costs roughly $15 to $25 per month depending on the exchanges you select. We find this cost is easily justified by the edge it provides in active day trading. Setting up a Level 2 order book on TradingView gives you the true picture of supply and demand. The visibility is non-negotiable for serious scalpers.
How Do You Use Level 2 Data to Build a Trading Strategy?
You use Level 2 data to build a trading strategy by combining order book imbalances with technical chart patterns to pinpoint precise entry and exit levels. Traders look for large resting orders to act as support or resistance, allowing for extremely tight risk management and stop-loss placement.
Level 2 data should never be used in isolation. We teach our members to use the order book as a confirmation tool for setups that already exist on the chart.
Executing a Breakout Trade
Here's a complete trade execution using this data. We're watching AMD approaching a major daily resistance level at $100.00. The chart looks bullish, but we need confirmation from the order book.
- Identify the Wall: We look at the Level 2 data and see a massive ask wall of 150,000 shares sitting exactly at $100.00. We do not buy the stock at $99.90. Buying right under a massive supply zone is a fast way to lose money.
- Watch for Absorption: Heavy buying volume hits the time and sales window. We see the 150,000 share ask wall drop to 100,000, then 50,000, and finally it disappears entirely. The buyers just consumed all the supply.
- Enter on the Break: This is our exact entry signal. We buy AMD at $100.02 the moment the wall breaks, placing our stop loss at $99.85.
- Capture the Move: The stock immediately surges to $100.50 because there is no more resistance left on the book. That's a $0.48 per share gain with only $0.17 of defined risk.
| Parameter | Value |
|---|---|
| Stock | AMD |
| Resistance Level | $100.00 (150K share ask wall) |
| Entry | $100.02 (after wall absorbed) |
| Stop Loss | $99.85 |
| Target | $100.50+ |
| Risk/Reward | Approximately 1:2.8 |
When to Avoid Level 2 Data
The order book can be highly misleading under certain market conditions. You must know when to ignore the tape:
- Low Float Stocks: Stocks with very few shares available for trading are highly volatile. The order book moves too fast, and large orders are frequently canceled before they execute.
- Pre-Market Trading: Liquidity is very low before the opening bell. A large order in the pre-market might just be a bluff to manipulate retail sentiment.
- Algorithmic Spoofing: High-frequency trading algorithms often place massive orders with no intention of filling them. They flash a fake 50,000 share sell order to scare retail traders into selling, only to cancel it a millisecond later.
Watch Out: Spoofing is illegal but still common. If you see a massive order appear and disappear within seconds, do not trade based on it. Wait for orders that actually get filled before making decisions. The time and sales window (the "tape") is your confirmation tool.
Risk Management Rules
Always base your position sizing on your maximum acceptable loss. If you buy a stock at $30.10 because there is a massive bid wall at $30.00, your stop loss must be placed at $29.98.
If that bid wall disappears or gets filled, the support is gone. You must exit the trade immediately. We never risk more than 1% to 2% of our total account equity on a single order book setup. This discipline is what separates profitable tape readers from traders who blow up their accounts chasing phantom liquidity.
Our education team publishes new strategy guides and market analysis every week. Level 2 reading is a skill that improves dramatically with screen time. Practice watching the order book alongside your charts, and the patterns will become second nature.
Want expert trading insights delivered daily?
Join thousands of traders who rely on Traders Agency for market analysis and trade ideas.
Join Traders AgencyKey Takeaways
- Level 2 market data shows the full queue of limit orders waiting to be filled, not just the best bid and ask, revealing supply and demand dynamics before price moves.
- Candlestick charts reflect past price action; the order book shows what traders are actively planning to do next, giving tape readers a forward-looking edge.
- Large stacked orders at a price level can act as support or resistance, but when that order wall disappears or gets filled, the support is gone and the trade thesis is invalidated.
- The article recommends risking no more than 1% to 2% of total account equity on a single order book setup to avoid losses from phantom liquidity.
- Recognizing hidden orders and genuine buying pressure before price moves is a learnable skill that improves with screen time spent watching the order book alongside charts.
DISCLAIMER: Traders Agency does not offer financial advice. The information provided is for educational purposes only and should not be considered financial advice. Traders Agency is not responsible for any financial losses or consequences resulting from the use of the information provided. Trading carries inherent risks and may not be suitable for all individuals. You are advised to conduct your own research and seek personalized advice before making any investment decisions, recognizing the potential risks and rewards involved.
See more from Traders Agency on Google
Make us a preferred source and our market analysis will appear more prominently in your Google Search, Top Stories, and AI results.
Add to Preferred Sources



