
You have probably seen a stock trading in a tight, predictable range and wondered how to extract maximum value from that low volatility. A butterfly spread is a multi-leg options strategy designed to capture premium when an underlying asset remains near a specific target price. The butterfly spread payoff peaks exactly at the middle strike price at expiration, offering a highly favorable reward-to-risk ratio. We will walk you through advanced mechanics, including broken-wing variants, Greeks management, and professional-grade adjustments. Our team prefers this structure for range-bound markets because it strictly caps potential losses while providing a clear mathematical edge. By the end of this guide, you will know exactly how to structure, optimize, and manage these complex trades in your own portfolio.
What Is a Butterfly Spread Strategy and How Does It Work?
Bottom Line: A butterfly spread is best suited to range-bound markets where the underlying is likely to settle near a specific price at expiration. The strategy's strictly defined risk and favorable reward-to-risk ratio are genuine advantages, but they only translate into consistent results when position sizing is disciplined and adjustments are made systematically rather than reactively. Traders who track their outcomes over a large sample size will be best positioned to judge whether the edge holds in their specific market conditions.
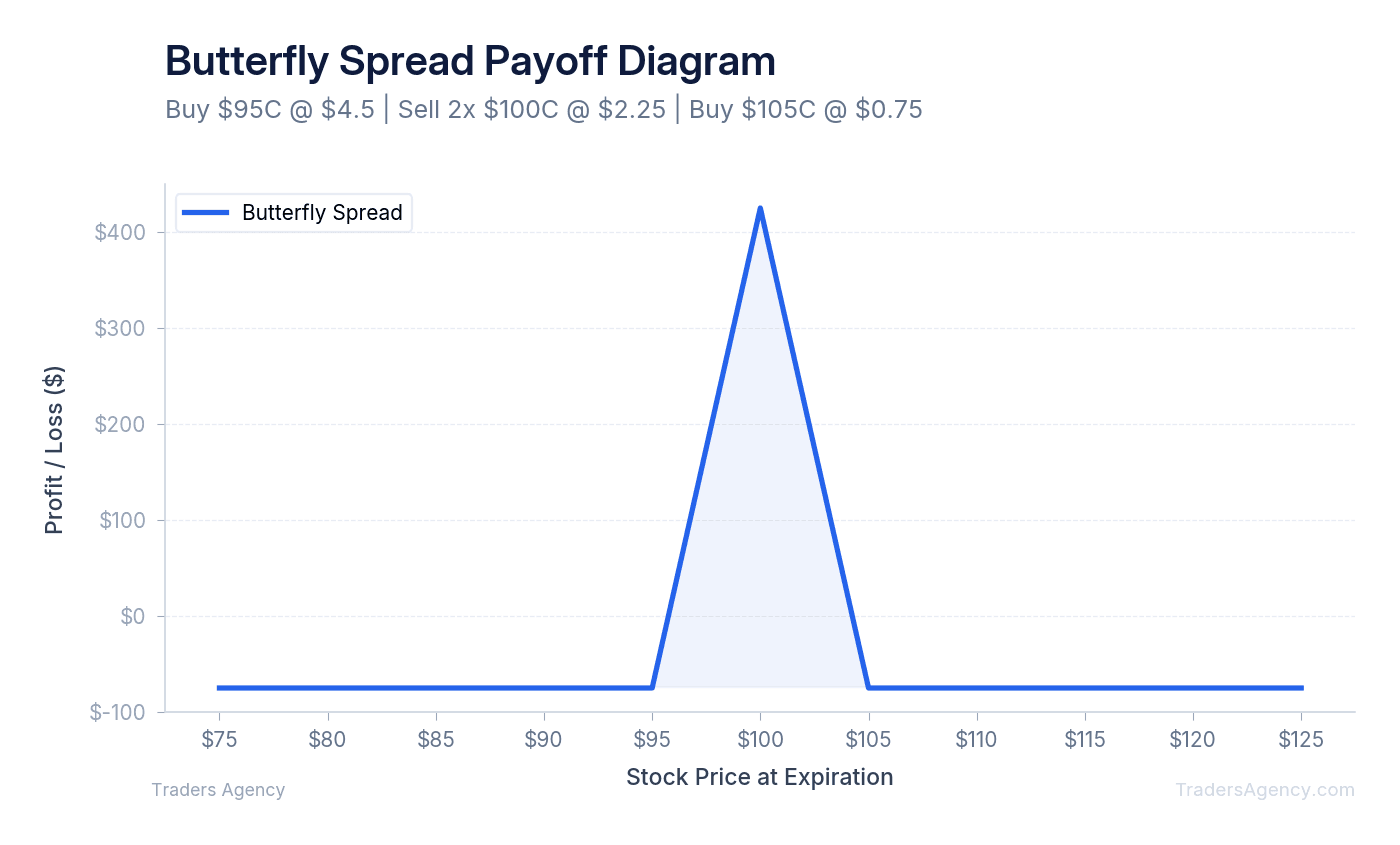
A butterfly spread is a defined-risk, neutral options strategy constructed by buying one in-the-money option, selling two at-the-money options, and buying one out-of-the-money option. The butterfly spread payoff maximizes profit if the underlying asset closes exactly at the short strikes at expiration, while strictly capping potential losses.
This structure uses three distinct strike prices, all within the same expiration cycle, using entirely calls or entirely puts. The distance between the lower strike and the middle strike equals the distance between the middle strike and the upper strike. You are essentially combining a bull spread and a bear spread that share a common short strike.
The goal is for the underlying stock to pin exactly at your short strikes on expiration day. If this happens, the short options expire at the money (worthless), while your in-the-money long option retains its full intrinsic value, producing the maximum spread value.
Key Concept: A butterfly spread is built with three strike prices at equal intervals. You pay a small net debit to enter the trade, and that debit represents your absolute maximum loss. Both risk and capital requirements are inherently limited by the structure itself.
Is a Butterfly Spread Better Than a Short Straddle?
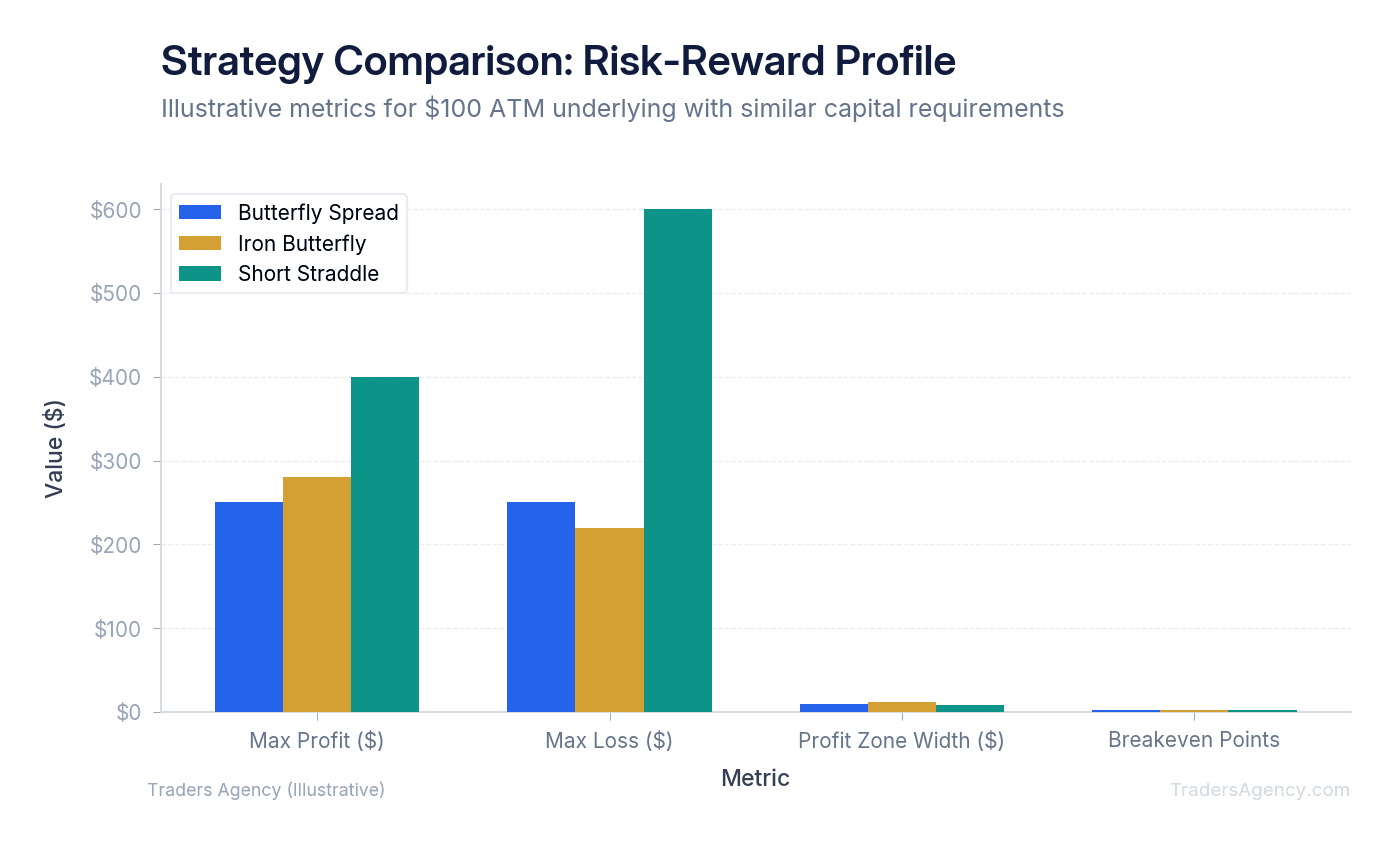
A butterfly spread is generally a better strategy than a short straddle for traders who require strict risk management. While a short straddle collects more premium upfront and features a wider breakeven zone, it carries unlimited risk. A butterfly spread caps maximum losses, making it much safer for volatile markets.
We teach our members to view the butterfly as a hedged straddle. When you sell a straddle, you are naked on both sides of the market. A sudden gap up or gap down can cause catastrophic losses.
By purchasing the outer wings in a butterfly structure, you define your risk. The tradeoff is a narrower profit tent and a lower probability of profit. However, the return on capital is often much higher because the margin requirement for a defined-risk trade is significantly lower than for a naked straddle.
| Metric | Butterfly Spread | Short Straddle |
|---|---|---|
| Maximum Loss | Capped (net debit paid) | Unlimited |
| Premium Collected | Lower (net debit entry) | Higher (net credit entry) |
| Profit Zone Width | Narrower | Wider |
| Margin Requirement | Low (defined risk) | High (naked exposure) |
| Return on Capital | Often superior | Lower relative to risk |
How Do the Greeks Affect a Butterfly Spread Position?
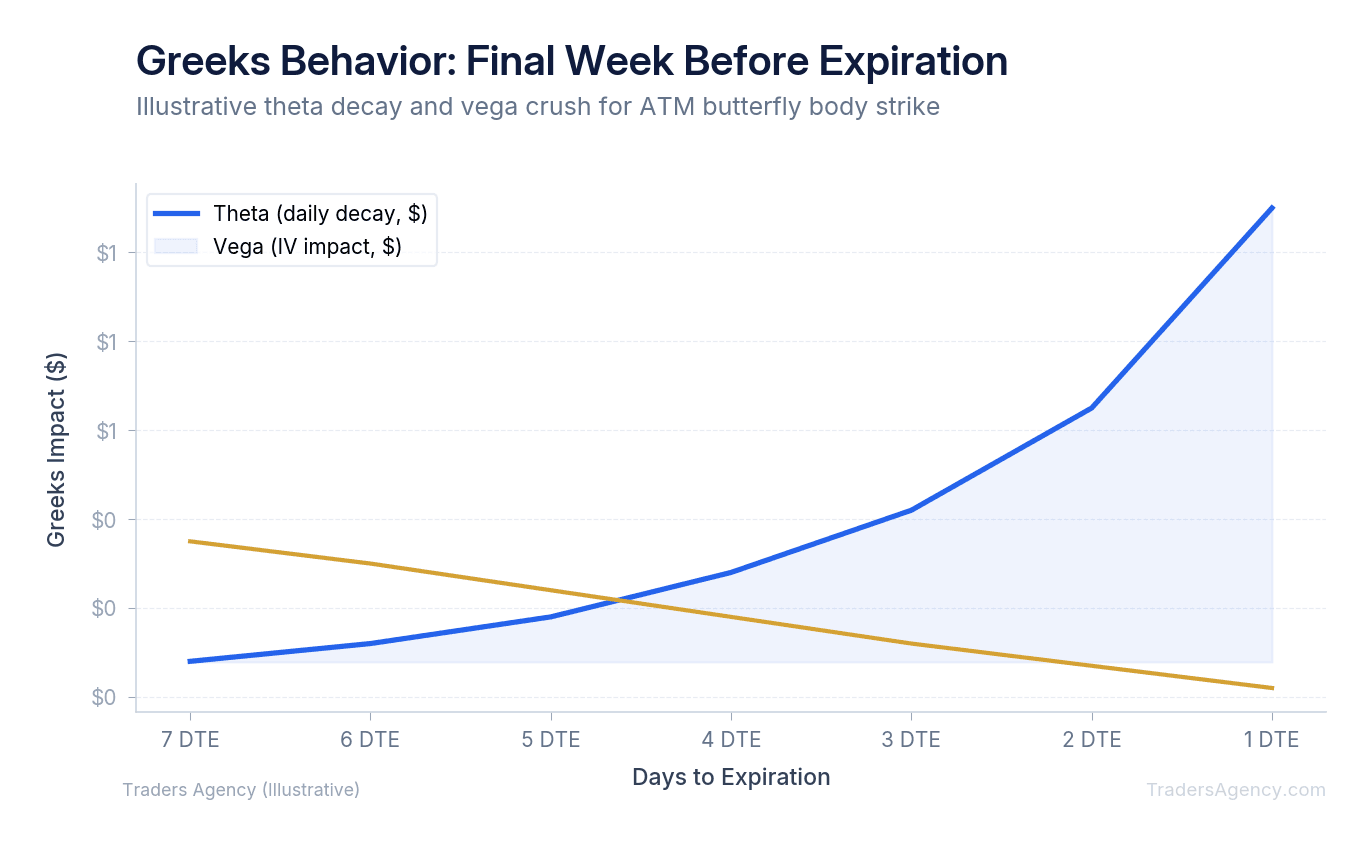
Theta and vega heavily influence a butterfly spread near expiration. Theta decay accelerates rapidly in the final days, benefiting the short middle strikes. Simultaneously, a drop in implied volatility (known as vega crush) increases the position's value because the two short ATM options, which carry the highest vega, lose more value than the long wings.
Because you are short two options and long two options, the Greeks interact in complex ways depending on where the stock price sits relative to your strikes.
When the stock is near your middle short strikes: The position has positive theta and negative vega. You want time to pass quickly, and you want implied volatility to drop. The short options will lose value faster than your long options, pushing the trade into profitability.
When the stock moves toward your long wings: The Greek profile flips. The position becomes negative theta and positive vega. In this scenario, time decay hurts you, and you need an increase in volatility to push the stock back toward the center.
Key Concept: A butterfly spread's Greek profile changes dynamically based on where the stock trades relative to your strikes. Near the center, time is your friend. Near the wings, time works against you. This is why active management matters.
Want expert trading insights delivered daily?
Join thousands of traders who rely on Traders Agency for market analysis and trade ideas.
Join Traders AgencyHow Do You Build a Butterfly Spread Step by Step?
To understand the mechanics, consider a concrete butterfly spread strategy example using the SPY ETF. Assume SPY is currently trading exactly at $500, and we expect it to stay pinned at this level through Friday's expiration.
- Step 1: Identify the Setup Conditions. We want to build a standard call butterfly. We need to select a lower long strike, two middle short strikes, and an upper long strike. The distance between the strikes must be identical. We will use a $10 strike width.
- Step 2: Execute the Trade. Here is how we structure the legs and the associated premiums:
Leg Action Premium $490 call Buy 1 $12.00 (debit) $500 calls Sell 2 $5.00 each ($10.00 credit) $510 call Buy 1 $1.50 (debit) To calculate the total cost: add the long premiums ($12.00 + $1.50 = $13.50) and subtract the short premiums collected ($10.00). The net debit is $3.50, or $350 per contract.
- Step 3: Calculate the Outcome Boundaries. The math for this setup provides clear boundaries for risk and reward:
Parameter Value Maximum Loss $350 (initial debit paid). Occurs if SPY closes below $490 or above $510. Maximum Profit $650 (strike width $10 minus debit $3.50 = $6.50 × 100). Occurs if SPY pins exactly at $500. Lower Breakeven $493.50 (lower strike + debit: $490 + $3.50) Upper Breakeven $506.50 (upper strike - debit: $510 - $3.50) - Step 4: Visualize the Payoff. If you look at a standard butterfly spread strategy chart, you will see a distinct peak at $500, with profitability sloping downward until it crosses the breakeven points. Your reward-to-risk ratio on this trade is 1.86:1 ($650 max profit / $350 max risk).
What Is a Broken-Wing Butterfly Spread and When Should You Use It?
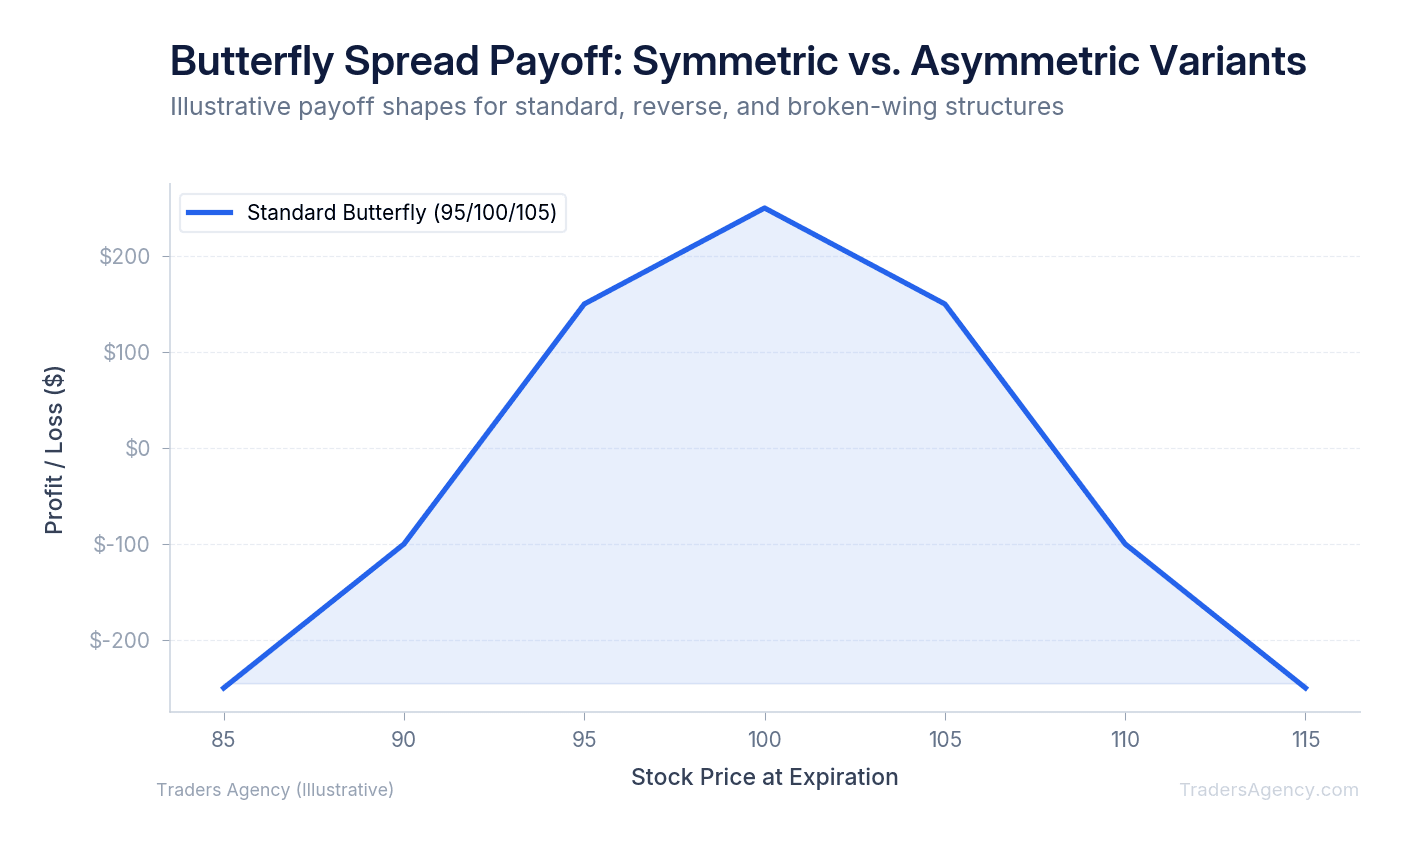
Advanced traders rarely stick to perfectly symmetrical strikes. By adjusting the width of the wings, you can shift your risk profile to match a directional bias. This is known as a broken-wing butterfly.
If you are slightly bullish, you might widen the upper wing. Instead of buying the $510 call in our previous example, you might buy the $515 call. This reduces the cost of the trade (or even creates a net credit) but introduces additional risk on the upside. The broken-wing structure allows you to eliminate risk on one side of the trade entirely, provided you enter for a net credit.
The Reverse Butterfly Spread
Traders use a reverse butterfly spread when they expect explosive volatility but do not know the direction. In a reverse setup, you sell the outer wings and buy the middle strikes. This creates a net credit position that profits if the stock makes a massive move in either direction, functioning similarly to a long straddle but with capped profit potential.
Is a Butterfly Spread Profitable in High Volatility?
A standard butterfly spread is rarely profitable to initiate when implied volatility is already low and expected to rise. The strategy thrives on volatility contraction. You want to enter the trade when implied volatility is high, anticipating a drop (vega crush) before expiration.
Many traders ask us when they should avoid this strategy. We do not recommend opening standard butterflies ahead of major binary events like earnings announcements or Federal Reserve rate decisions. The underlying asset is highly likely to blow past your breakeven points, resulting in a maximum loss.
Instead, we prefer deploying this strategy in the aftermath of a large move, when a stock settles into a consolidation phase. The elevated volatility premium makes the short middle strikes expensive, reducing your total entry debit and improving your risk-to-reward ratio. You can monitor implied volatility levels and historical patterns through resources like the Cboe Options Exchange.
Watch Out: Do not open standard butterfly spreads ahead of earnings reports, Fed announcements, or other binary events. The stock is likely to gap well beyond your breakeven points, resulting in a full maximum loss on the trade.
How Do You Manage a Butterfly Spread When the Trade Moves Against You?
Professional traders actively manage their positions rather than holding passively to expiration. If the underlying stock threatens one of your breakeven points, you have several adjustment options to defend your capital.
One common adjustment is converting the position into an iron butterfly strategy. If you started with a call butterfly and the stock drops aggressively, you can sell a put spread centered at the same short strike. This brings in additional premium, widening your breakeven zone and reducing your maximum loss.
Our Risk Management Rules
Here are the strict rules we teach our members:
- Never allocate more than 2% of your total account capital to a single butterfly trade. This keeps any single loss from damaging your overall portfolio.
- Take profits when you capture 50% to 60% of the maximum potential gain. Holding for the absolute peak at expiration is a mathematical trap that rarely succeeds.
- Close the position entirely if the underlying stock breaches your short strike with more than 7 days left to expiration. The probability of recovery at that point is too low to justify the risk.
- Avoid holding standard, symmetrical butterflies through earnings reports. The gap risk far outweighs the potential reward.
A short butterfly spread (selling the wings and buying the body) can be used as a defensive roll if your initial long butterfly goes completely out of the money. However, this requires advanced margin approval and adds complexity. For most traders, simply closing the losing trade and re-centering a new butterfly at the current stock price is the cleaner, safer adjustment.
Risk Warning: Butterfly spreads are defined-risk trades, but that does not mean losses are trivial. A string of maximum losses at 2% per trade adds up quickly. Always track your win rate and average return to ensure the strategy remains profitable over a meaningful sample size.
Want expert trading insights delivered daily?
Join thousands of traders who rely on Traders Agency for market analysis and trade ideas.
Join Traders AgencyKey Takeaways
- The butterfly spread payoff peaks exactly at the middle (short) strike price at expiration, making precise target selection the single most important decision in the trade.
- The strategy uses three strike prices in equal-width intervals within the same expiration cycle, buying one ITM option, selling two ATM options, and buying one OTM option.
- Maximum loss is strictly capped, but a string of max losses at 2% per trade compounds quickly, so tracking win rate and average return over a meaningful sample size is essential.
- The broken-wing variant shifts one of the outer strikes to create an uneven spread, which can reduce or eliminate the cost of entry but adds complexity and requires advanced margin approval.
- When a butterfly moves against you mid-trade, closing and re-centering a new butterfly at the current stock price is generally the cleaner, safer adjustment compared to legging into a conversion.
DISCLAIMER: Traders Agency does not offer financial advice. The information provided is for educational purposes only and should not be considered financial advice. Traders Agency is not responsible for any financial losses or consequences resulting from the use of the information provided. Trading carries inherent risks and may not be suitable for all individuals. You are advised to conduct your own research and seek personalized advice before making any investment decisions, recognizing the potential risks and rewards involved.
See more from Traders Agency on Google
Make us a preferred source and our market analysis will appear more prominently in your Google Search, Top Stories, and AI results.
Add to Preferred Sources



