
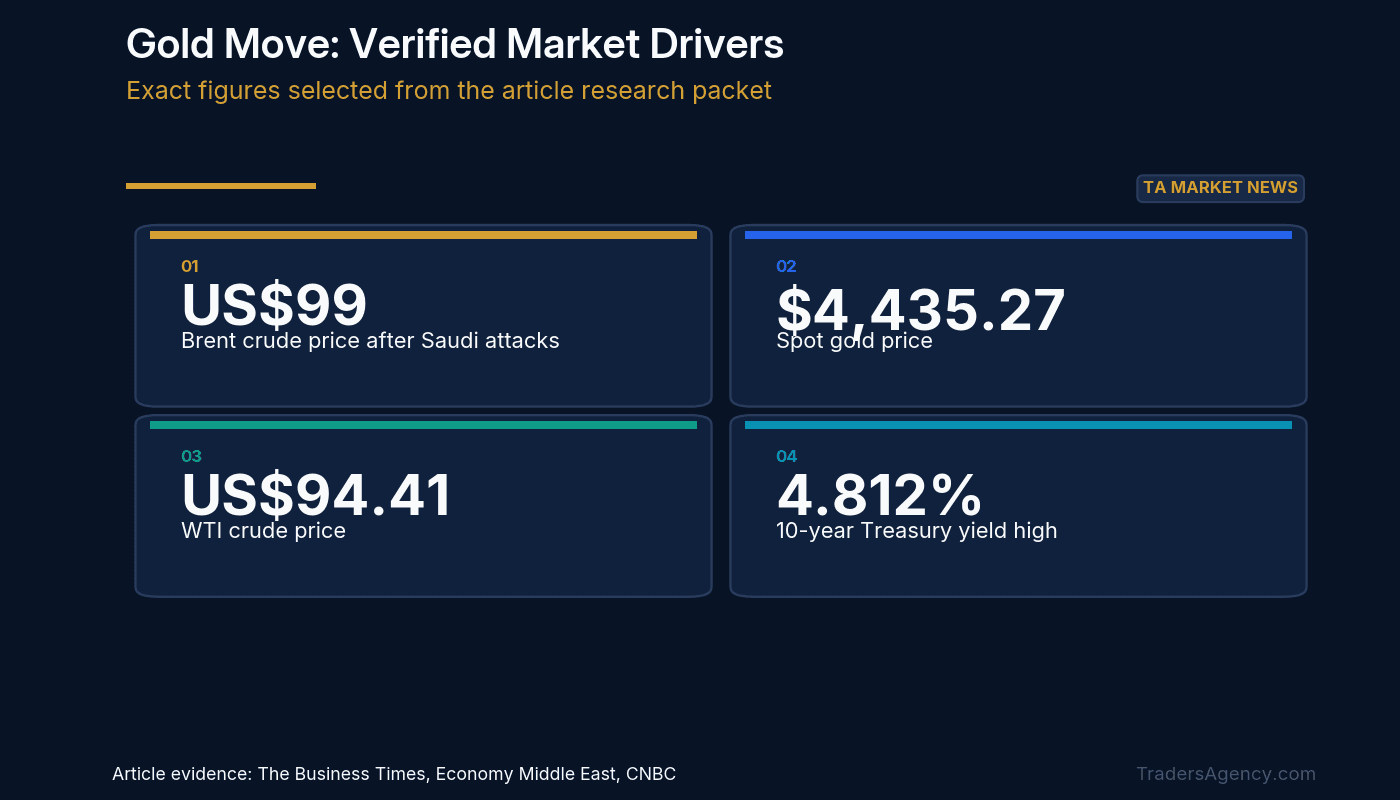
Brent crude versus gold is the comparison drawing attention right now. Attacks on Saudi energy facilities pushed oil toward the psychologically loaded $100 mark while gold quietly notched a gain of its own. Brent crude futures climbed to US$99 a barrel by 0800 GMT, up US$2, or 2.06 percent, after earlier touching US$99.22, the highest print since July 24. Spot gold rose 0.65 percent to $4,435.27 an ounce. The question we keep coming back to: are these two moves telling the same story, or two different ones?
This is not a slow grind. It is a geopolitical shock hitting energy infrastructure in the world's top oil exporter, landing at the same moment markets brace for a Federal Reserve decision and two days of inflation data. When oil, gold, and Treasury yields all move together, positioning across asset classes tends to shift fast.
What happened in the Saudi attacks that spiked Brent crude oil prices?
Operations at some energy facilities in Saudi Arabia were halted Tuesday following attacks by Yemen's Iran-aligned Houthis that wounded 73 people, an escalation Saudi authorities called dangerous, per Reuters reporting carried by The Business Times. That event is the immediate trigger for the oil move traders are reacting to this week.
Here is what the numbers show. Brent crude oil price futures jumped 2.06 percent to $99 a barrel, with an intraday high of $99.22, the strongest level since late July. WTI crude oil price action moved in tandem, trading at US$94.41 a barrel, up US$2.93 or 3.2 percent, after reaching $94.60, its best level since June 8. CNBC separately described Brent hovering near $98 and WTI above $93, a reminder that intraday quote differences are normal while a story is still developing in real time.
The Number: US$99 Brent, an intraday high of US$99.22, and WTI at US$94.41, all off a disruption described only as halts at "some energy facilities" with no quantified barrel-per-day impact disclosed.
That last detail matters more than the headline price. Until official energy and inventory disclosures confirm the scale of the outage, traders are pricing a headline risk premium as much as a hard supply number.
How did the Saudi energy facility attacks affect Brent crude futures?
Our read is that two forces are stacking on top of each other, and separating them is the whole game for anyone trading Brent crude oil price futures this week.
KCM Trade chief market analyst Tim Waterer put it directly: the move reflects both physical tightness, with Hormuz tanker flows well below normal, and a geopolitical risk premium that "is doing a lot of the heavy lifting." That distinction is meaningful. Physical tightness is measurable and sticky. A risk premium can evaporate the moment headlines cool.
The Strait of Hormuz handled about one-fifth of global daily oil and liquefied natural gas supplies before the conflict began in late February, and shipping traffic through the strait slowed again at the start of this week after Iran threatened retaliation for any new US attacks. On September 5, US forces struck three Iranian oil tankers, including one near Kharg Island, Iran's main oil export hub, according to US Central Command, following strikes by Iran's Revolutionary Guards on US warships in the region. That chain of events is why we do not see this as a one-day news blip. It is an active, unresolved shipping corridor problem.
ANZ analyst Daniel Hynes does not expect a full return to pre-war throughput until late Q1 or early Q2 2027. Goldman Sachs raised its Brent and WTI price forecasts by US$5 to $85 and $80 respectively for December 2026, and to $80 and $75 for 2027, on the assumption that Middle East shipping disruptions continue into next year. Those are the two most concrete reference points available for anyone hunting a credible Brent crude oil price prediction.
Brent Crude vs Gold: What's Driving Both?
The Brent crude vs gold relationship this week is less about one asset chasing the other and more about both responding to the same underlying stress from different angles. Oil is pricing supply risk directly at the source. Gold is tracking dollar softness ahead of this week's inflation data.
Gold recovered from the previous session's losses as the Japanese yen extended gains against the US dollar and the US dollar index fell 0.3 percent. Spot gold's climb to $4,435.27 and December gold futures gaining 0.09 percent to $4,480.71 both appear tied to that softer-dollar backdrop rather than to a direct read-through from the oil spike. In broader context, GLD has moved -0.40 percent over the past 10 days, a much flatter path than the sharp single-day pop in spot pricing might suggest, while USO has climbed 6.18 percent over the same window. The oil rally has been building for longer than this one attack headline.
Three things we're watching in this cross-asset setup
- Whether the geopolitical premium in Brent holds or fades. If headline flow around Hormuz shipping and the Saudi facility halts cools, Waterer's framing suggests the risk premium portion of the $99 print could come out of the price quickly.
- How gold behaves into the Fed decision. Markets were pricing a 58% likelihood (CNBC) and a 58.4% probability (Economy Middle East) of a quarter-point Fed hike, both citing the CME FedWatch Tool. The reporting describes rate-hike expectations as a constraint on gold, so that outcome could matter more for the metal than the oil headlines do.
- Whether Treasury yields start reflecting more stress. The 10-year yield reached 4.812% during the session, still below the 4.818% high hit on September 2, itself the highest level since November 2023. The 30-year yield gained more than 1 basis point to 5.261%. TLT is down -0.38% over 10 days, a modest move suggesting bond markets are not yet pricing full-blown crisis conditions.
Want expert trading insights delivered daily?
Join thousands of traders who rely on Traders Agency for market analysis and trade ideas.
Join Traders AgencyWhat Does This Mean for Brent Crude Oil Price Predictions?
Any credible Brent crude oil price prediction right now has to account for both the physical Hormuz bottleneck and a risk premium that can move independently of actual barrels. Goldman's revised forecasts of $85 Brent and $80 WTI for December 2026 assume the disruption extends into 2027, a meaningfully different scenario than quick de-escalation.
That framing also speaks to the why is Brent crude falling question traders will start asking the moment headlines shift. If the halted Saudi facilities come back online faster than expected, or if Hormuz shipping traffic normalizes, the risk premium component Waterer identified could unwind quickly even while physical tightness lingers. If strikes on tankers near hubs like Kharg Island continue, the premium has room to build further.
As for will oil reach $200 a barrel, nothing in the current reporting supports that level. Goldman's own 2026 and 2027 forecasts top out in the $80s, well below that figure, and the move to $99 already reflects a sizeable escalation-driven repricing. We would treat that question as a tail scenario, not a base case grounded in today's data.
What should traders watch next?
The next scheduled market movers are macro, not geopolitical, and they land fast. The producer price index is forecast to show a year-over-year rise of 5.4% in August, up from a prior 4.7% reading, based on FactSet consensus estimates cited by CNBC. The consumer price index is expected to rise 3.3% on the year, a slight easing from the prior 3.4% advance. Investors are awaiting the PPI release Thursday, followed by the CPI report Friday, per Economy Middle East.
- Brent crude oil price live action around the $99 to $99.22 zone is the level to watch for follow-through or rejection.
- WTI crude oil price near $94.41 to $94.60 mirrors the Brent setup and should move in tandem barring a US-specific development.
- Fed rate-hike odds sitting near 58% to 58.4% heading into next week's meeting could shape gold's next leg regardless of what oil does.
- The 10-year Treasury yield's proximity to the 4.818% high from September 2, itself the highest since November 2023, is worth tracking for signs of broader stress building beyond commodities.
What We're Watching Closest: Softer PPI and CPI prints this week could soften the case for another hike, while hotter readings would leave a quarter-point move a meaningful possibility given the 58% to 58.4% odds cited from the CME FedWatch Tool. Either outcome could matter more for gold than for oil right now.
The Bottom Line
We see this week's move as a genuine risk event layered on top of an already tightening physical market, not a manufactured spike. The gap between Brent's headline price and the underlying Hormuz tanker flow data is the clearest signal we have on whether this premium holds. Gold's gain to $4,435.27 looks more tied to dollar softness ahead of this week's inflation data than to oil contagion, so traders leaning on a simple Brent crude vs gold correlation trade should watch the PPI and CPI prints before assuming that relationship holds.
Want expert trading insights delivered daily?
Join thousands of traders who rely on Traders Agency for market analysis and trade ideas.
Join Traders AgencyDISCLAIMER: Traders Agency does not offer financial advice. The information provided is for educational purposes only and should not be considered financial advice. Traders Agency is not responsible for any financial losses or consequences resulting from the use of the information provided. Trading carries inherent risks and may not be suitable for all individuals. You are advised to conduct your own research and seek personalized advice before making any investment decisions, recognizing the potential risks and rewards involved.
- CNBC: Treasury yields little changed ahead of more economic data releases · accessed Sep 8, 2026
- The Business Times: Brent oil surges near US$100 as attacks halt Saudi energy sites · accessed Sep 8, 2026
- Economy Middle East: Gold prices rise to $4,435.27 as softer dollar lifts demand ahead of inflation data · accessed Sep 8, 2026
See more from Traders Agency on Google
Make us a preferred source and our market analysis will appear more prominently in your Google Search, Top Stories, and AI results.
Add to Preferred Sources