
Gold is under pressure again this morning, and the reason sits squarely with the Fed. Spot gold slipped to $4,405.47 per ounce as of 0211 GMT Monday, down 0.5%, according to CNBC, after already shedding 1% on Friday. The trigger: a stronger-than-expected August payrolls report that saw traders push market-implied odds of a September rate hike toward the 60% range. If you are positioned in bullion right now, the mechanism matters more than the headline number.
Why Is Gold Slipping Toward $4,400 Right Now?
Friday's jobs report came in hotter than the market expected, and traders responded by raising the odds they assign to a Fed hike at the September meeting rather than a hold. That is the chain reaction behind this move.
Total nonfarm payroll employment increased by 162,000 in August, following a revised gain of just 21,000 in July, while the unemployment rate held at 4.1%. CME's FedWatch tool showed traders pricing a 58.4% chance of a rate hike at the September 15-16 meeting. Bloomberg-sourced reporting cited in Business Times put the probability closer to 60%, up from an even chance earlier in Friday's session. Whichever figure you anchor to, the direction of travel is identical: hike odds went up, gold came down.
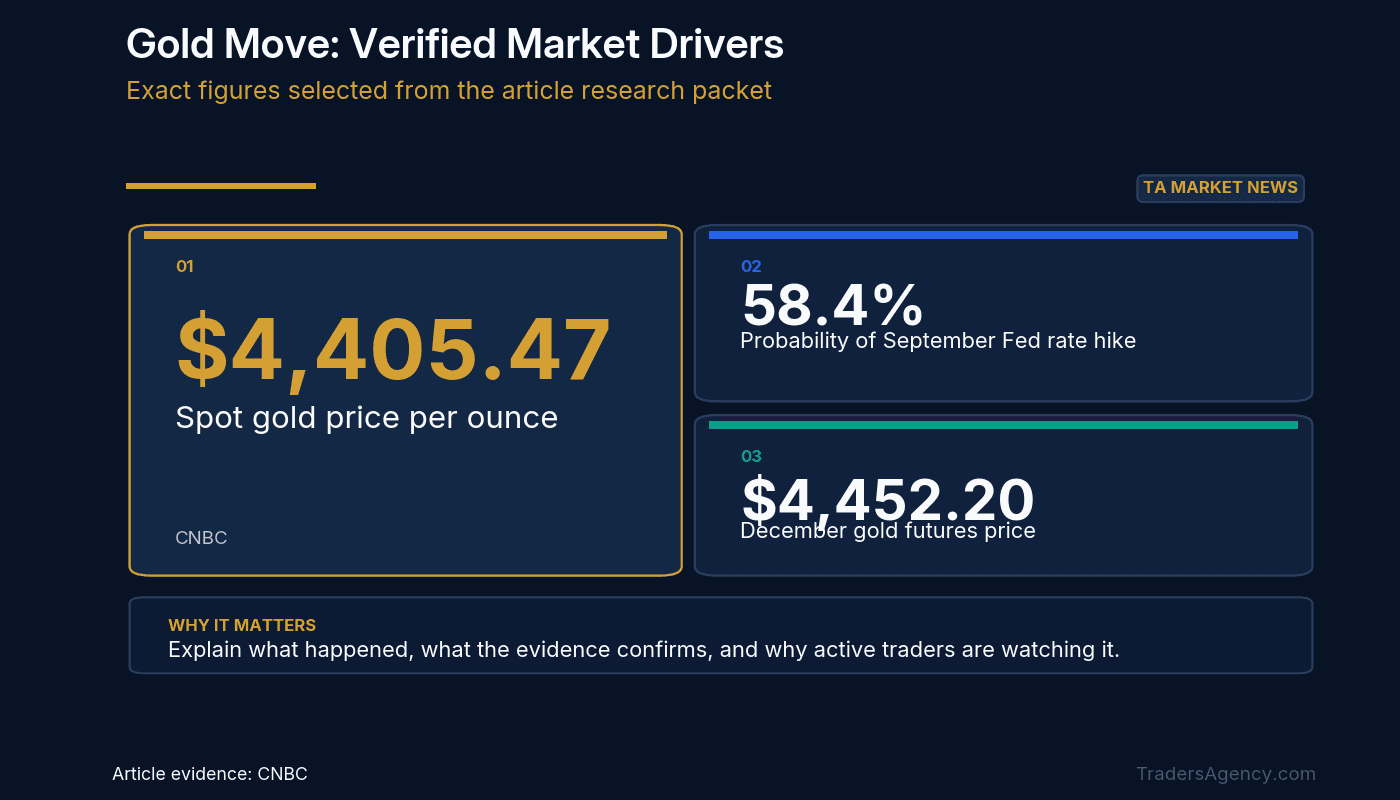
CNBC reported December-delivery U.S. gold futures moved the same way, quoted down 0.5% at $4,452.20. Our read: this is a rates story wearing a gold headline, and separating the two is the first step before reacting to it.
The Number: Spot gold at $4,405.47, down 0.5%, with September hike odds at 58.4% on CME FedWatch. Earlier in Friday's session, Bloomberg-sourced reporting cited in Business Times put those odds at an even chance.
How September Rate-Hike Odds Are Driving Bullion
Higher hike odds pressure gold for one simple reason: bullion pays no interest. When yields rise, holding a non-yielding metal can become relatively less attractive next to assets that generate income. That opportunity-cost dynamic appears to be what has been playing out since Friday's print.
We are watching two tickers as real-time proxies. TLT, the long-duration Treasury bond ETF, is down 0.81% over the past 10 days, a move consistent with pressure in the rate and yield channel. GLD, the gold-backed ETF, has slipped 0.52% over the same window, tracking the spot decline closely. That relationship tells most of the story.
KCM Trade chief market analyst Tim Waterer described the jobs data as delivering "a clear upside surprise" that "put some pressure on the metal, but it wasn't a complete slam dunk for a September rate hike." He added that "the real missing piece of the puzzle arrives this week with U.S. CPI," and that "a strong inflation print would reinforce expectations of a Fed hike, lift yields further and weigh more heavily on gold." That is a conditional view from Waterer, not a certainty, and we would treat it accordingly.
What Could Push Gold Higher From Here?
Gold's own recent behavior shows how quickly this setup can flip. Economy Middle East reported that gold surged 2.3% to $4,488.54 on September 3 after Fed Governor Christopher Waller's comments cut the market-implied September hike probability to 54% from 62%. U.S. gold futures settled 2.8% higher at $4,539.90 that day, per the same report.
That single-session reversal is the clearest evidence we have that any gold price forecast right now depends more on rate-path pricing than on a fixed trajectory. If dovish commentary resurfaces or inflation data disappoints the hawks, the opportunity-cost pressure on bullion could ease just as fast as it built. We are not putting a number on 2027 or 2030 here, because nothing in the current data supports that kind of precision. But a swing between $4,488 and $4,405 in under a week tells you how sensitive this asset remains to Fed-meeting math.
Want expert trading insights delivered daily?
Join thousands of traders who rely on Traders Agency for market analysis and trade ideas.
Join Traders AgencyWhat Could Send Gold Lower?
A stronger-than-expected inflation print this week is the most immediate downside risk we see, since Waterer's view is that it would reinforce hike expectations and lift yields further.
Economy Middle East reported that the Fed's July decision kept the federal funds target range unchanged at 3.5% to 3.75%, with three policymakers, Beth Hammack, Neel Kashkari, and Lorie Logan, dissenting in favor of a quarter-point increase. That split matters for the near-term gold setup, in our view, because it shows a committee that is not unified, and a hot CPI reading could pull more voters toward tightening. Per the same report, the latest available Consumer Price Index data show inflation up 3.4% over the 12 months through July, with core inflation at 2.5%, both above the Fed's 2% objective.
The pullback is not isolated to gold, either. CNBC reported spot silver eased to $66.03, down 0.2%, and platinum dropped 0.8% to $1,805.53. That looks like a broad precious-metals reaction to the rate story rather than anything specific to bullion.
Next on the Calendar: PPI and CPI
Here is what is scheduled. The August Producer Price Index lands Thursday, September 10, followed by the Consumer Price Index on Friday, September 11.
Those two releases are the next real tests for gold over the coming days and weeks. A hot pair of prints could reinforce hike expectations and keep pressure on bullion. A cooler pair could revive the kind of rally gold saw after Waller's September 3 remarks, and could strengthen the case for the Fed to continue holding rates steady. For today, the honest read is that price sits between the $4,488 level printed on September 3 and Monday's $4,405 quote until one of those data points breaks the tie. Neither release on its own decides the policy path.
Key levels and dates we are tracking
- $4,405.47: Monday's reported spot gold quote.
- $4,488.54: the September 3 level reached after Fed Governor Christopher Waller's comments.
- September 10: August PPI release.
- September 11: August CPI release.
- September 15-16: the Fed's next policy meeting.
Is Gold Still a Long-Term Inflation Hedge?
Gold is typically viewed as an inflation hedge, but higher interest rates tend to weigh on the appeal of non-yielding bullion even when inflation itself stays elevated. That is precisely the tension on display this week.
With CPI reported at 3.4% annually through July and core inflation at 2.5%, both above the Fed's objective, the inflation case for gold has not disappeared. The rate-hike odds channel appears to be dominating price action in the near term, with the metal falling even though inflation remains above the Fed's target. That nuance is worth holding onto for anyone building a multi-year gold thesis on inflation alone.
The Bottom Line
Gold's slide toward $4,400 tracks rising September rate-hike odds rather than a breakdown in the metal's longer-term inflation-hedge case. Another Fed rate hike remains a meaningful possibility, and we are watching Thursday's PPI and Friday's CPI as the two data points most likely to shape whether this dip extends or reverses, alongside GLD and TLT as live proxies for how the rate and yield channel is trading. Until those inflation prints land, we are treating gold as a wait-and-watch setup rather than a directional call.
Want expert trading insights delivered daily?
Join thousands of traders who rely on Traders Agency for market analysis and trade ideas.
Join Traders AgencyDISCLAIMER: Traders Agency does not offer financial advice. The information provided is for educational purposes only and should not be considered financial advice. Traders Agency is not responsible for any financial losses or consequences resulting from the use of the information provided. Trading carries inherent risks and may not be suitable for all individuals. You are advised to conduct your own research and seek personalized advice before making any investment decisions, recognizing the potential risks and rewards involved.
- CNBC: Gold eases as robust U.S. payrolls boost rate-hike bets · accessed Sep 7, 2026
- The Business Times: Gold holds decline as traders weigh prospects for US Fed rate hike · accessed Sep 7, 2026
- Economy Middle East: Gold slips 0.44 percent to $4,406 as U.S. jobs lift Fed hike bets ahead of inflation reports · accessed Sep 7, 2026
See more from Traders Agency on Google
Make us a preferred source and our market analysis will appear more prominently in your Google Search, Top Stories, and AI results.
Add to Preferred Sources