Brent crude near $96 is where oil traders are anchoring their attention this week. The global benchmark and its U.S. counterpart, WTI, have swung violently inside single sessions as renewed U.S.-Iran strikes reset the geopolitical risk premium in real time. For active traders, the question isn't just where prices are right now. It's whether this is the start of a sustained repricing or another fast fade.
What Happened to Oil Prices After the Latest Iran Strikes?
The latest session saw Brent and WTI swing between gains of as much as $2 a barrel and losses of $1 a barrel, with session highs the strongest since July 24. That whipsaw followed the session in which both benchmarks settled more than $4 a barrel higher.
On the move up, Brent rose $4.16, or 4.6%, to settle at $94.65 a barrel, while WTI rose $4.46, or 5.2%, to settle at $90.22. Those were the highest closes for Brent since July 24 and for WTI since July 23. CNBC described the latest exchange as the most substantial since July, with the conflict now in its seventh month.
The Number: Brent +4.6% to $94.65 and WTI +5.2% to $90.22 in a single session, the highest close for Brent since July 24 and for WTI since July 23.
Why Is Crude Reacting This Hard?
The move came as Iran's retaliation extended beyond a bilateral exchange. Iran attacked Jordan, Bahrain, and Kuwait, countries that host U.S. forces, which traders were pricing in real time.
The move also got a fundamental assist. U.S. crude stockpiles fell by 4.5 million barrels last week, the first decline since late July, while Cushing, Oklahoma holdings rose marginally to 22.5 million barrels. Refined products moved harder than crude itself: U.S. diesel futures hit a 52-month high after soaring roughly 51% over the past 10 weeks, and refinery runs climbed to their highest level in seven years, with Midwest utilization hitting an unprecedented 103.5% of capacity.
Brent and WTI Against the Rest of the Tape
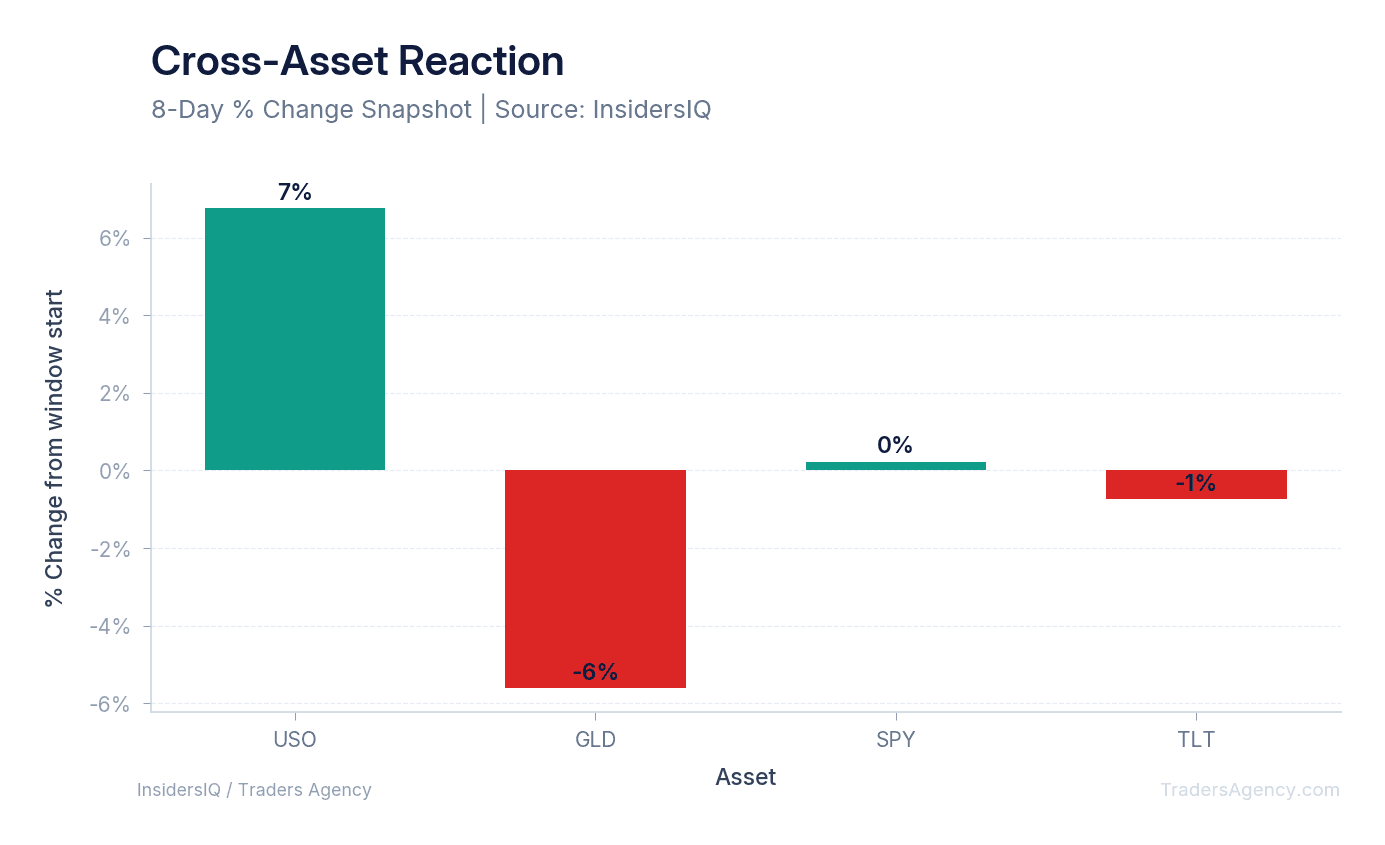
Our team is watching the USO crude ETF, up 6.76% over the past 10 days, as the cleanest tradable proxy for this move. Compare that to GLD, down 5.60% in the same window, SPY roughly flat at +0.22%, and TLT slipping 0.74%. Crude is doing almost all the work here, which tells us the risk premium is being expressed in energy rather than across the broader tape.
Want expert trading insights delivered daily?
Join thousands of traders who rely on Traders Agency for market analysis and trade ideas.
Join Traders AgencyThe Physical Flow Data Traders Are Actually Using
We don't have a reliable breakdown of Iran's specific oil-buyer mix, so we won't speculate on who takes the bulk of those barrels. What we can point to is the shipping data driving positioning right now: preliminary Kpler figures showed only four commodity vessels transited the Strait of Hormuz on Wednesday, well below the 10-day average of around 13.
That contrasts sharply with the official framing. Treasury and Energy officials said 17 million barrels of crude moved through the strait on Monday, calling it the largest volume since the war began, with flows averaging about 8 million barrels a day.
The Divergence to Watch: Kpler counted four commodity vessels through Hormuz Wednesday versus a 10-day average near 13, while U.S. officials cited 17 million barrels moving through the strait on Monday. Those two readings frame the disruption debate traders are positioning around.
Can This Rally Hold?
That remains uncertain, and the market itself is signaling doubt. Oil prices retreated on tentative signs the flare-up was easing, with no confirmed exchange of fire since around midday Wednesday, Sydney time, according to an IG analyst.
President Trump said the campaign wouldn't continue for "too long," while adding the U.S. is "prepared to do another one any time we want." A BOK Financial strategist noted both sides appear to be looking for off-ramps, warning that "more peace talks could deflate prices quickly."
Two Escalation Paths From Here
- Hormuz disruption escalation: vessel transits keep falling toward that four-ship reading, which could sustain a risk premium in crude regardless of official volume claims.
- Short campaign de-escalation: strikes stay capped as Trump suggested, talks progress, and the rally behind Tuesday's $4-plus settle fades quickly.
Crude is already almost 60% higher this year and around 30% higher than when the war began in late February, so either path starts from an elevated base. That matters for sizing: a de-escalation unwind has plenty of room to run lower before it hits anything resembling pre-conflict pricing.
Trading Implications
Headlines from the U.S.-Iran exchange are likely to keep volatility elevated no matter which path wins out. We're watching diesel strength as the signal that refiners see durable tightness even if crude itself chops sideways. A 51% move in 10 weeks and a 52-month high in distillate futures is not a headline trade, it's a physical tightness trade.
Any blockade or partial-closure scenario tied to Hormuz transit data is a key swing factor for Brent near $96 in the sessions ahead.
The Bottom Line
Brent near $96 and WTI near $92 reflect a market pricing real conflict risk, not just headline noise. Our team is tracking Hormuz vessel transit counts and any confirmed cessation of fire as the two cleanest signals for whether this rally holds or fades the way Tuesday's spike partially did. Until one of those paths confirms, we're treating both crude and diesel exposure as headline-driven and sizing accordingly.
Want expert trading insights delivered daily?
Join thousands of traders who rely on Traders Agency for market analysis and trade ideas.
Join Traders AgencyDISCLAIMER: Traders Agency does not offer financial advice. The information provided is for educational purposes only and should not be considered financial advice. Traders Agency is not responsible for any financial losses or consequences resulting from the use of the information provided. Trading carries inherent risks and may not be suitable for all individuals. You are advised to conduct your own research and seek personalized advice before making any investment decisions, recognizing the potential risks and rewards involved.
- CNBC: Oil edges down as investors weigh uncertainty over U.S.-Iran strikes · accessed Sep 3, 2026
- Reuters: Oil prices settle up more than $4 a barrel on renewed US-Iran fighting · accessed Sep 3, 2026
- The Irish Times: Oil steadies after rally as Trump sees short-lived Iran strikes · accessed Sep 3, 2026
- Business Today: Oil hits 5 week high as fresh US Iran tensions reignites Strait of Hormuz supply fears · accessed Sep 3, 2026
- Mint: Gold Holds Gain as Trump’s War Comments Ease Inflation Jitters · accessed Sep 3, 2026
See more from Traders Agency on Google
Make us a preferred source and our market analysis will appear more prominently in your Google Search, Top Stories, and AI results.
Add to Preferred Sources