Brent crude settled 4.6% higher at $94.65 a barrel on Tuesday and WTI climbed 5.2% to $90.22, its first close above $90 in more than a month, after the U.S. launched fresh strikes on Iranian Revolutionary Guard targets. Gold went the other way, sliding more than 2% as December futures opened at $4,377.20 per troy ounce before slipping to $4,357.50. That split between crude and gold is the story traders need to understand right now.
Both oil contracts posted their biggest single-day gains since late July. The Economic Times reported crude nearing $97 in early Wednesday trading as the situation kept developing. We've been watching how fast this kind of geopolitical premium can build, and Tuesday's move is one of the sharpest we've tracked this year.
This matters immediately because it isn't contained to energy. Stocks fell for a third straight session, Treasury yields moved higher, and gold, an asset that typically rises on geopolitical stress, dropped instead. That divergence is unusual enough that anyone trading commodities, equities, or rates should understand what's driving it before the next headline hits.
The Split: Brent +4.6% to $94.65, WTI +5.2% to $90.22, gold down more than 2% to $4,357.50. Oil and gold moving in opposite directions during a geopolitical escalation is the signal we're focused on.
What Triggered the U.S.-Iran Strikes?
U.S. Central Command said it began striking Iranian Revolutionary Guard targets inside Iran on Tuesday evening, in response to Iranian attacks on commercial shipping in the Strait of Hormuz and on U.S. forces in the region. Iran retaliated with strikes on U.S. military bases in the Middle East.
This was described as the second set of U.S. airstrikes in three days, which points to real reescalation rather than an isolated incident. Two supertankers were also attacked leaving the Strait of Hormuz in two separate incidents, carrying a combined total of about 4 million barrels of crude, according to maritime intelligence firms. Those attacks pushed traders to hunt for alternative crude shipments, which is a big part of why oil moved as fast as it did.
The Strait of Hormuz sits at the center of this. It normally carries about one-fifth of the world's oil, and current reporting says Iran has effectively closed it to commercial shipping. Any sustained disruption there is one of the largest single risks facing global energy markets, and traders are pricing that risk in real time.
Why Did Gold Fall as Oil Prices Surged?
Gold falling during a geopolitical escalation looks backwards at first glance, but one explanation offered is the rate channel: higher energy costs could raise the odds of a Fed rate increase later this month, and higher rate expectations cap gold's upside even as war risk builds.
Investors were pricing a 66% chance the Fed raises its benchmark rate at the September meeting, based on CME FedWatch data. If fighting continues and energy costs climb further, that probability could grow, and that's the pressure weighing on gold even while oil spikes.
The scale of gold's move stands out on its own. Gold now sits 5.2% below where it traded a week ago, even though it remains up 6.7% over the past month and 25.6% over the past year. Prices opened at their lowest level in two weeks before falling further Wednesday morning.
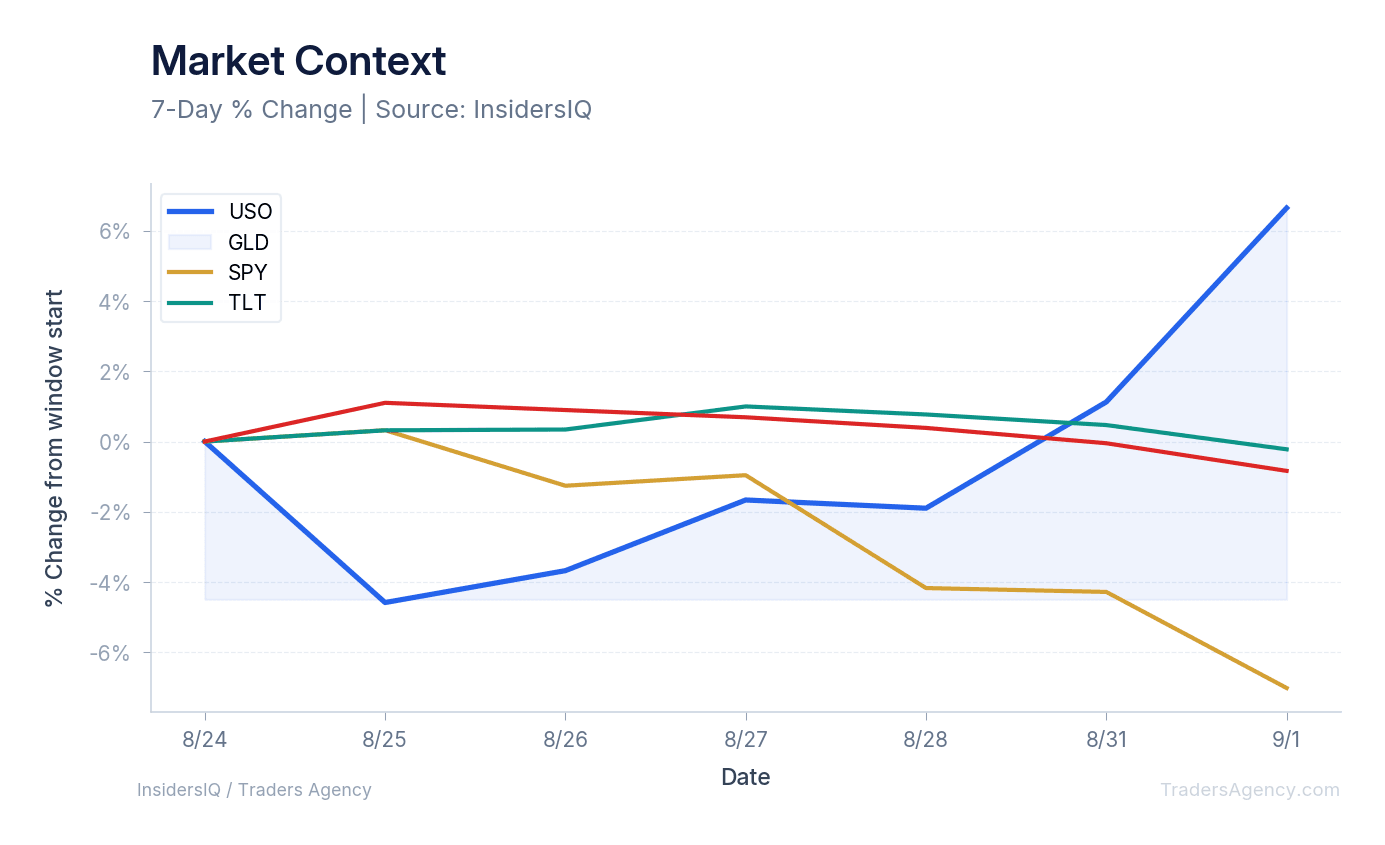
The chart above shows what we've been tracking over the past 10 trading days: USO up 6.65%, GLD down 7.02%, SPY down 0.22%, and TLT down 0.84%. That's a textbook risk-off split with a twist, where the usual safe-haven bid in gold appears to have been offset by rate expectations tied to the same energy shock lifting oil.
Which Traders and Sectors Are Most Exposed?
Our read is straightforward: energy-linked positions are benefiting, while broad equity exposure and gold-heavy portfolios are absorbing the pain. Three groups sit on opposite sides of this trade right now:
- Oil and energy-linked assets (Brent, WTI, USO) are capturing the upside from supply-disruption fears tied to the Strait of Hormuz.
- Equity indexes (S&P 500 down 0.7%, Dow down 0.8%, Nasdaq down 1%) are taking the downside, with a third straight day of losses reflecting broader risk aversion.
- Gold and rate-sensitive assets (GLD, TLT) are caught between safe-haven demand and rising Fed-hike odds, a conflict that currently appears to be tilting toward the rate story.
The 10-year Treasury yield rose to 4.79% from 4.75% late Monday, up sharply from as low as 4.20% at the start of 2026. That move in yields may be part of why gold isn't behaving like a typical safe haven during this escalation, and it's a level we're watching closely for signs of further tightening in financial conditions.
Want expert trading insights delivered daily?
Join thousands of traders who rely on Traders Agency for market analysis and trade ideas.
Join Traders AgencyWill Oil Reach $200 a Barrel?
Nothing in the current data supports a $200 scenario, and no analyst estimate we're tracking points anywhere close to that level. The bank forecasts on the table top out far lower, and even those carry conditions.
JPMorgan estimates each additional month of disruption could lift Brent by roughly $7 to $8 a barrel, and if disruption continues for three months, the bank expects average monthly Brent prices near $114. Goldman Sachs has warned Brent could reach $120 if Hormuz disruptions persist. Those are the upside scenarios currently in play, not $200, and both depend on continued escalation rather than a single event.
Goldman's base case still assumes de-escalation. The bank expects Brent to average $80 in the fourth quarter and $75 next year, while flagging that risks remain skewed to the upside if disruptions in the Strait of Hormuz and Red Sea run longer than expected. Any serious 2026 oil price discussion has to hold both scenarios at once: a low-$80s base case and a low-$100s to $120 disruption case, with the duration of the Hormuz closure as the deciding variable.
We'd also flag what we don't have. We don't have verified current pricing on who is buying Iranian crude or what oil costs inside Iran today, so we're not going to guess. Same goes for the historical question of when oil last traded at $140 a barrel. It's a real data point, but it isn't part of the reporting we're working from, and we'd rather leave a gap than fill it with a number we can't source.
Key Price Levels to Watch Next in Oil and Gold
For anyone tracking the Brent crude price today, the length of the Strait of Hormuz disruption is the single biggest variable for where Brent heads next. Analysts say a sustained recovery in shipping flows could unwind the geopolitical premium in crude and provide relief to emerging-market equities, while renewed disruptions could reverse that quickly.
Here's what's on our desk:
- Brent's $94.65 settle as the near-term reference point. A clean break above it on renewed escalation, or a fade below it on de-escalation headlines, tells us which scenario is playing out.
- WTI's $90 level, since Tuesday's close was the first above that mark in over a month.
- Gold near $4,357.50, after prices opened at their lowest level in two weeks, a zone that could attract dip buyers if Fed-hike odds ease.
- The 10-year Treasury yield around 4.79%, since further increases could keep pressuring gold even if oil stays elevated.
- Tanker traffic through Hormuz, since the two supertanker attacks carrying about 4 million barrels combined are the kind of concrete supply event that can turn headline risk into a physical shortage story.
What Is Still Unconfirmed About the U.S.-Iran Strikes?
There's genuine uncertainty in this story that traders should hold onto rather than smooth over. The duration of the Strait of Hormuz closure isn't fixed, and reporting describes Iran as having "effectively closed" the strait to commercial shipping rather than confirming a permanent blockade.
The bank price targets, $114 from JPMorgan and $120 from Goldman, are conditional forecasts tied to continued disruption, not guaranteed outcomes. A Fed rate increase this month remains a meaningful possibility given the 66% odds priced into futures markets, but it is not a certainty, and any shift in that probability would likely move gold again.
The Bottom Line
Tuesday's move was real and sizable: Brent up 4.6% to $94.65, WTI up 5.2% to $90.22, gold down more than 2%, and equities lower for a third straight day. We're treating the Strait of Hormuz disruption as the key variable, since its duration may determine whether crude holds these gains, drifts toward the $114 to $120 range banks have floated, or fades back toward Goldman's $80 base case. We're watching tanker traffic, Fed rate-hike odds, and the 10-year yield together, because this is one of those setups where oil, gold, and rates are each telling a different piece of the same story.
Want expert trading insights delivered daily?
Join thousands of traders who rely on Traders Agency for market analysis and trade ideas.
Join Traders AgencyKey Takeaways
- Brent settled 4.6% higher at $94.65 a barrel and WTI rose 5.2% to $90.22, its first close above $90 in more than a month, both the biggest single-day gains since late July.
- Gold moved the opposite direction, opening at $4,377.20 per troy ounce and slipping more than 2% to $4,357.50, even as geopolitical tension typically supports gold prices.
- Stocks fell for a third straight session and Treasury yields moved higher alongside the oil rally, showing the move spread beyond energy markets.
- Futures markets are pricing 66% odds of a Fed rate increase this month, a meaningful but not certain probability that could shift gold prices again if it changes.
- Crude's next move is tied to how long Strait of Hormuz disruptions last, with outcomes ranging from banks' floated $114 to $120 range to Goldman's $80 base case.
DISCLAIMER: Traders Agency does not offer financial advice. The information provided is for educational purposes only and should not be considered financial advice. Traders Agency is not responsible for any financial losses or consequences resulting from the use of the information provided. Trading carries inherent risks and may not be suitable for all individuals. You are advised to conduct your own research and seek personalized advice before making any investment decisions, recognizing the potential risks and rewards involved.
- Yahoo Finance: Gold price today, Wednesday, September 2, 2026: Gold slips further as military actions escalate in Iran · accessed Sep 2, 2026
- The Economic Times: Oil Price Today (September 2): Crude oil nears $97 as war tensions escalate. Will it hit $100 again? · accessed Sep 2, 2026
- AP News: Bond sell-off continues on Wall Street, pushing borrowing costs higher · accessed Sep 2, 2026
- Roya News: Oil jumps 4%, gold falls by more than 2% · accessed Sep 2, 2026
- WordUp News: Oil Price Today (September 2): Crude oil nears $97 as war tensions escalate. Will it hit $100 again? · accessed Sep 2, 2026
See more from Traders Agency on Google
Make us a preferred source and our market analysis will appear more prominently in your Google Search, Top Stories, and AI results.
Add to Preferred Sources