
Understanding the difference between a gold miners ETF vs physical gold is a foundational skill for commodities traders. Physical gold is a raw commodity that tracks the spot price of the metal, while a gold miners ETF is an equity fund holding shares of the companies that extract that metal. Choosing the wrong vehicle can severely limit your upside or expose you to unexpected stock market volatility. We'll walk you through the mechanics of these assets, explain the concept of operational leverage, and show you exactly when to hold physical bullion and when to trade mining equities.
You've probably seen this happen in the markets. You watch the price of gold break out to new highs, so you buy a physical gold trust. A week later, gold is up 2%, but you notice certain mining stocks are up 8%. You wonder if you bought the wrong asset. Our team sees traders struggle with this exact scenario every day.
What Is the GDX Gold Miners ETF?
Bottom Line: Physical gold tracks the spot price of the metal with no company-specific risk attached, while gold miners ETFs like GDX and GDXJ offer amplified exposure through operational leverage, at the cost of equity-side risks including labor disputes, tax changes, and management decisions. The practical skill is knowing which vehicle fits the trade: bullion for direct metal exposure, miners when the goal is to capture outsized moves during a gold rally.
The GDX is an exchange-traded fund that tracks the performance of the largest publicly traded gold mining companies globally. Instead of holding physical metal, this fund provides exposure to senior miners, offering a convenient way to trade the equity side of the precious metals market.
For a complete GDX ETF overview, we look at its underlying structure. The fund aggregates dozens of major mining companies into a single ticker symbol. This provides instant diversification across different geographic regions and management teams.
What Are the Top Holdings in GDX?
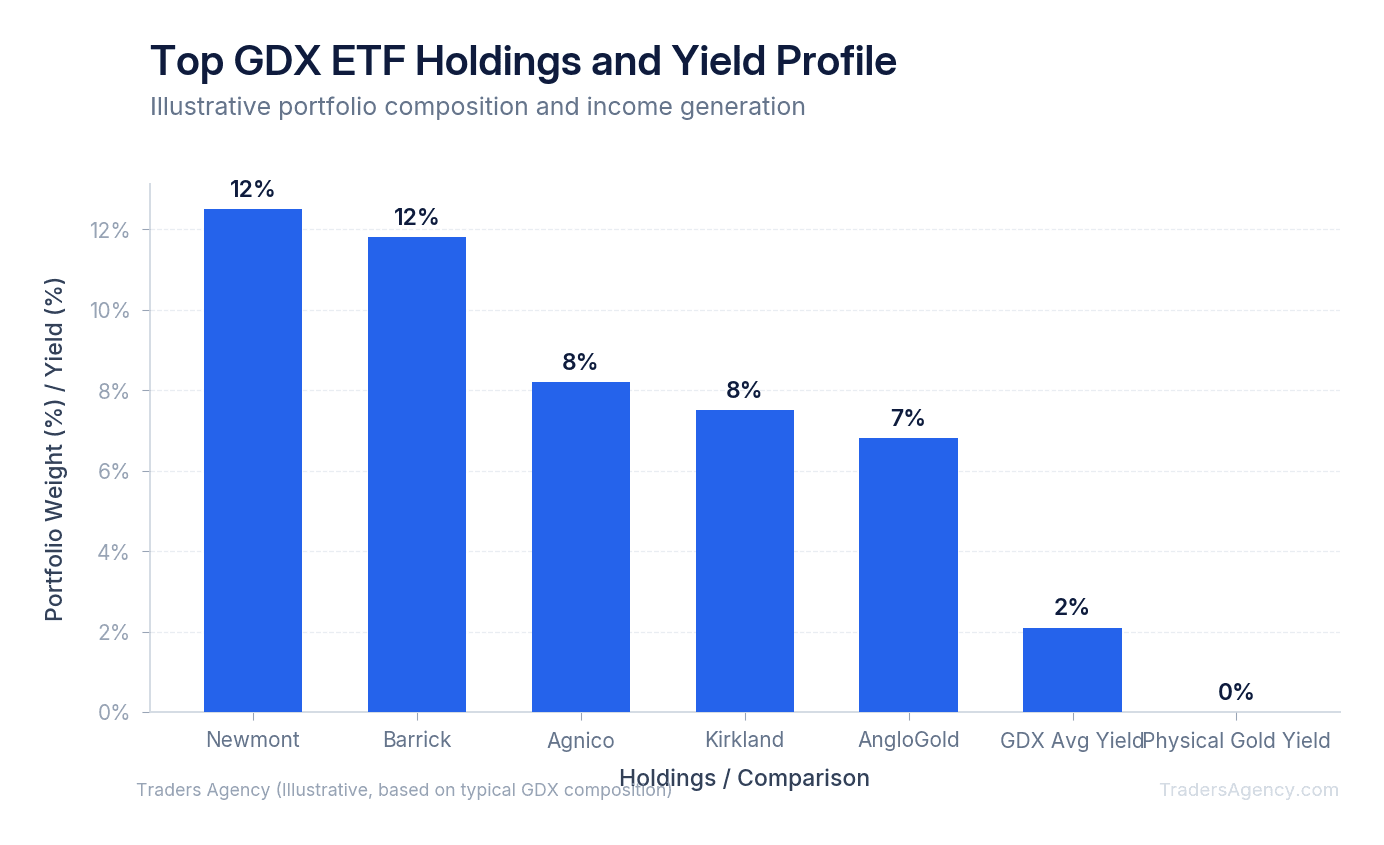
When you buy shares of GDX, you are buying a weighted basket of the most established precious metals producers in the world. The gold miners ETFs GDX holdings are heavily concentrated in the top tier of the industry.
Here is what we teach our members about the fund's composition:
- Newmont Corporation (NEM) typically represents the largest weight in the fund.
- Barrick Gold (GOLD) usually follows as the second-largest holding.
- Agnico Eagle Mines (AEM) rounds out the top three dominant positions.
- These top three companies often make up nearly 30% of the entire ETF weight.
Because the fund is top-heavy, the performance of Newmont and Barrick heavily dictates the overall direction of the ETF.
Does GDX Pay a Dividend?
Yes, the GDX pays a dividend to its shareholders. Unlike physical gold, which yields nothing and actually costs money to store, mining companies generate cash flow from their operations.
When you research the gold miners ETFs GDX dividend, you'll find it fluctuates based on the profitability of the underlying companies. During massive gold bull markets, these companies often increase their payouts. This dividend rewards you for holding the equity during long consolidation periods.
Key Concept: Physical gold generates zero income and costs money to store. Mining ETFs like GDX produce dividend income that fluctuates with the profitability of the underlying miners, giving equity holders a yield advantage during bull markets.
Why Do Gold Mining Stocks Move More Than the Gold Price?
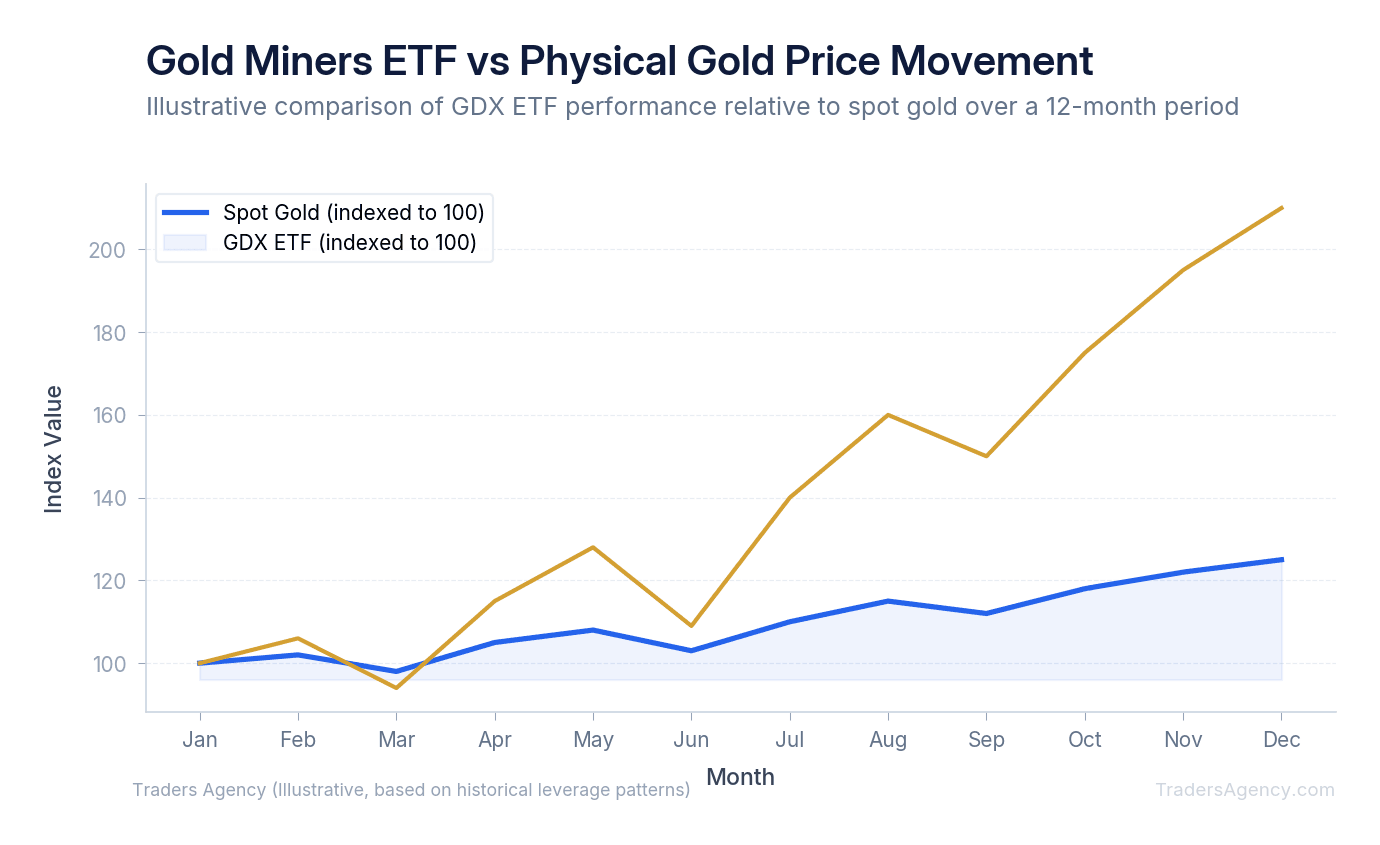
Gold miners act as a leveraged play on physical gold because their operating costs remain relatively fixed while their revenues scale directly with the spot price of gold. A small percentage increase in gold prices can result in a massive percentage increase in a miner's profit margins.
Think of this concept like owning a rental property with a fixed mortgage. If your mortgage is fixed at $1,000 and your rental income goes from $1,200 to $1,400, the rent only increased by about 17%. However, your actual profit doubled from $200 to $400.
Mining companies operate on the exact same mathematical principle. Their heavy machinery, labor, and land leases represent the fixed mortgage. The spot price of gold represents the rental income. This mathematical reality is why mining stocks can explode higher when the underlying commodity makes a modest move.
Operational Risks and All-In Sustaining Costs (AISC) Explained
To trade these assets properly, our team teaches members to track a metric called All-In Sustaining Costs (AISC). This number represents the total cost a company pays to pull one ounce of gold out of the ground and maintain its current operations.
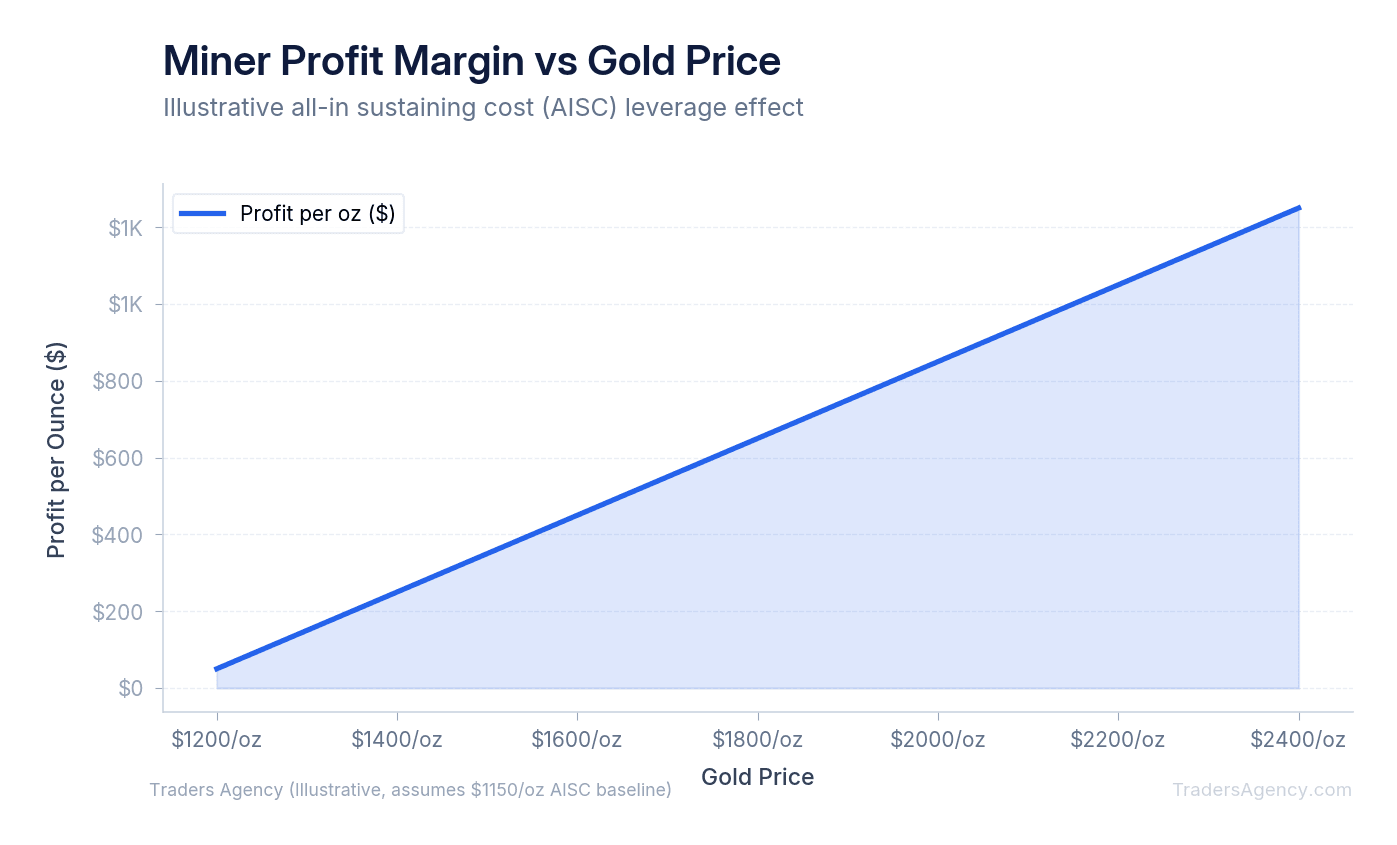
Let's look at a specific scenario with concrete numbers. Assume a mining company has an AISC of $1,500 per ounce.
| Gold Spot Price | Profit Per Ounce | % Change in Gold | % Change in Profit |
|---|---|---|---|
| $1,600 | $100 | Baseline | Baseline |
| $1,800 | $300 | +12.5% | +200% |
| $1,400 | -$100 (loss) | -12.5% | -200% |
The commodity moved 12.5%, but the company's profit tripled. This explains why the gold miners ETFs GDX price can swing violently on small commodity price changes. However, this amplification works in reverse as well. If gold drops to $1,400, the miner loses $100 on every ounce produced, and the stock price will collapse.
Watch Out: Operational leverage cuts both ways. A 12.5% drop in gold prices can wipe out 100% or more of a miner's profit margin. Always know the AISC of the companies inside your mining ETF before sizing your position.
Want expert trading insights delivered daily?
Join thousands of traders who rely on Traders Agency for market analysis and trade ideas.
Join Traders AgencyWhat Is the Difference Between GDX and GDXJ?
When searching for the best gold miners ETFs, GDX is usually the starting point for most traders. However, we also actively trade the GDXJ, which tracks junior gold miners.
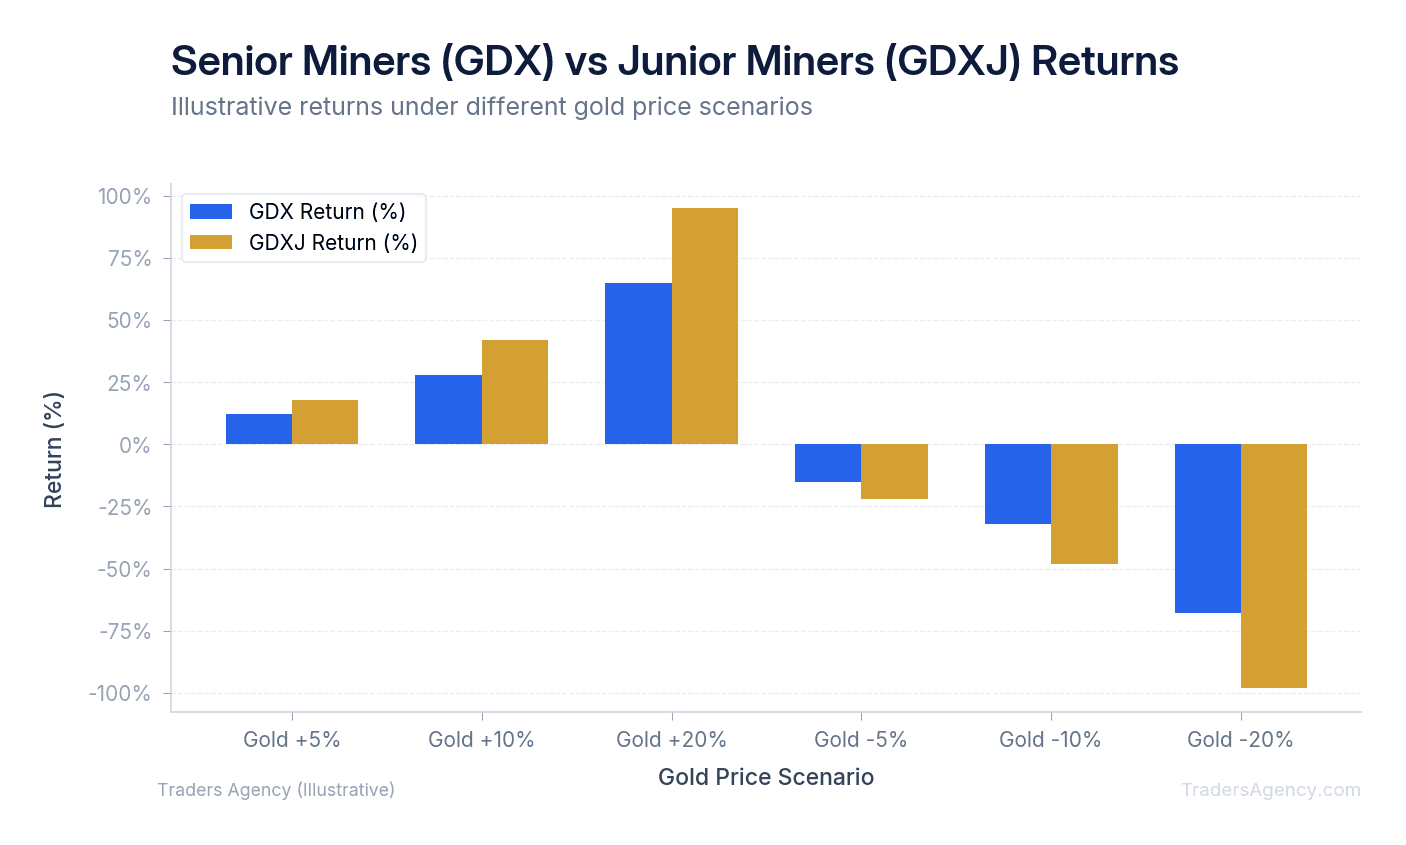
Senior miners in the GDX are established companies with active, producing mines and highly predictable cash flows. They have proven reserves and global operations.
Junior miners in the GDXJ are smaller exploration or early-stage development companies. Many of these companies are not even pulling gold out of the ground yet. They are simply drilling holes and hoping to find a viable deposit.
Junior miners carry significantly higher risk than senior miners. If a junior miner strikes gold, their stock can multiply rapidly. If their exploration fails, the stock can go to zero. We prefer to use GDX for our core mining exposure and reserve GDXJ for highly speculative, short-term momentum trades.
How Does GDX Perform Compared to Gold?
GDX generally exhibits two to three times the volatility of physical gold. During precious metals bull markets, GDX typically outperforms physical bullion by a wide margin. During bear markets or periods of rising operational costs, GDX will underperform physical gold and suffer steeper drawdowns.
Understanding GDX ETF performance requires looking at specific trade setups. Let's walk through a concrete example of how we trade this relationship.
Step-by-Step Trade Execution
- Identify the Setup: You spot a technical breakout in the spot price of gold above a major resistance level at $2,000 per ounce. You want to allocate capital to this thesis.
- Assess the Cost Environment: Check macroeconomic data for energy costs and labor costs. If costs are stable, mining profit margins will expand rapidly as gold rises. If energy costs are spiking alongside gold, miners' profit margins get squeezed by inflation.
- Choose Your Vehicle: With stable costs, we prefer to buy GDX for the amplified upside. With rising costs, we buy physical gold (like GLD) to avoid operational risk entirely.
- Capture the Move: Gold rallies 10% to $2,200 per ounce. Because of the fixed AISC we discussed earlier, the mining ETF rallies 25%. You capture the amplified move.
Options Strategy: GDX Bull Call Spread
For our intermediate traders, we often use options on GDX to define our risk while capturing upside. Here is a specific setup we teach our members.
Assume GDX is trading at $30.00. You expect a breakout but want to strictly limit your capital exposure. We prefer to use a Bull Call Spread.
| Parameter | Value |
|---|---|
| Buy Call | $30 strike (At-the-money), premium paid: $1.20 |
| Sell Call | $33 strike (Out-of-the-money), premium received: $0.40 |
| Expiration | 45 days out |
| Net Debit | $0.80 (or $80 per contract) |
| Breakeven | $30.80 ($30 strike + $0.80 net debit) |
| Maximum Loss | $80 per contract (the net debit paid) |
| Maximum Gain | $220 per contract (if GDX closes at or above $33 at expiration) |
This strategy allows you to participate in a mining rally while risking less than $100 per contract. You get defined risk, defined reward, and exposure to the amplified moves that miners produce during gold breakouts.
When Should You Trade a Gold Miners ETF vs Physical Gold?
Understanding how to buy gold miners ETF shares is simple, as they trade just like standard stocks through any major brokerage account. Knowing exactly when to buy them requires deep market awareness.
Our team recommends using physical gold for wealth preservation and long-term portfolio defense. We use mining ETFs for aggressive capital appreciation during confirmed uptrends.
Strategic Allocation Criteria
Here is the exact criteria we use to choose between a gold miners ETF vs physical gold in our own accounts:
- Analyze the inflation type: If inflation is driven by rising energy and labor costs, miners will suffer severe margin compression. Buy physical gold in this environment.
- Check equity market sentiment: Miners are equities first and gold vehicles second. If the S&P 500 drops 5% in a single day, GDX will likely fall with it. Buy physical gold during stock market crashes.
- Identify breakout momentum: If gold is breaking out of a multi-year consolidation and broad equity markets are healthy, miners will attract massive speculative capital. Buy the mining ETF in this environment.
Risk Management and Position Sizing
Risk management is non-negotiable when trading mining stocks. Because mining ETFs are highly volatile, we size our GDX positions at half the size of our physical gold positions.
We also place strict stop losses below recent swing lows on the daily chart for all mining trades. We might hold physical gold as a long-term, stop-free hedge, but we never hold mining stocks without an exit plan.
Watch Out: Sector-specific equity ETFs carry concentrated operational risks that broad market funds do not. A mine collapse, a labor strike, or a sudden change in foreign tax laws can crush a mining stock overnight. Physical bullion carries none of these operational risks. The SEC's investor education resources highlight these concentrated sector risks as a key consideration for ETF investors.
By understanding the mechanics of AISC and operational leverage, you can confidently decide when to hold the physical metal and when to trade the miners. This distinction is what separates informed commodities traders from those who simply guess and hope for the best.
Want expert trading insights delivered daily?
Join thousands of traders who rely on Traders Agency for market analysis and trade ideas.
Join Traders AgencyKey Takeaways
- When gold rises 2%, mining stocks can move 8% or more in the same period, because miners carry operational leverage that amplifies the metal's price moves in both directions.
- All-In Sustaining Cost (AISC) is the key metric that determines how much profit a miner captures above the gold spot price. A miner with a $1,200 AISC earns far more per ounce at $2,000 gold than at $1,400 gold, which is why earnings can surge even on modest gold price gains.
- GDX holds senior, established mining companies, while GDXJ targets smaller junior miners. Junior miners carry higher growth potential but also higher risk from factors like financing constraints and early-stage operations.
- Physical gold carries no operational risk. A labor strike, foreign tax law change, or management failure cannot affect a gold bar, but any of these events can crush a mining stock overnight.
- Choosing between physical gold and a miners ETF is not a matter of one being better. It depends on whether you want direct commodity exposure or leveraged equity exposure to the gold price.
DISCLAIMER: Traders Agency does not offer financial advice. The information provided is for educational purposes only and should not be considered financial advice. Traders Agency is not responsible for any financial losses or consequences resulting from the use of the information provided. Trading carries inherent risks and may not be suitable for all individuals. You are advised to conduct your own research and seek personalized advice before making any investment decisions, recognizing the potential risks and rewards involved.
See more from Traders Agency on Google
Make us a preferred source and our market analysis will appear more prominently in your Google Search, Top Stories, and AI results.
Add to Preferred Sources



