Oil and equities are pulling in opposite directions right now, and that split is the trade worth understanding today. Renewed US-Iran military strikes pushed Brent crude above $97 a barrel intraday before it traded near $95.76, coincided with the US 10-year Treasury yield reaching levels last seen in January 2025, and left US stock index futures subdued early Wednesday, even as the major indexes later turned higher.
Brent climbed more than 5% to about $95 after US Central Command announced the attacks on social media, while Dow E-minis, S&P 500 E-minis, and Nasdaq 100 E-minis barely moved in early trade. That gap between a surging commodity and a stalling equity tape tells us the market is still working out how to price a conflict now in its seventh month.
We have been tracking the tape through the session, and the swings have been sharp enough to matter for anyone holding energy, rate-sensitive tech, or long-duration bonds. Here is our read on what is actually being repriced.
What Is Happening With Oil Prices and Stock Futures Today?
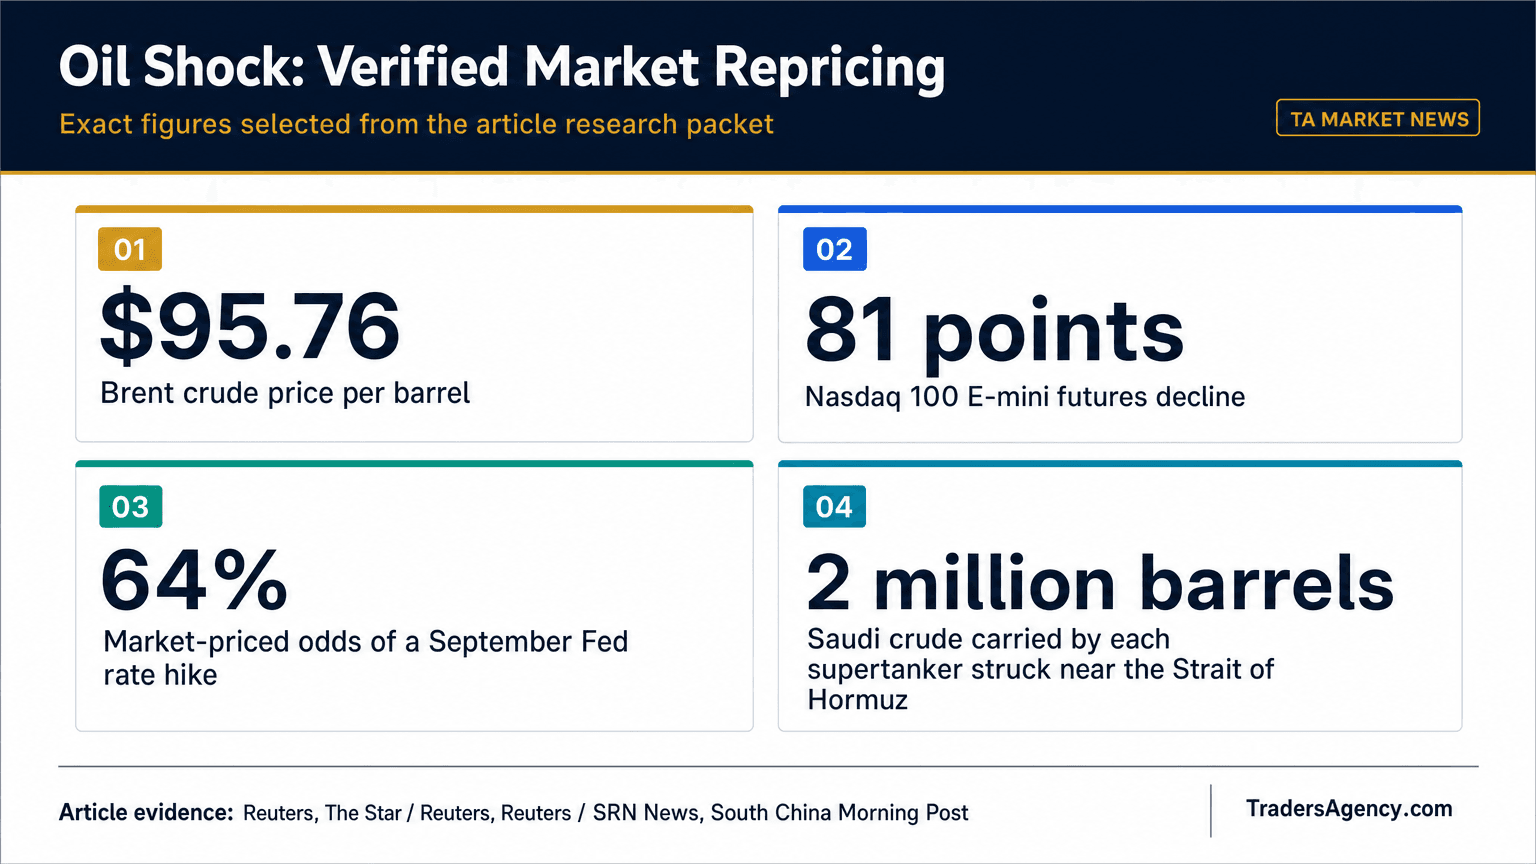
Brent crude futures rose $1.12, or 1.2%, to $95.76 a barrel by 1:06 p.m. ET Wednesday, while West Texas Intermediate climbed 92 cents to $91.18, Reuters reported. Intraday, Brent briefly cleared $97, its highest level since early June.
That move followed renewed US-Iran military strikes that restricted world oil supply. Both benchmarks swung between gains of as much as $2 a barrel and losses of $1 a barrel during the session, with session highs the strongest since July 24. That two-way volatility is a signal in itself: the market is not confident this is a one-way spike, but it is not dismissing the risk either.
The Number: Brent tagged $97 intraday before trading near $95.76 by early afternoon, with both benchmarks swinging between gains of as much as $2 a barrel and losses of $1 a barrel. Our read: supply risk, not demand, is driving the move.
Equity futures, by contrast, stayed pinned. At 4:25 a.m. ET, Dow E-minis were up just 7 points (0.01%), S&P 500 E-minis were down 6.25 points (0.08%), and Nasdaq 100 E-minis slipped 81 points (0.28%). Rising bond yields and rising crude gave buyers little reason to step in during what has historically been a weak month for returns.
How Are Treasury Yields Reacting to Iran Tensions?
Yields climbed alongside oil, with the US 10-year yield reaching levels not seen since January 2025. Japan's 10-year yield hit its highest level since August 1996, and Germany's benchmark yield rose to a 2011 high, per CNBC's reporting.
This is a global bond story, not a US-only story, and that distinction matters for positioning. Higher risk-free yields cut directly into equity appetite. CFRA Research chief investment strategist Sam Stovall noted that investors are "lightening their exposure to equities where they have substantial profits" as yields march higher. TLT, our proxy for long-duration Treasury performance, is down 0.84% over the past 10 days, a clean readout of that repricing.
The chart lays out the split. USO is up 6.65% over 10 days while SPY is down 0.22% and TLT is down 0.84%. QQQ, at +0.19%, has held up slightly better, but all four are moving against the same headline backdrop out of the Gulf.
What Does Brent Crude Topping $95 Mean for Energy Stocks?
A sustained Brent rally above $95 could add to inflationary pressure by raising costs for consumers and businesses, the channel analysts flagged in Wednesday's reporting. Our read is that the revenue backdrop for producers improves at the same time, which is why energy-sector positioning deserves attention this week.
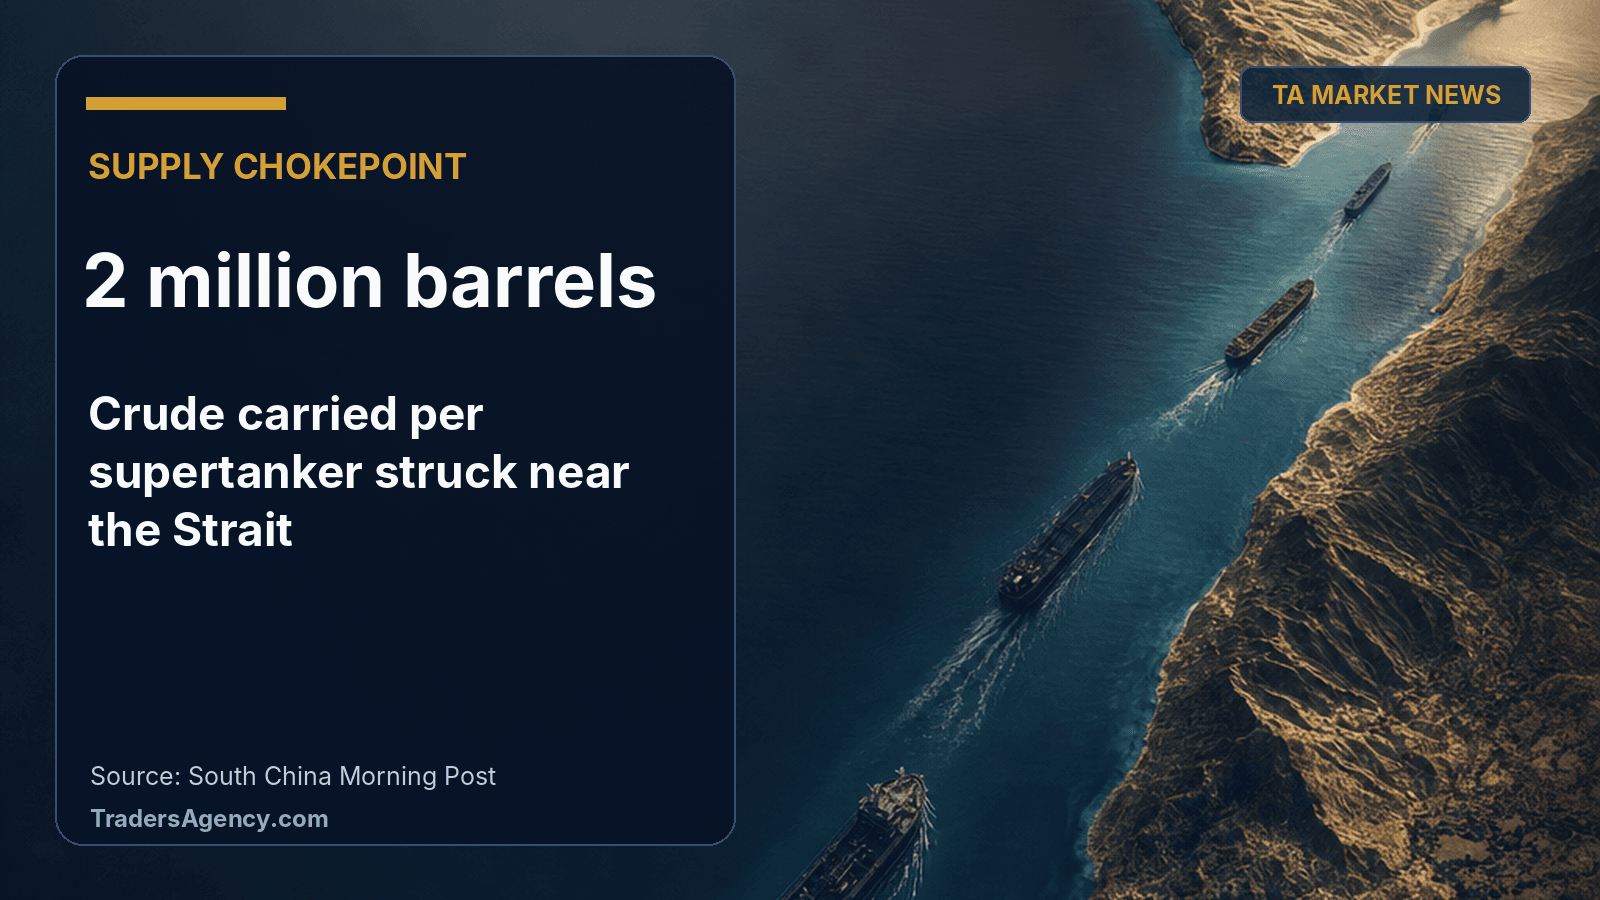
Shipping through the Strait of Hormuz is the specific supply risk driving the move. Iranian state broadcaster IRIB cited multiple explosions in the chokepoint, and two supertankers, each carrying 2 million barrels of Saudi crude, were struck by unknown projectiles as they sailed out of the strait. President Trump said on Truth Social he was "not trying to force Iran to the bargaining table," while asserting the US has "almost total control" over the Strait of Hormuz.
Our analysis of the price action suggests the market is treating this as a supply-disruption story first and a demand story second. That distinction matters: supply shocks tend to produce sharper, more volatile swings than demand-driven moves, which fits the $2 up, $1 down intraday range Reuters flagged.
Want expert trading insights delivered daily?
Join thousands of traders who rely on Traders Agency for market analysis and trade ideas.
Join Traders AgencyWhich Sectors Face the Biggest Risk From the Iran Premium?
Rate-sensitive sectors and fuel-cost-exposed industries carry the most direct risk from a sustained Iran-driven oil premium. Higher yields compress valuation multiples on growth stocks, while elevated crude squeezes margins on fuel-intensive businesses.
Here is what we are watching, sector by sector:
- Rate-sensitive technology: QQQ has been resilient so far (+0.19% over 10 days), but strategists warn the Fed could face a bind if higher energy costs also slow growth, a scenario that could complicate the policy path for growth stocks broadly.
- Energy producers: USO's 6.65% 10-day gain reflects direct upside exposure to the Brent move, though the volatility cuts both ways given the session's $2 swings.
- Long-duration bonds: TLT's 0.84% decline over 10 days tracks the yield backdrop directly, and further Treasury weakness could extend that trend.
- Fuel-cost-exposed industrials and transports: not quantified in the data we have on hand, but the mechanical link between crude and input costs makes this group worth monitoring closely.
Traders have also sharply repriced Fed policy. Markets are now pricing a 64% chance of a September rate hike, up from about 37% a week earlier, based on the CME FedWatch tool. That shift followed Fed Chair Kevin Warsh's comments that taming price pressures is the central bank's chief focus. Analysts caution that the Fed could be squeezed if higher energy costs from the conflict also slow economic growth, a dynamic that would leave policymakers with fewer clean options. Another hike remains a meaningful possibility rather than a settled outcome.
The Repricing: September rate-hike odds moved from roughly 37% to 64% in a single week. That is the clearest measure we have of how quickly markets are folding the oil-inflation link into the policy path.
What Are Oil Futures Looking Like Right Now?
Crude is trading in a volatile, headline-driven range, with Brent near $95.76 and WTI near $91.18 as of Wednesday afternoon, both still capable of $2 swings inside a single session. That volatility is the operative fact for anyone checking quotes before sizing a position.
The US-Iran conflict is now in its seventh month, and the recent attacks were described as the biggest exchange of fire between Tehran and Washington since July. US forces struck Iran's southern coast along with air defense and radar targets; Tehran retaliated against US bases across the Gulf. Every fresh headline out of that theater can move oil and equities together or apart, depending on whether the tape reads it as escalation or de-escalation.
What Should Traders Watch Right Now?
Key levels and events for the days ahead
- Brent crude: whether it holds above $95 or retests the $97 intraday high from Wednesday's session.
- WTI crude: currently near $91.18, worth tracking against the July 24 session-high benchmark Reuters referenced.
- US 10-year Treasury yield: at levels not seen since January 2025. A further climb would tighten the screws on equity valuations.
- CME FedWatch probability: September hike odds jumped from 37% to 64% in a week. Any further move here signals how markets are digesting the oil-inflation link.
- Major indexes: despite the subdued futures open, the Dow, S&P 500, and Nasdaq Composite were set to snap a three-day losing streak Wednesday, with the Dow up 287.55 points (0.55%) to 53,056.06, the S&P 500 up 44.35 points (0.58%) to 7,675.82, and the Nasdaq Composite up 135.73 points (0.52%) to 26,235.50 at midday.
That midday reversal, where investors "cautiously dipped back into equities despite renewed clashes in the Middle East," per Reuters, is a detail worth sitting with. It suggests some traders are treating the geopolitical risk as tradable rather than a reason to fully de-risk, at least for now.
The Bottom Line
Oil and equities are telling two different stories. Crude appears to be pricing supply risk out of the Strait of Hormuz, while stocks are caught between that risk, climbing global yields, and a Fed rate-hike probability that moved from 37% to 64% in a week. We are watching Brent's ability to hold above $95, the 10-year yield's push into territory last seen in January 2025, and whether Wednesday's midday equity rebound can extend into something durable or gets overrun by the next headline out of the Gulf.
We are not issuing price targets here. What we can say is that the oil, yield and equity moves described above are documented in Wednesday's reporting, and they are worth checking daily until the conflict shows signs of stabilizing.
Want expert trading insights delivered daily?
Join thousands of traders who rely on Traders Agency for market analysis and trade ideas.
Join Traders AgencyDISCLAIMER: Traders Agency does not offer financial advice. The information provided is for educational purposes only and should not be considered financial advice. Traders Agency is not responsible for any financial losses or consequences resulting from the use of the information provided. Trading carries inherent risks and may not be suitable for all individuals. You are advised to conduct your own research and seek personalized advice before making any investment decisions, recognizing the potential risks and rewards involved.
- Reuters: Oil rises 1%, as US-Iran strikes risk limiting already impaired supplies | Reuters · accessed Sep 2, 2026
- CNBC: CNBC Daily Open: Markets trapped in Iran doom loop · accessed Sep 2, 2026
- The Star / Reuters: US stock index futures subdued as oil, Treasury yields rise on Iran tensions · accessed Sep 2, 2026
- Reuters / SRN News: Wall St set to snap three-day streak of losses despite Middle East clashes · accessed Sep 2, 2026
- South China Morning Post: As oil tops US$97, US-Iran war escalation has markets bracing for supply risks · accessed Sep 2, 2026
- The Asia Business Daily: [NYSE] US Resumes Airstrikes on Iran... Oil and Bond Spike Sends Nasdaq Down 1% · accessed Sep 2, 2026
- EBC Financial Group: Brent Tops $95. Is Oil Now Raising the Risk of a Fed Hike? · accessed Sep 2, 2026
See more from Traders Agency on Google
Make us a preferred source and our market analysis will appear more prominently in your Google Search, Top Stories, and AI results.
Add to Preferred Sources