
Crude jumped and Treasury yields eased in the same session, and that split is the most important thing traders need to understand about the next 48 hours. Brent was quoted at $95.2 a barrel and WTI at $90.77 early Thursday, slightly lower on the day even after intraday highs pushed toward $97 and $92, the strongest levels for both benchmarks since July 24. Meanwhile the 10-year Treasury yield slipped more than 2 basis points to 4.7680%, backing off a multi-year high set just a day earlier.
Why did oil prices jump and Treasury yields pull back after the Kuwait strike?
Here's what we know. Kuwait's army said Thursday it intercepted a missile and drone attack from Iran, and Iran's army said it struck the Ahmad al-Jaber Air Base in Kuwait, with Iranian state media saying the target was U.S. bases there. Tehran also claimed strikes on U.S. bases and forces in the UAE, Bahrain, Jordan, and Iraq's Kurdistan region this week. The UAE reported no attack on Al Minhad Air Base, a useful reminder that claimed strikes and confirmed strikes are not the same thing.
That backdrop pushed oil into a genuinely volatile stretch. Brent and WTI swung between gains of as much as $2 a barrel and losses of $1 a barrel in the prior session, and our tracking data shows USO up 6.76% over the last 10 trading days, capturing that crude repricing in real time.
The Number: Brent at $95.2 and WTI at $90.77 after intraday prints near $97 and $92, the highest for both benchmarks since July 24, while the 10-year yield eased to 4.7680%.
Why Did Treasury Yields Move Lower?
Yields didn't rise Thursday, they eased, but the question still matters because Thursday's pullback only makes sense against Wednesday's spike. The 10-year touched a multi-year high in that session as inflation and debt concerns weighed on the bond market. What we're seeing now looks like a retracement, not a reversal of that broader sell-off.
Two scheduled data points are the next real test. The ISM services PMI, due Thursday, is expected at 54.3, up slightly from July's 54.1. Friday's nonfarm payrolls report is forecast to show a gain of 58,000 jobs with unemployment holding at 4.1%. Either print could reignite the same inflation and debt worries that drove yields to their recent high, which is why we read the current dip as a pause rather than an all-clear.
How Are Oil Prices and Treasury Yields Connected Right Now?
A supply shock and a bond rally can coexist when the market treats the geopolitical event as contained rather than a threat to growth. That is the story behind oil prices after Kuwait strike headlines this week: crude is holding a Gulf supply-risk premium while yields ease as traders look ahead to the services and jobs data. The two forces aren't pulling in the same direction, and traders who conflate them risk misreading both.
Cross-asset behavior supports that reading. Gold is bid alongside softer yields and a weaker dollar, consistent with a standard safe-haven trade, while copper's indifference suggests the market isn't pricing a demand shock. Our own numbers echo the split: GLD is down 5.60% over 10 days even with the safe-haven bid embedded in the latest session, while TLT is down 0.74%, reflecting the sharp sell-off in global bond markets that preceded Thursday's session.
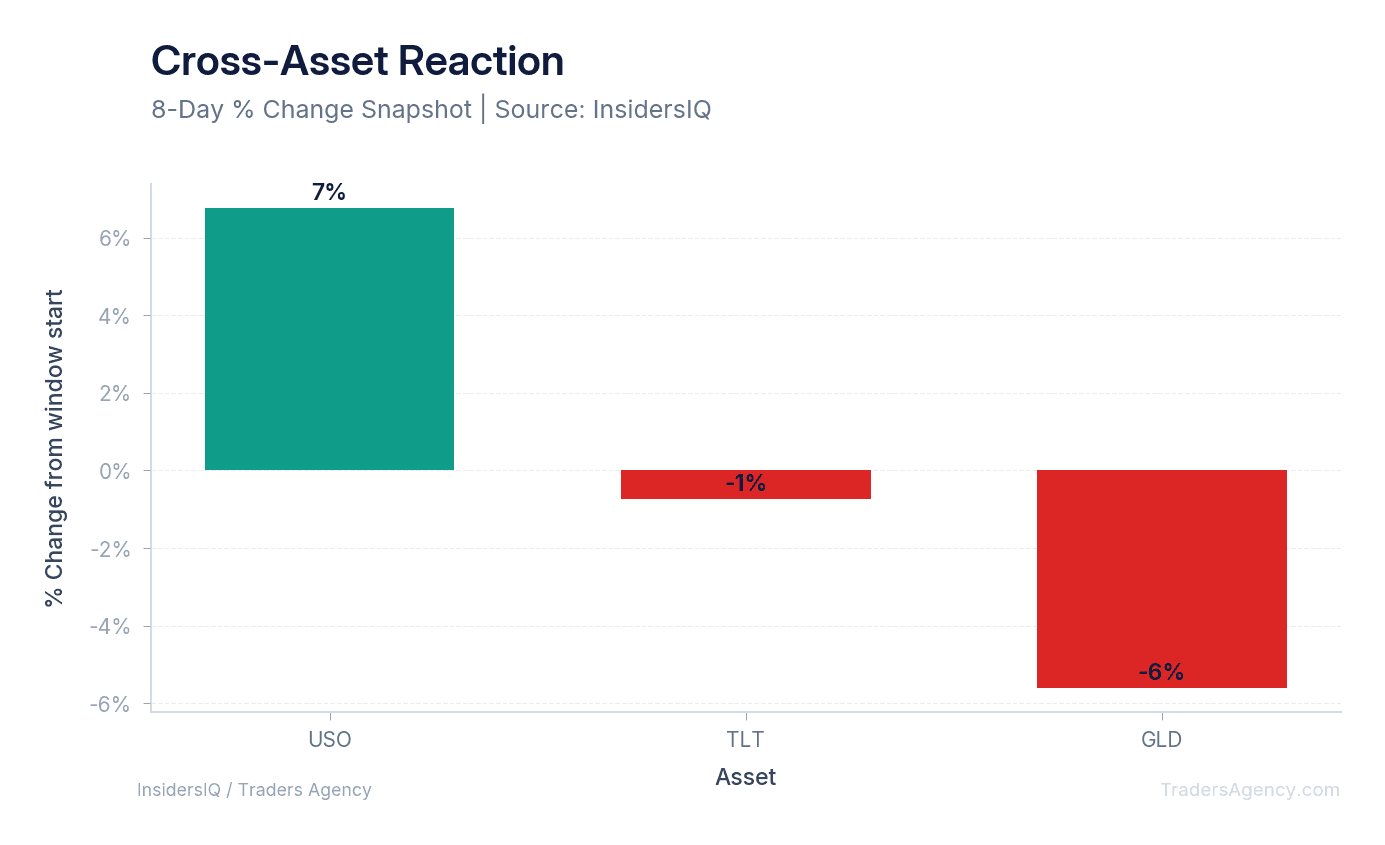
Pull up any oil versus rates chart this week and the story is the same: crude's move is sharper and faster than anything happening in rates. To us, that says the strike is being priced as a regional flashpoint, not yet a systemic one.
Want expert trading insights delivered daily?
Join thousands of traders who rely on Traders Agency for market analysis and trade ideas.
Join Traders AgencyWhat Could Break the Oil-Treasury Standoff?
The tell isn't the base strikes themselves. It's whether escalation reaches export facilities, tanker traffic, or the Strait of Hormuz. Preliminary Kpler shipping data showed just four commodity vessels transiting the strait, well below the 10-day average of roughly 13, even after the U.S. said 17 million barrels of crude moved through the waterway on Monday, the largest volume since the war began. That gap between falling vessel counts and a record flow day earlier in the week is exactly the kind of divergence that can flip sentiment fast.
Watch This: Hormuz transits dropped to four vessels against a 10-day average near 13, just days after a reported 17 million barrels moved through in a single session.
President Trump said the renewed campaign wouldn't continue "too long," while also noting U.S. forces were "prepared to do another one any time we want." That two-sided signal is a fair summary of the risk. Contained exchanges have tended to get faded once the tit-for-tat cycle pauses, but freight and insurance rates in Gulf shipping lanes have historically moved ahead of flat price when disruption risk is genuinely building.
What should traders watch into Thursday and Friday?
- ISM services PMI (Thursday), forecast 54.3: a beat could revive the inflation-driven leg of the bond sell-off.
- August nonfarm payrolls (Friday), forecast 58,000 jobs, unemployment 4.1%: a weak print could pull yields lower again and take some pressure off oil's safe-haven bid.
- Strait of Hormuz vessel counts: any further drop from the roughly 13-vessel 10-day average would be the clearest sign the standoff is escalating beyond base strikes.
- Gulf shipping freight and insurance rates: these tend to move before flat price when real disruption risk is rising.
- Official Washington attribution and Iranian retaliation rhetoric: the next verbal escalation or de-escalation could move both oil and yields before any data print does.
On the "will oil hit $200 a barrel" question circulating in search right now, nothing in the current data supports that kind of move. Confirmed levels sit near $95 for Brent and under $91 for WTI, nowhere close to the territory implied by that headline number, and we're not aware of confirmed pricing anywhere near the $140-a-barrel levels traders sometimes reference from past cycles.
The Bottom Line
Our take: this remains a two-way setup. Oil is being driven by supply-side headline risk out of Kuwait and the Gulf, while Treasury yields are digesting a separate inflation and debt story that predates Thursday's strike on Kuwait. We're watching Thursday's ISM print and Friday's payrolls data as the next real tests, alongside Hormuz vessel flows, since any of them could unwind the current calm in yields or extend the crude bid. Nothing in the confirmed data points to a runaway move in either direction yet, but the risk is real enough that we're not treating this as settled.
Want expert trading insights delivered daily?
Join thousands of traders who rely on Traders Agency for market analysis and trade ideas.
Join Traders AgencyDISCLAIMER: Traders Agency does not offer financial advice. The information provided is for educational purposes only and should not be considered financial advice. Traders Agency is not responsible for any financial losses or consequences resulting from the use of the information provided. Trading carries inherent risks and may not be suitable for all individuals. You are advised to conduct your own research and seek personalized advice before making any investment decisions, recognizing the potential risks and rewards involved.
- CNBC: Treasury yields move lower as traders await data after bond sell-off · accessed Sep 3, 2026
- France 24 / AFP: Iran attacks US targets despite Trump threats · accessed Sep 3, 2026
- Newsquawk: [MARKET ANALYSIS] Oil prices remain afloat after marginally gaining yesterday in choppy trade amid somewhat mixed comments from Trump, while reports note the US base in Kuwait was hit in a strike | Newsquawk · accessed Sep 3, 2026
- CNBC: Oil edges down as investors weigh uncertainty over U.S.-Iran strikes · accessed Sep 3, 2026
- CNBC: Iran strikes Kuwait, Trump says renewed hostilities won't last 'too long' · accessed Sep 3, 2026
- CNBC: CNBC Daily Open: 'Trump Strait', losing streak snapped and bilateral diplomacy · accessed Sep 3, 2026
- CNBC: Brent oil near $96 following tit-for-tat strikes by U.S. and Iran · accessed Sep 3, 2026
- CNBC: Global bond rout gathers pace as inflation fears mount · accessed Sep 3, 2026
See more from Traders Agency on Google
Make us a preferred source and our market analysis will appear more prominently in your Google Search, Top Stories, and AI results.
Add to Preferred Sources