

Stocks give you a warning right before they explode higher. Once you know how to read it, you can buy in at the start of the move instead of chasing it after the fact. That warning is the foundation of my number one breakout trading strategy.
My breakout strategy is built around one repeatable pattern: a series of pullbacks that get shallower and shallower until the stock finally punches through resistance. This isn't guesswork. It's pattern recognition based on how big institutional money actually builds positions.
Most retail traders do the opposite of what works. They hold through choppy, directionless price action, watch a position go 20, 30, even 40 percent against them, and then finally get the move they wanted after they've already been shaken out.
This flips that. You wait for the setup to show itself, you get in near the bottom of the risk, and you ride the explosive part of the move.
I've used this pattern for years. On stocks, on gold, on crude oil. It works because it's rooted in something that never changes: supply and demand.
What Is a Breakout Trading Strategy?
Bottom Line: A breakout trading strategy works by spotting pullbacks that get shallower and shallower until a stock finally clears resistance on volume. Buying near the bottom of that risk, with a tight stop and a target far larger than the loss, turns the approach into a repeatable edge across stocks, gold, and crude oil.
A breakout trading strategy is a method of buying a stock, commodity, or other asset right as it pushes through a key resistance level after a period of tightening price action. The goal is to enter as the explosive move starts, not after it's already run 20 or 30 percent without you.
The pattern looks the same every time. First, a stock makes a strong move higher. That move attracts attention, because names that can run 20, 30, even 50 percent quickly are exactly what big institutions are buying. When institutions are buying, price goes up.
After that advance, whether it's 40 percent or 400 percent, you get what's known as pent-up supply. People who bought lower start taking profits because they're afraid of losing their gains. That selling pushes the stock down temporarily. If institutional demand is still there, they buy the dip and drive the stock back up.
Then the process repeats. Sometimes it's a downgrade. Sometimes a nasty article. Sometimes some clown on CNBC explaining why he's bearish. Sometimes it's straight-up manipulation, guys using spoofing orders during low-volume periods to run through stops.
But through all of it, the dips get smaller from left to right. That shallowing is the signal.
How Do You Spot a Breakout Before It Happens?
Measure every pullback and watch the numbers shrink
You identify a stock before it breaks out by measuring the size of each pullback in the consolidation. When each dip becomes noticeably smaller than the last, sellers are running out and the stock is getting harder to buy.
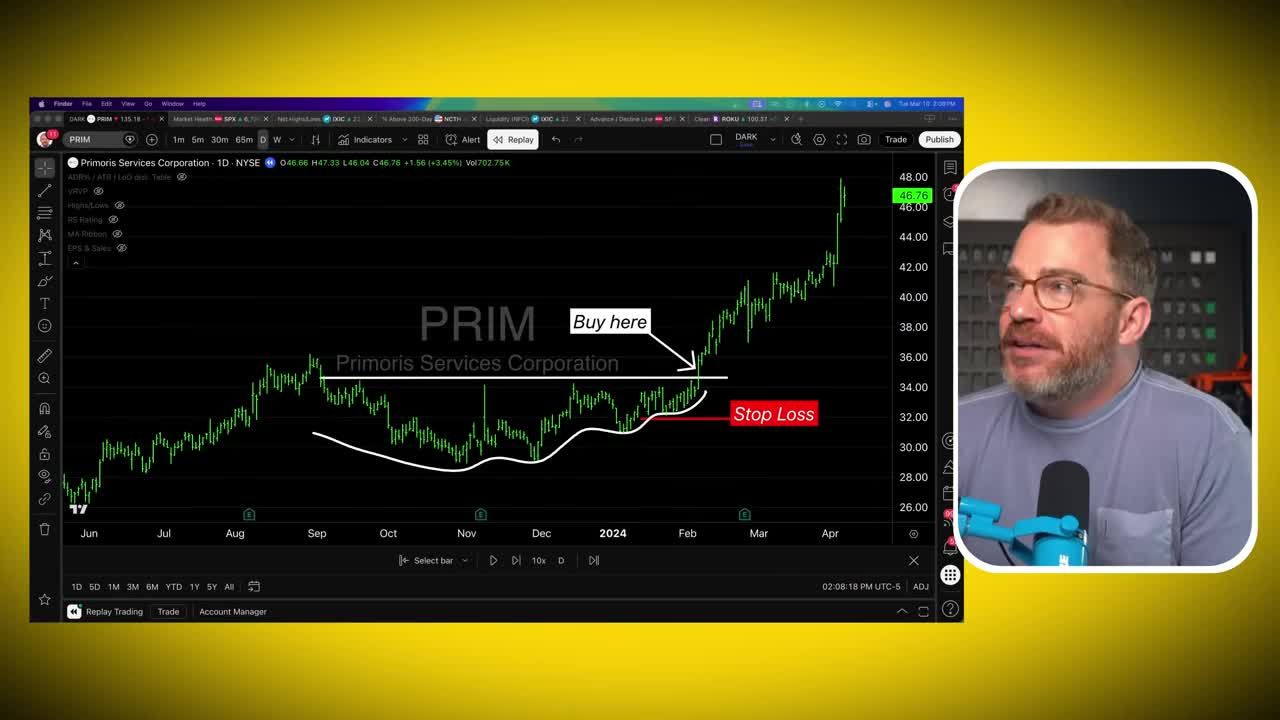
On the daily chart of Primoris, the measurements are clear.
That shrinking sequence is not random. It's a fingerprint of institutional buying.
Big money can't buy the way you and I do. If you want a thousand shares of a stock, you can get filled in half a second on E-Trade, Fidelity, or Schwab. Warren Buffett couldn't do that with Apple. When he built his position several years back, it took him two months, and Apple was one of the most liquid stocks on the planet. There simply weren't enough shares offered for sale to satisfy that kind of demand in one shot.
So institutions finesse their way in. They cause these dips, buy the retracements, and build their position in a meticulous, calculated manner.
Eventually there's no one left willing to sell at that price. The rest of the shares are sitting in someone's retirement account, in an ETF, in a mutual fund. Not every share is for sale. You own stock. Do you have all of it listed for sale? No. You're only chasing the float.
Once institutions have gobbled up as much of that float as they can, and once they've shaken, scared, or bored the rest of the sellers out, the only way to get more stock is to pay a higher price. That's what forces the breakout.
Think of it as a miniature economy. Ten dollars chasing ten widgets, each selling for about a dollar. Now those widgets get bought up until only two are left. The same ten dollars is chasing two widgets. More dollars chasing fewer shares means the price goes up substantially.
The Pattern Works Off the Lows Too
This isn't limited to stocks sitting at their highs.
The same shape played out on Rush Street Interactive (RSI), which had a huge run in 2020 and 2021 and then got absolutely murdered. Instead of forming off the highs, the shallowing showed up off the lows as the stock based out before turning around.
The principle is identical. Whether the pent-up supply comes from people wanting to sell because they're up a lot, or from people wanting to sell because they're sick of holding a stock that's been crushed, that supply has to get worked through before price can move again.
NuScale Power (SMR) gave the cleaner version. The nuclear space got hot because AI development was booming and there wasn't enough power to feed it. SMR made monstrous moves higher. Then the global tariff news hit and every growth name got hammered. A stock trading at $35 a couple of months earlier was suddenly worth a third of that.
What followed was the same consolidation off the lows. One final gust of selling. Then it shallowed, tightened, absorbed, compressed. When the stock blew through resistance on a candle that produced a 20 percent up day, that was the sign the supply had been worked through.
Buy Point and Stop Loss
Your buy point is the level where the stock finally clears the horizontal resistance that capped every prior rally attempt. Your stop goes just below the low of the final, smallest pullback, because that level shouldn't get revisited if the pattern is real.
On the Primoris setup, resistance sat around $35 and the buy trigger came at $35.25. Each successive dip in the pattern held higher than the one before it, so the low of that last retracement became the logical stop.
If you're new to this, a stop loss order tells your broker: if and when this stock falls to that price, sell it instantly. You're saying, I think this is going higher, but if I'm wrong and it drops back to that level, get me out.
That entry carried initial risk of about 7.5 percent. In two months, the stock surged 60 percent.
From there you manage it on the way up. Raise your stop. Trail it 15 to 20 percent below price, or use a reference like the 50-day moving average, and ride the thing higher until the trend eventually rolls over and takes you out.
How Much Should You Risk Per Trade?
Done properly, this breakout trading strategy should never require you to risk more than 10 or maybe 12 percent on any single stock. Ideally you're closer to 5 to 7 percent when the pattern is tight.
The shallowing structure is what keeps risk small. The stop sits just below the final tiny pullback, not far below the entire pattern.
That's where the math gets interesting. If you're risking a dollar to make three or four, you only have to be right 25 percent of the time to come out ahead over a large sample. Be right half the time and you make a bundle.
Small, defined downside. Forty, fifty, sixty percent moves on the upside once the breakout confirms.
This also isn't limited to stocks. It works arguably better on crypto and commodities like gold, silver, and crude oil, because those assets don't carry single-stock risk. There's no CEO of Bitcoin who steps down. There's no crude oil earnings report that comes in weak. They move purely on supply and demand, which makes the pattern smoother and easier to read.
Get an entire year of live weekly mentoring sessions, my newsletter, indicators, bonus reports, tons more. Click the link and I'll see you in the next live session.
Join my Black Ops Trading ClubVolume Separates Real Breaks From Fakes
The best defense against a false breakout is volume. In a real setup, volume mimics price: below average on the pullbacks, above average on the pushes higher.
As the pattern matures, look for pockets of very, very low trading volume near the end of the consolidation. That tells you the stock has become genuinely hard to buy, not just quiet.
NuScale was doing 12 or 13 million shares a day during the active phase of the move. By the time the range tightened, it was doing around 3 million. Price compressing while volume dried up. Then when the stock cleared resistance, volume spiked hard on the way out, confirming the move.
Write this part down: price compressing while volume dries up, followed by a volume surge on the actual break. Without that confirmation, a breakout is far more likely to fail and reverse.
Win Rate Matters Less Than You Think
The risk-to-reward ratio does the heavy lifting. Risking 5 to 7 percent to capture 40 to 60 percent moves means you can be wrong more often than you're right and still finish well ahead.
That's the math that separates a strategy from gambling. It's also why position sizing has to be deliberate instead of emotional. If you're risking 80 percent of a position's value on a breakout, that's no good. If you're risking two, that's phenomenal.
Focus on the Leading Groups
Not every stock deserves to have this pattern applied to it. I focus on stocks sitting in leading groups, because the same institutional buying that creates the shallowing is what drives entire sectors higher at once.
BlackRock, the Fidelity Magellan Fund, the big multi-billion dollar shops. They don't invest like you and I do. They're not yoloing into some penny stock. They take a macro approach.
Bullish on nuclear because AI development has hit a bottleneck the grid can't handle? They don't buy one name. They buy NuScale Power, GE Vernova, OKLO, plus the companies making the mounting brackets and designing the software. When lots and lots of dollars flow into one area, that area rises faster than everything else.
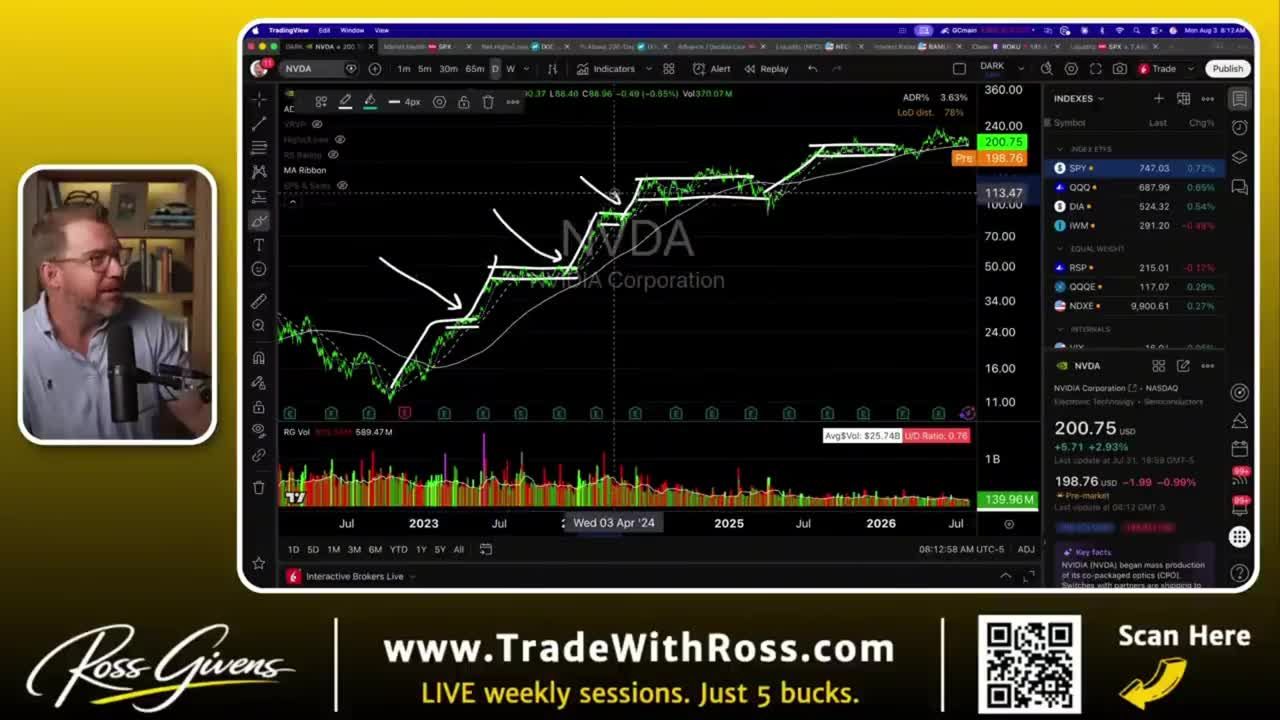
Leadership rotates. In 2023 and 2024 it was semiconductors, over and over, with NVIDIA leading the march. In March and April of 2025, off those lows, it was nuclear, which is exactly why I got my members into SMR.
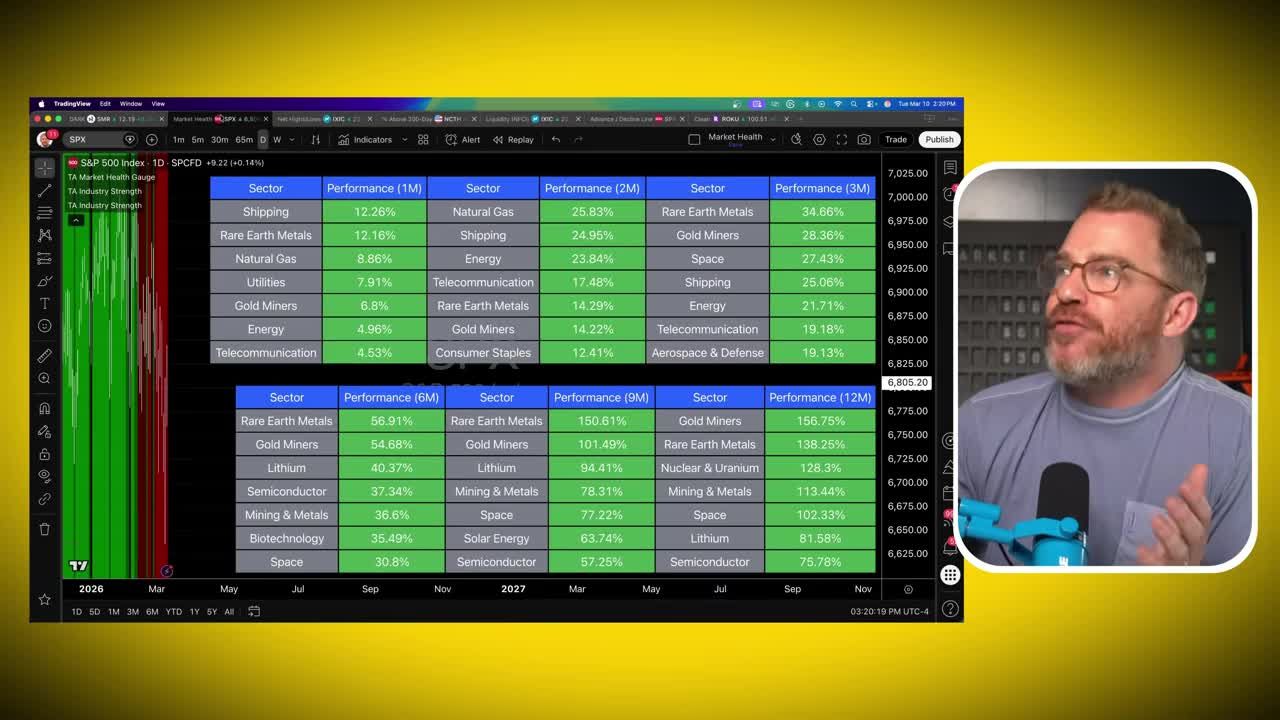
As of March 2026, rare earth metals have been a very strong performing group across three, six, nine, and twelve-month periods. Gold miners are doing well too, with gold itself up big.
Find the leading group first, then apply the pattern inside it. Now you know where the stocked pond is, and your odds increase dramatically. You're not just following supply and demand, you're doing it in the names that already have the wind at their back.
Gold: A Textbook Setup
The same pattern on daily, weekly, and monthly charts
Gold produced one of the cleanest examples of this I've seen, close to a perfect setup. The big breakout on the daily chart took place in March of 2024, after gold shallowed and tightened below resistance before clearing it. That single break kicked off a run from around $2,000 toward roughly $5,500 an ounce.
What makes the setup stand out is that the same shape appears on longer timeframes.
Step out to a weekly chart covering five years and you see the same resistance level around $2,000, a big run in 2019 and 2020, then a large base that got a little deep before shallowing and tightening into a breakout near $2,100 an ounce.
Step out to a monthly chart spanning 2005 to 2024 and twenty years of price history shows the same massive shallowing base, all pointing to a breakout right at $2,000 an ounce.
Since then, it's paid off pretty well. Setups built over a twenty-year base obviously don't come around often. But the same approach scales down. Read the daily chart, then zoom into the hourly or even the five-minute chart to catch the breakout intraday.
Frequently Asked Questions
Is breakout trading a good strategy?
Based on the risk-to-reward structure alone, yes. Risk a dollar to make three or four and you only need to be right a quarter of the time to profit over a large number of trades. Be right half the time and the results are strong.
Which breakout strategy is best?
The shallowing pullback pattern, because it's grounded in how institutions actually build positions instead of some arbitrary chart shape. It applies to stocks, crypto, gold, silver, and crude oil, and it works both off the highs after a big advance and off the lows after a stock has been beaten down.
Can you make $1,000 a day day trading?
There's no fixed daily dollar target here. What matters is the underlying math: defined risk of 5 to 12 percent per trade against potential gains of 40 to 60 percent. That structure is what makes consistent profitability possible over time.
What are breakout trading strategies?
Buying an asset as it clears a key resistance level following a period of tightening, shallowing price action. The pattern reflects pent-up supply being absorbed until sellers are exhausted and price is forced higher.
Let the Pattern Do the Work
The shallowing pullback pattern isn't complicated, but it demands patience. You're waiting for sellers to run out, not trying to predict the future. Every time a dip comes in smaller than the one before it, that's real information about who controls the stock.
Risk management carries just as much weight as spotting the setup. Keeping risk in the 5 to 12 percent range while targeting 40, 50, or 60 percent moves is what turns this breakout trading strategy into a durable edge over dozens of trades.
You don't need to be right most of the time. You need your winners to be dramatically bigger than your losers.
Primoris, NuScale, a beaten-down name like Rush Street Interactive, or an entire asset class like gold. The mechanics never change. Find the shallowing, confirm it with volume, buy the break, and manage your risk from there.
Get an entire year of live weekly mentoring sessions, my newsletter, indicators, bonus reports, tons more. Click the link and I'll see you in the next live session.
DISCLAIMER: Traders Agency does not offer financial advice. The information provided is for educational purposes only and should not be considered financial advice. Traders Agency is not responsible for any financial losses or consequences resulting from the use of the information provided. Trading carries inherent risks and may not be suitable for all individuals. You are advised to conduct your own research and seek personalized advice before making any investment decisions, recognizing the potential risks and rewards involved.
See more from Traders Agency on Google
Make us a preferred source and our market analysis will appear more prominently in your Google Search, Top Stories, and AI results.
Add to Preferred Sources