Hey, Ross here:
The setup heading into the midterm elections 2026 is one of the most statistically bullish patterns in the entire four-year presidential cycle, and the fourth quarter we just started has historically been the strongest quarter of all. Going back through midterm election years like 2022 and 2018, stocks have climbed 86% of the time in Q4 alone. That is not a coin flip. That is a pattern worth positioning around.
We are sitting inside that exact window right now. The fourth quarter of a midterm year carries a track record most traders never bother to check, and one sector in particular has a win rate that borders on absurd.
I found a stock inside that sector setting up in a textbook breakout pattern. I already bought shares.
What does history say about stocks during midterm election years?
Bottom Line: Historical patterns since 1950 show Q4 of midterm years and the following 12 months tend strongly bullish, with healthcare among the strongest sectors. Based on that setup, shares of Hinge Health were bought as a breakout play on real revenue growth and free cash flow, with a stop in place to manage risk.
Three base rates that all point the same direction
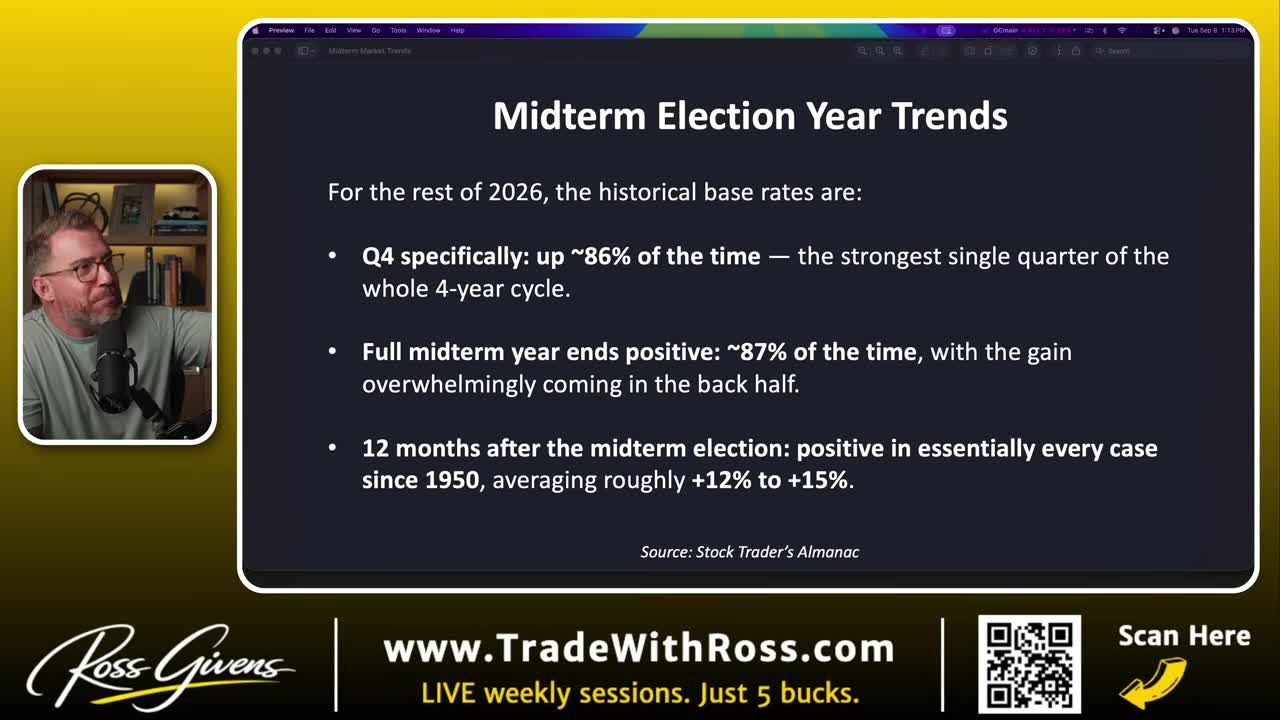
Break it down piece by piece:
- Q4 of midterm election years: up 86% of the time, the single strongest quarter in the entire four-year cycle.
- The full midterm year: ends positive 87% of the time, with the gain overwhelmingly coming in the back half.
- Twelve months after the midterm vote (November 2027 in this cycle): positive in essentially every instance since 1950, averaging 12% to 15%.
That third stat is the one that should stop you cold. Since 1950, the market has followed through with double-digit gains in almost every single case over the following year. This is not a small sample. This is decades of repeated behavior, and it lines up directly with the quarter we just entered ahead of the midterm elections 2026.
Do Stocks Rise After Midterms?
Yes. Going back to 1950, the market has been higher twelve months after a midterm election in essentially every case, averaging a 12% to 15% return.
This is the part of election-year history that gets ignored. Everyone obsesses over the volatility leading up to the vote. Almost nobody pays attention to what happens once the dust settles. The data says that instinct is backwards. The stretch after the midterm has been one of the most reliably bullish windows in the market.
Which sector has the best track record in midterm election years?
One sector sits alone at the top of the list
Financials have historically done well over this stretch. So have industrials and consumer staples, the kind of sectors that put you to sleep. But look at number one.
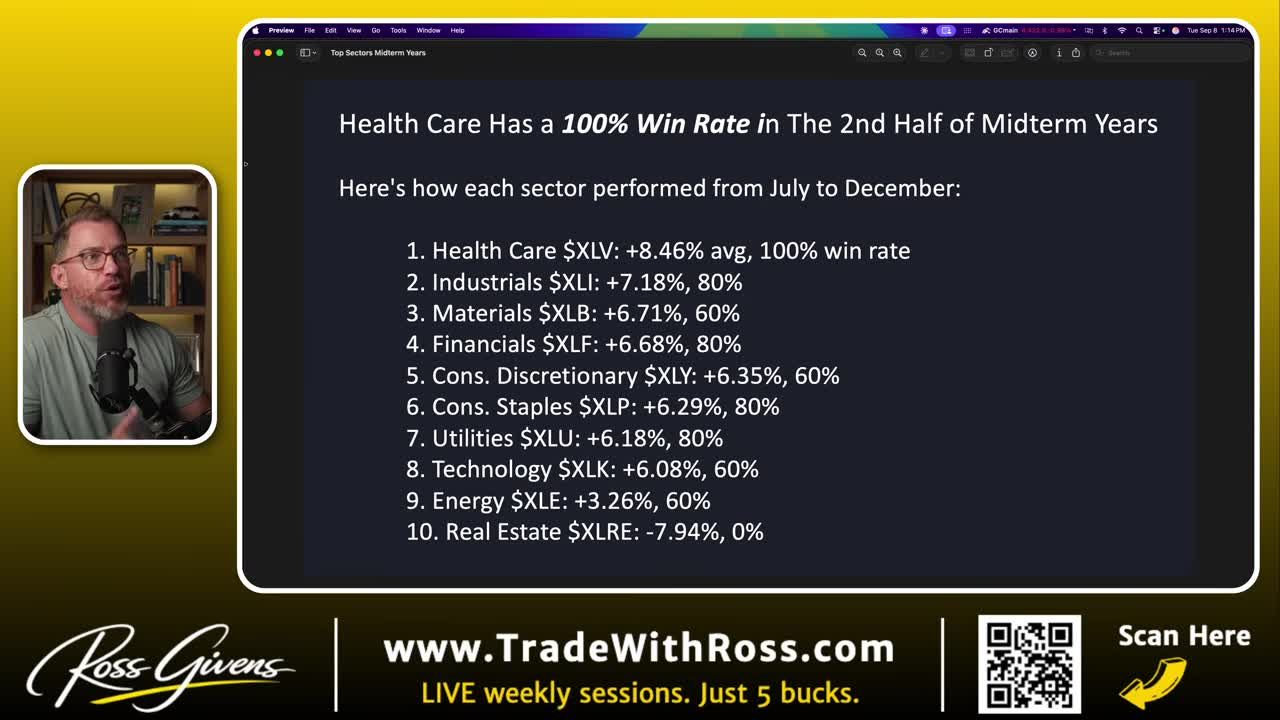
Healthcare has a 100% win rate from July to December of midterm election years. Every single time we have gone through the back half of a midterm year, healthcare stocks have finished that stretch higher. Not most of the time. Every time.
So stack the evidence. Overwhelmingly strong statistics for the full year. Massively strong statistics for the exact quarter we just started. Historically positive expectations for the twelve months that follow. And one sector that has never missed over this window.
Then find a healthcare stock setting up in a picture-perfect breakout pattern. At that point you stop hesitating and start buying.
Get an entire year of live weekly mentoring sessions, my newsletter, indicators, bonus reports, tons more. Click the link and I'll see you in the next live session.
Join my Black Ops Trading ClubWhat stock is being bought ahead of the midterm elections 2026?
The name is Hinge, ticker HNG.
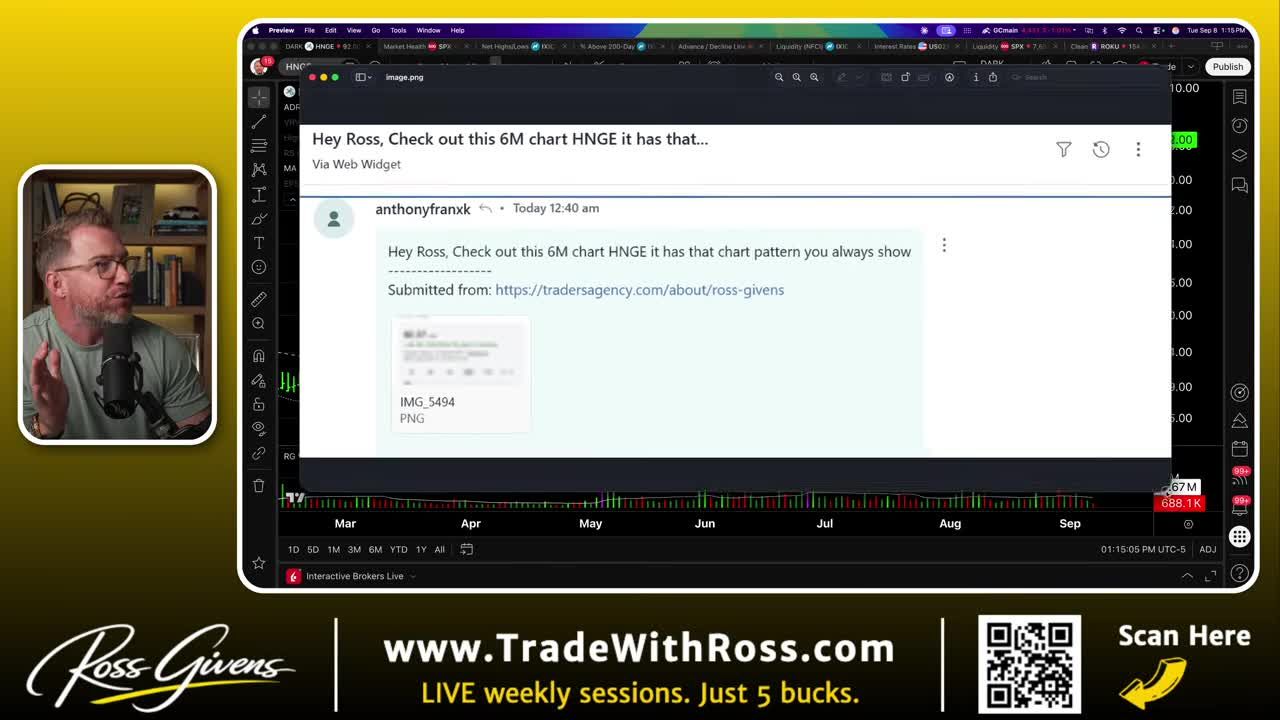
Credit where it is due. A Traders Agency reader named Anthony sent this one in. He emailed us and said to check out the six-month chart on Hinge because it had a pattern we show constantly. He was right.
The shallowing base breakout
The pattern is a shallowing base breakout forming right at the highs. A stock makes a strong move, then needs to absorb and digest it. Shares get accumulated, weak holders get shaken out, price consolidates. Then it typically breaks out again, usually within a dollar or two of the prior buy point.
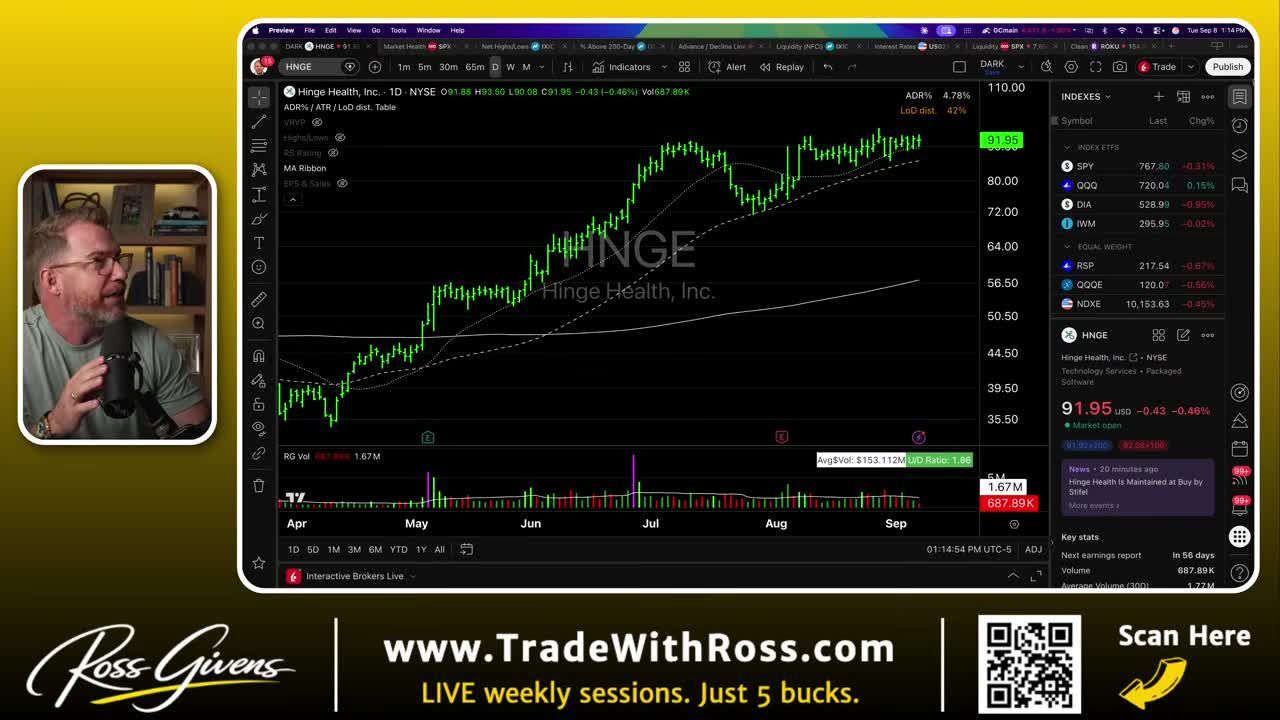
What makes Hinge more interesting is how young it is. The stock went public in May 2025, so it has only about 16 months of trading history. It opened around $32. It now trades near $90. And it has followed the IPO formula step for step:
- Big hype, big pump, big dump: the run higher, then a slide from roughly 60 down to about 30.
- Shallowing consolidation: each dip came in tighter and shallower than the last.
- Breakout: it cleared the high 40s and launched to 92.
- Repeat: the same shallowing pattern is forming again, right at the highs.
The Business Behind the Chart
This is not a hype stock running on a story. Hinge makes an app that treats back pain, knee pain, and joint pain. It is physical therapy through your phone, with AI watching to make sure your form is right. It is sold to large employers as a benefit, and over half of the Fortune 100 already pays for it.
The fundamentals back up the chart:
- Second quarter sales grew 53% to $213 million
- $100 million of free cash flow in a single quarter, without burning cash to grow
- Full-year guidance raised to roughly $860 million
- A $300 million share buyback announced
- An acquisition to move into gut health
This caliber of growth does not come cheap. Hinge trades at 69 times last year's earnings and 36 times next year's earnings. That is not a crazy number by any stretch given the growth rate. It is one of the cleaner growth-plus-profitability stories in all of health tech. You can pull the filings yourself through SEC EDGAR.
How I Played It
The chart does the timing work. The recent high sat at $93.30 and the stock was trading around $93.50, so a breakout buy point above roughly $93 to $94 made sense. A more patient trader could wait for confirmation closer to $95.50. The setup looked clean enough to justify starting a position at current levels instead.
So I did. A couple hundred shares, limit order at $91.85, splitting the difference between the bid and the ask. Filled at $91.84.
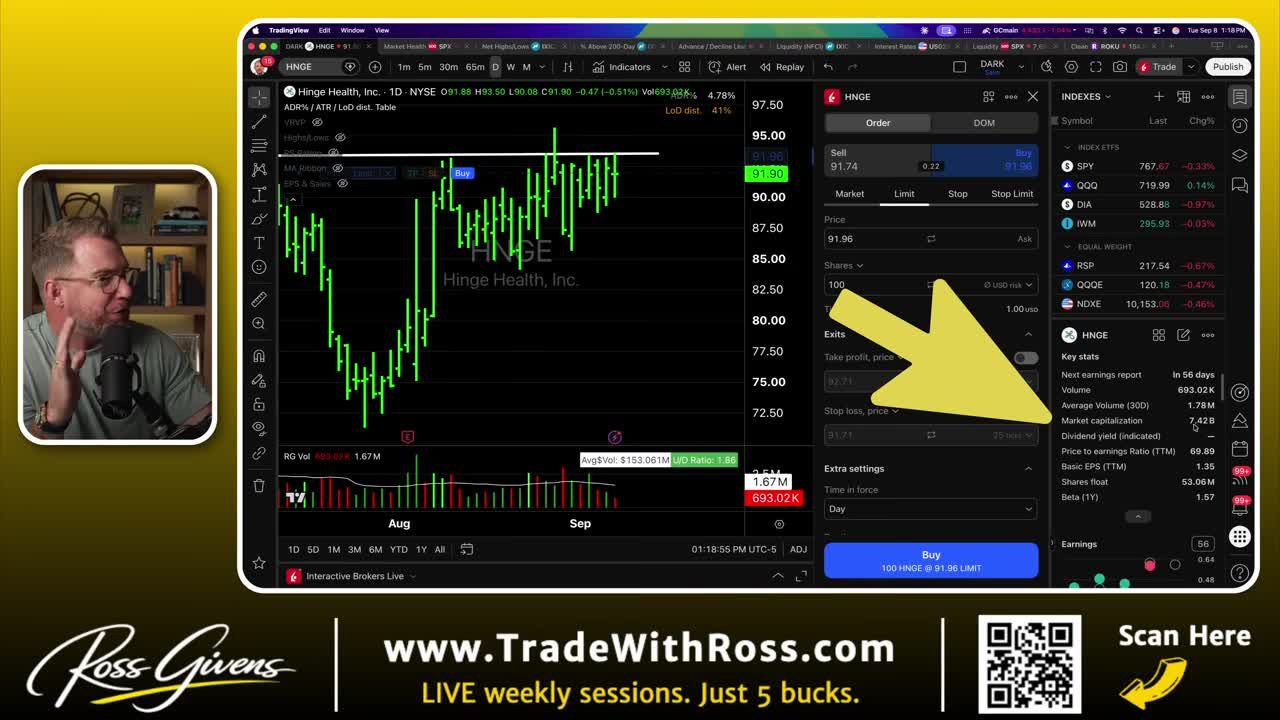
For anyone wondering about size, this is not a little penny stock. Hinge carries a market cap of $7.42 billion. That makes it a clean midcap: big enough for institutions to buy, still small enough to have real room to grow. It is not Pfizer, and it is not somebody's wannabe biotech either.
Then the stop. I worked a sell stop at $84, just beneath the recent swing low, which puts risk on the trade at roughly 9%. Anytime you place a stop, set it good till cancelled. If you don't, it only holds for that trading day, and if the stock hits your number tomorrow or Friday you have no protection at all.
Playing the Odds, Not the Certainty
The statistics around the midterm elections 2026 are about as bullish as historical market data gets. An 86% win rate for the quarter, 87% for the year, a near-perfect record for the twelve months after the vote, and a sector that has never lost over this exact window.
None of it is a guarantee. Don't bet the farm. Anything can happen, especially with the Iran situation and Trump threatening to cut off trade with our trading partners if the Fed doesn't cut interest rates. It is a heck of a time to be a trader.
But when the odds stack up this heavily in one direction, and a stock like Hinge shows up with real revenue growth, real free cash flow, and a clean pattern on top, that is worth risking money on with defined risk. I bought shares, set my stop, and I am letting the pattern play out.
Get an entire year of live weekly mentoring sessions, my newsletter, indicators, bonus reports, tons more. Click the link and I'll see you in the next live session.
DISCLAIMER: Traders Agency does not offer financial advice. The information provided is for educational purposes only and should not be considered financial advice. Traders Agency is not responsible for any financial losses or consequences resulting from the use of the information provided. Trading carries inherent risks and may not be suitable for all individuals. You are advised to conduct your own research and seek personalized advice before making any investment decisions, recognizing the potential risks and rewards involved.
See more from Traders Agency on Google
Make us a preferred source and our market analysis will appear more prominently in your Google Search, Top Stories, and AI results.
Add to Preferred Sources