Skip to content
Back to Blog
Author

Traders Agency Team

Editorial Team

The Traders Agency editorial team delivers daily market analysis, stock research, and trading education. Our team of analysts covers stocks, options, crypto, commodities, and macroeconomics to help traders make informed decisions.
1796 articles
A dramatic upward-trending stock chart rendered in glowing green lines surges across a dark background, with a stylized Nvidia GPU chip at its center radiating electric blue light.
Market News
Market News

Stock Market Today: Nvidia Powers Tech Rally

Stock market today: Nasdaq jumps 1% as Nvidia, Salesforce earnings fuel AI rally. See what's going on in the stock market today and what traders watch next

Aug 27, 2026Read article
A split-screen financial dashboard showing a bold upward revenue bar chart on one side contrasted against a sharply declining margin trend line on the other, rendered in deep blue and red tones.
Educational
Educational

Gross Margin Trends as Early Warning Signals

Learn gross margin trends analysis to spot pricing pressure before earnings crash a stock. See how to calculate, track, and trade the signal.
Aug 27, 2026Read article
A bold upward-trending green stock chart arrow bursts dynamically against a dark background, with glowing Nvidia-green circuit board patterns and GPU chip imagery subtly embedded in the composition.
Market News
Market News

Nvidia Stock Earnings Beat Sends Shares Up 7%

Nvidia stock earnings crush estimates with $96.2B revenue and $2.22 EPS, sending shares up 7.2%. See what's driving the AI-fueled rally.
Aug 27, 2026Read article
A split stock market display board shows various sector ticker symbols with industrial stocks glowing bright green while others remain neutral or slightly red, creating a visual contrast of sector rotation.
Market News
Market News

Stock Market Today: Industrials Leads While S&P 500 Finishes Flat

Industrials led the session while the S&P 500 finishes flat. See the validated market scorecard, sector performance, and what traders are watching next.
Aug 26, 2026Read article
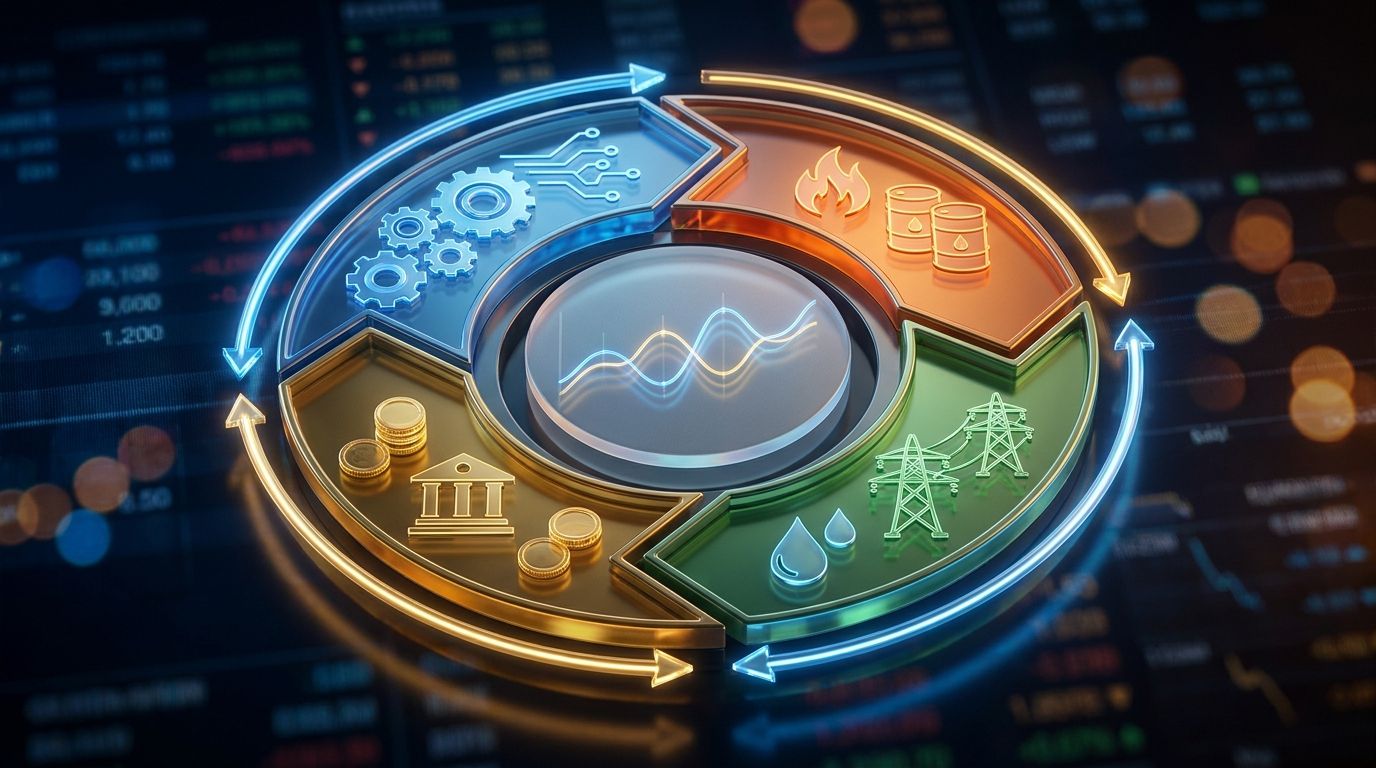
A dynamic circular flow diagram rendered as a glowing, three-dimensional wheel divided into colored segments representing different market sectors — technology, energy, utilities, financials — with bright arrows showing capital moving betwe
Educational
Educational

Sector Rotation and Intermarket Analysis

Learn the sector rotation strategy institutions use to shift capital across market cycles, plus how intermarket analysis confirms your trade signals.

Aug 26, 2026Read article
A bold, upward-breaking candlestick chart rendered in electric orange and gold bursts through a glowing resistance line, set against a dark, moody background that evokes the high-stakes world of trading.
Market News
Market News

MSTR Breakout: Bitcoin Stock Trading Setup

Bitcoin stock trading heats up as MSTR breaks $100 resistance on Bitcoin's surge past $80K. See the breakout levels and options trade targeting $150-160.

Aug 26, 2026Read article
A close-up of a pair of shiny metal handcuffs resting on top of financial charts and stock market graphs, with one cuff open and breaking free. The lighting is dramatic, with a sharp contrast between shadow and a golden light illuminating the broken chain, symbolizing liberation from mental constraints. The financial data visible beneath the handcuffs reinforces the trading context while the breaking-free visual immediately communicates overcoming a psychological trap.
Traders Daily Direction

Don’t Let This “Handcuff” Your Trading

The first number you hear has a strange way of sticking around – even after the facts have moved on. That bias can quietly distort a trading decision.

Aug 26, 2026Read article
A split composition showing a Federal Reserve building or Treasury Department facade on one side, with a dynamic graph line running flat and steady across the center, symbolizing yields holding in a tight range.
Market News
Market News

Treasury Yields Inflation Today: PCE Meets Forecast

Treasury yields inflation today held steady as core PCE hit 3.3%, matching forecasts ahead of Fed's Jackson Hole speech and $40T debt milestone.

Aug 26, 2026Read article
A chess player's hand confidently moves a piece across a board, with the pieces casting dramatic shadows that suggest strategic repositioning rather than retreat.
Educational
Educational

Rolling Options Positions

Learn the rolling options strategy: how to roll calls, calculate net cost, and adjust strikes to protect capital and extend your trade thesis.
Aug 26, 2026Read article
A dramatic close-up of a green upward-trending bond yield curve or price chart glowing against a dark financial dashboard background, with golden light breaking through to suggest a turning tide.
Market News
Market News

Bond Market Rally Today: 175K TLT Calls Bought

Bond market rally today? Traders bought 175K TLT calls vs 40K puts, a 4:1 bullish skew betting the bond rout is ending.

Aug 26, 2026Read article
A split-scene composition showing a glowing stock market ticker board with green and red fluctuating numbers on one side, and a sleek Nvidia GPU chip illuminated in dramatic green light on the other.
Market News
Market News

Stock Market Today: Futures Await PCE, NVDA

Stock market today: futures mixed as traders await the PCE inflation report and Nvidia earnings that could set this week's tone.
Aug 25, 2026Read article
A split composition showing a rising graph line representing bond yields on one side, visually "pushing against" or creating tension with a stock market chart on the other side, rendered in contrasting colors like red and green.
Market News
Market News

Are Rising Bond Yields Good for Stocks?

Rising bond yields are testing the stock rally. See why TLT's drop signals pressure on equities and what traders should watch next.

Aug 25, 2026Read article
Join the Edge

Stop watching.
Start winning.

50,000+ traders get our daily brief before the market opens.

Free. No spam. Unsubscribe anytime.

Traders AgencyWhat Customers Say
4.8
1,544
