BLOG

Stock Market Blog

Daily stock market analysis, trade alerts, and trading education from Ross Givens and the Traders Agency team.

Showing 1–11 of 2548 articles
A split-screen financial dashboard visual showing a glowing upward arrow representing utility towers and power lines on one side, contrasted against a downward-trending oil barrel sinking into a deep red zone on the other.
Market News
Latest Market News

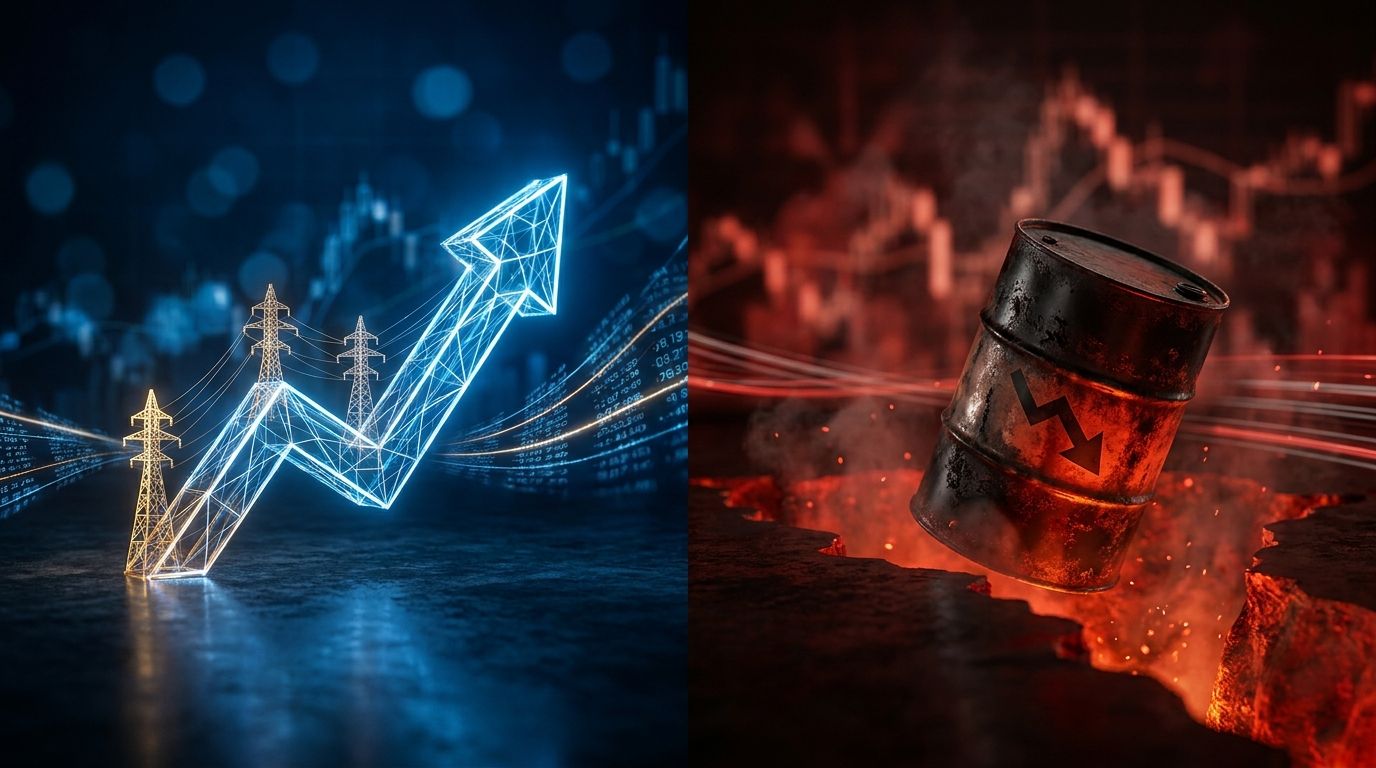
Stock Market Today: Utilities Lead, Oil Near Red Zone

Stock market today: Utilities surged +1.07% as energy sank -1.10% with WTI crude near $97. IEA warns oil markets hit a red zone by July if Hormuz stays shu

TAT
Traders Agency Team
May 21, 2026
A confident Jensen Huang-like figure in a black jacket stands pointing decisively at a glowing upward-trending stock chart, with the chart's line breaking dramatically through the ceiling.
Stock Analysis
Stock Analysis

Buy Every Share You Can: Nvidia CEO's New Favorite Stock Could 10X

ServiceNow stock analysis reveals why Nvidia's Jensen Huang is pointing at NOW as the AI rotation's biggest opportunity. 22% growth, 80B workflows, tenbagg

Ross Givens
Ross Givens
May 21, 2026
A trader sits at a dual-monitor setup in a dimly lit room, with one screen displaying a detailed historical price chart overlaid with strategy entry and exit markers, and the other showing performance metrics and equity curves.
Educational
Educational

Backtesting Your Strategy: Tools and Pitfalls

Backtesting trading strategies reveals whether your edge is real or imaginary. Learn to avoid look-ahead bias, overfitting, and the mistakes that fake resu

TAT
Traders Agency Team
May 21, 2026
A dramatic split-screen composition showing gleaming semiconductor microchips and circuit boards on one side, bathed in cool blue light, contrasted against a backdrop of turbulent Middle Eastern desert skies with distant smoke plumes on the
Market News
Market News

Chipmaker Stocks Iran War: Billionaires Buy

Chipmaker stocks surged as Iran war rattled markets — billionaire family offices loaded Micron, TSMC, and Sandisk. Here's what the Q1 2026 filing data reve

TAT
Traders Agency Team
May 21, 2026
A dramatic split-scene image showing a surging oil barrel or pump jack with flames or an upward arrow on one side, contrasted against a downward-trending stock market graph or falling stock ticker on the other side.
Market News
Market News

Crude Oil Spike Drags Stock Futures Lower

A crude oil spike is hammering stock futures as Treasury yields climb. S&P 500 futures off 0.4%, Iran supply uncertainty keeps energy traders on edge.

TAT
Traders Agency Team
May 21, 2026
A crisp, clean composition showing a glass jar or transparent container filled with physical cash and coins sitting on a desk alongside financial documents and a calculator, with some bills visibly separated or "filtered" from a pile of pap
Educational
Educational

Understanding Free Cash Flow

Free cash flow reveals what net income hides. Learn the FCF formula, how to calculate FCF yield, and how to use cash flow analysis to evaluate any stock.

TAT
Traders Agency Team
May 21, 2026
A dramatic split composition showing the iconic SpaceX Falcon 9 rocket launching into a starlit sky on one side, with a glowing cryptocurrency trading interface and blockchain network nodes on the other side.
Market News
Market News

SpaceX IPO: Pre-IPO Crypto Markets Bypass Wall St

Pre-IPO crypto markets are giving retail investors early SpaceX IPO exposure via an offshore crypto platform — completely bypassing Wall Street gatekeepers

TAT
Traders Agency Team
May 21, 2026
A dramatic split-scene composition showing a crashing oil barrel plummeting downward on one side, while on the other side a glowing green stock market ticker board surges upward, bathed in bright light.
Market News
Market News

Stock Market Today: Oil Crashes, NVDA Looms

Stock market today surged as oil cratered 8.74% on Iran deal hopes, yields dropped, and consumer discretionary ripped +2.53%. Nvidia earnings could change

TAT
Traders Agency Team
May 20, 2026
A dramatic split-scene image showing a crashing stock market graph in deep red on one side, while two glowing memory chips or RAM sticks stand illuminated and untouched amid the chaos.
Stock Analysis
Stock Analysis

The AI Memory Crash Just Exposed 2 Hidden Stocks to Buy NOW

Hidden memory stocks ignored Monday's sector crash while SK Hynix fell 11.5% and Micron dropped 9.5%. Two under-the-radar names signal where institutional

Ross Givens
Ross Givens
May 20, 2026
A dramatic close-up of a stock chart displaying a classic candlestick pattern at a clear turning point, with green candles transitioning into red (or vice versa), rendered in a sleek dark trading terminal aesthetic.
Educational
Educational

Candlestick Patterns: Top 15 Reversal and Continuation Signals

Master reversal candlestick patterns with this guide to 15 signals. Learn to spot bullish and bearish setups, confirm with volume, and time entries precise

TAT
Traders Agency Team
May 20, 2026
A dramatic close-up of an Nvidia GPU chip glowing with electric green and blue light, set against a dark background with blurred stock market ticker data reflected across its surface.
Market News
Market News

S&P 500 Today: Nasdaq Rises Pre-Nvidia Earnings

S&P 500 today climbs 0.7% as Nasdaq surges ahead of Nvidia earnings. What the results mean for AI stocks, tech sentiment, and your next move.

TAT
Traders Agency Team
May 20, 2026
Join the Edge

Stop watching.
Start winning.

50,000+ traders get our daily brief before the market opens.

Free. No spam. Unsubscribe anytime.

Traders Agency What Customers Say
4.8
1,325
4.7
676
Hi, I'm GENTSY