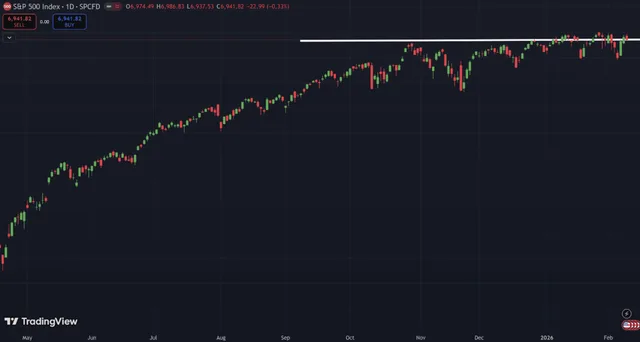
Buying near a market high can feel like a permanent mistake, but long holding periods have historically mattered more than perfect entry timing. This comparison examines five growth ETFs through their holdings, concentration, volatility, historical returns, and overlap. Those measurements describe tradeoffs; they do not establish that any fund will create a particular level of wealth.
What Does the Historical Timing Example Show?
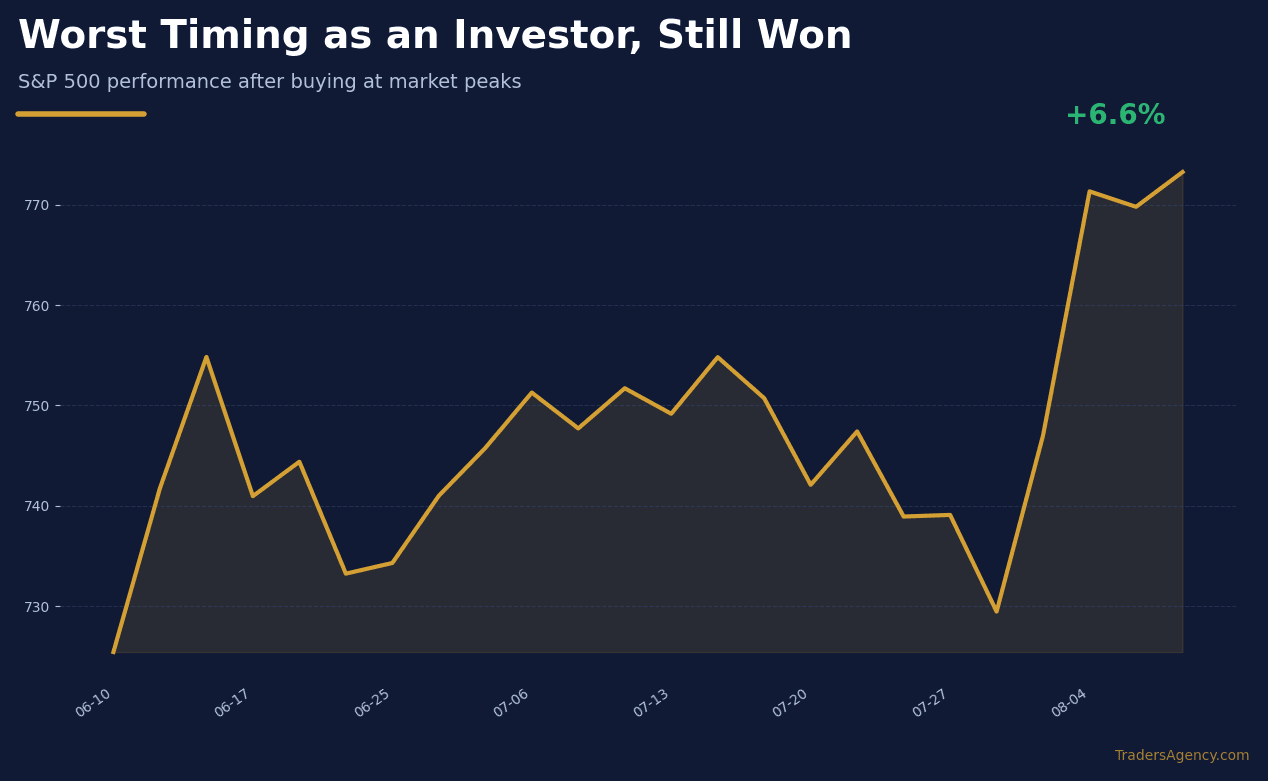
Imagine having the worst timing of any investor alive. Imagine that every single time you put money into the S&P 500, you managed to do it on the exact day the market topped out, right before a massive crash. From there, you did nothing about it. You never sold, and you just held on. If you bought in October of 2007, right before the worst crash since the Great Depression, you would have watched 55% of your money completely disappear.
Even with that historically terrible timing, you still would have made 10.8% a year over the long run. That return is actually better than the market's own long-term average. The reality is that some of those investments were negative for years before they finally turned a profit. Timing the market is not the hard part. Leaving the money alone is the hard part. With ETFs, somebody else runs the fund for you. Somebody else rebalances the holdings when they drift, allowing you to genuinely set it and forget it.
How Have These Growth ETFs Behaved During Market Declines?
Severe market declines test whether an investor can tolerate volatility long enough for compounding to matter. The five funds below have different histories and risk profiles: broad-market exposure has the longest record, while narrower thematic funds can be more cyclical and have much shorter track records.
When examining what creates the majority of millionaires in the financial markets, the data points away from perfect timing and toward uninterrupted compounding. The focus here is strictly on market data, and the numbers are consistent with the underlying philosophy of passive holding.
The comparison covers a broad S&P 500 fund, a concentrated semiconductor fund, and three narrower themes tied to memory chips, commercial space, and quantum-related companies. The useful question is not whether they guarantee wealth, but how much concentration, overlap, and drawdown risk each adds.
VOO as the Broad-Market Baseline
When building a portfolio, it helps to establish a stable foundation before adding volatile growth assets. This starts with the Vanguard S&P 500 ETF, trading under the symbol VOO. This fund holds the 500 largest public companies in America and weights every one of them by how big that company is.
That weighting mechanism is highly important because it is not what most people picture. You are not buying 500 companies equally. If you put $1,000 into this fund, about $76 of it goes into Nvidia, while about $6 goes into Costco, a company that most consumers visit every other week. The giant companies get the biggest slices, and everybody else is just along for the ride. When a business shrinks, its slice shrinks right along with it. The best part is that nobody has to make a decision, and nobody has to hold a meeting. That is the entire reason this fund can sit untouched for 40 years.
The Vanguard S&P 500 ETF acts as the floor for a portfolio. It is the boring base that allows everything else you own to be a little violent. By violent, that means assets that have big growth, which comes with big highs and a lot of big lows.
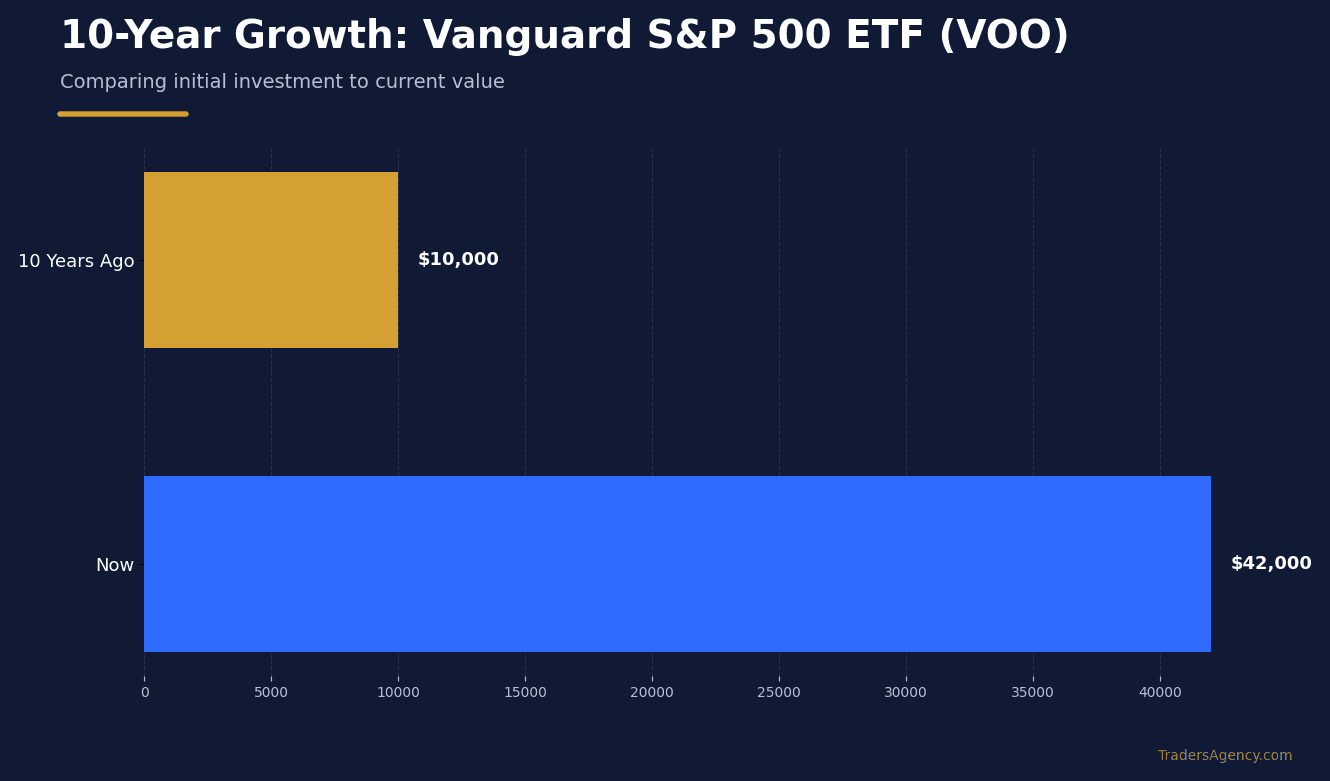
Over the last 10 years, the cited return for VOO is 15.5% a year, turning a hypothetical $10,000 into $42,000. That backward-looking result gives the other funds a broad-market baseline. It does not guarantee the next decade will match the last one.
Accelerating Returns with the VanEck Semiconductor ETF
While VOO is the base, it is not the ceiling. For higher growth, the next fund is the VanEck Semiconductor ETF, trading under the symbol SMH. This fund owns the 25 largest US-listed semiconductor companies and nothing else. It holds no software companies and no banks. It only holds businesses that design and manufacture chips.
It weights these companies by size the way the S&P 500 fund does, but with one rule that changes everything. It caps how big any single company is allowed to get. Right now, that cap is about 20%. This rule matters because it means the fund cleans itself. Whenever a company gets too big inside the ETF, the fund is forced to sell some of it down and push that money right back into everything else. You can watch this mechanic working in real time. In the first half of 2026, almost none of this fund's gains came from its largest holding. Instead, the gains came from Micron, Intel, and AMD. Those companies are much further down on the list, and they did the heavy lifting.
This self-cleaning mechanism makes it a high-conviction growth holding. Over the last 10 years, this fund has returned 34% a year. That same $10,000 investment became roughly $186,000, whereas the S&P fund turned it into only $42,000. That performance gap is the entire reason investors do not just own the S&P 500 fund and call it a day.
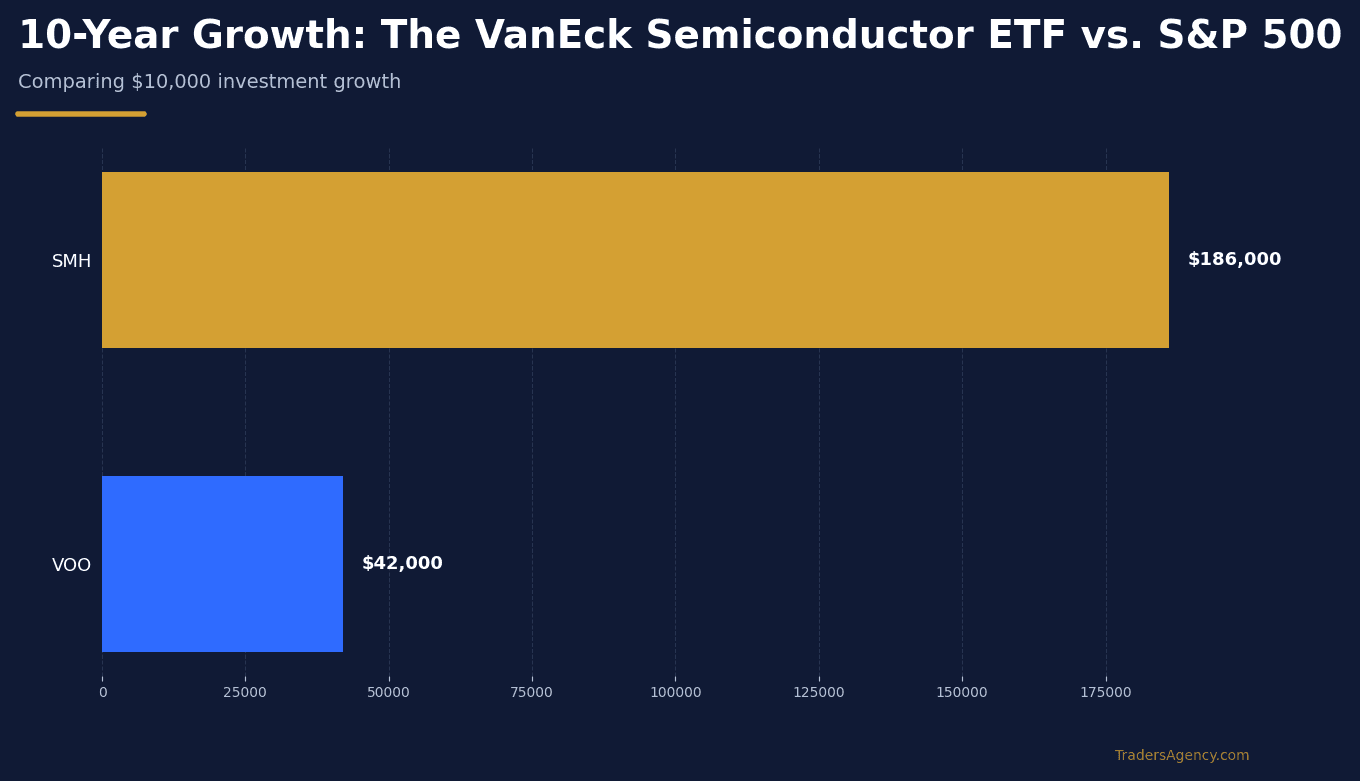
The cited outperformance came with materially larger drawdowns. SMH fell 45% from peak to trough in 2022, one of four declines of at least 27% since 2018. Historical recovery does not remove the possibility of long periods of loss, and a 10-year return comparison should not be read as a forward return forecast.
Want expert trading insights delivered daily?
Join thousands of traders who rely on Traders Agency for market analysis and trade ideas.
Join Traders AgencyMemory, Space, and Quantum ETF Risks
The remaining three funds target narrower themes and therefore require a different risk review. DRAM concentrates on memory-chip producers, NASA holds commercial-space companies, and QTUM spreads exposure across a much broader set of companies with only partial ties to quantum computing.
The Roundhill Memory ETF (DRAM)
The Roundhill Memory ETF, symbol DRAM, sits on the opposite end of the risk scale from the S&P 500. It only holds 12 companies that make their money from memory chips. It does not spread that money out. Micron, Samsung, and SK Hynix carry roughly three-quarters of the whole fund just between them. The AI buildout ran straight into a memory wall in 2026 because every AI chip needs memory stacked right next to it, and there is not enough of it being made. That specific kind of memory is forecast to compound at 25% a year through the end of this decade. That is the fastest growth attached to anything in this analysis, and this fund is the cleanest way to buy it. It is also the only fund here that gets you direct access to Korean memory makers like Samsung.
Memory has historically moved in cycles. Demand tied to AI infrastructure may remain strong, but additional supply could eventually pressure prices. That makes DRAM's concentration and cycle sensitivity central risks rather than reasons to assume continued outperformance.
The Tema Space Innovators ETF (NASA)
The Tema Space Innovators ETF, symbol NASA, holds 38 companies across launch services, satellites, and spectrum-related businesses. The cited industry estimate is $600 billion a year, but many holdings are not profitable and the fund was down more than 40% from its late-May peak. Its short record and unprofitable constituents make it a high-risk thematic fund.
The Defiance Quantum ETF (QTUM)
The Defiance Quantum ETF, symbol QTUM, holds 89 companies at roughly equal weights. Only about 12% of the fund is directly tied to quantum computing, while about 20% consists of foreign-listed companies. That diversification limits single-name concentration but also makes the fund a less direct quantum-computing exposure than its name may imply.
The Hidden Danger of Fund Overlap
When searching for growth ETFs, investors often buy multiple funds without checking what is inside them. It is worth looking at the overlap of all the holdings across these funds.
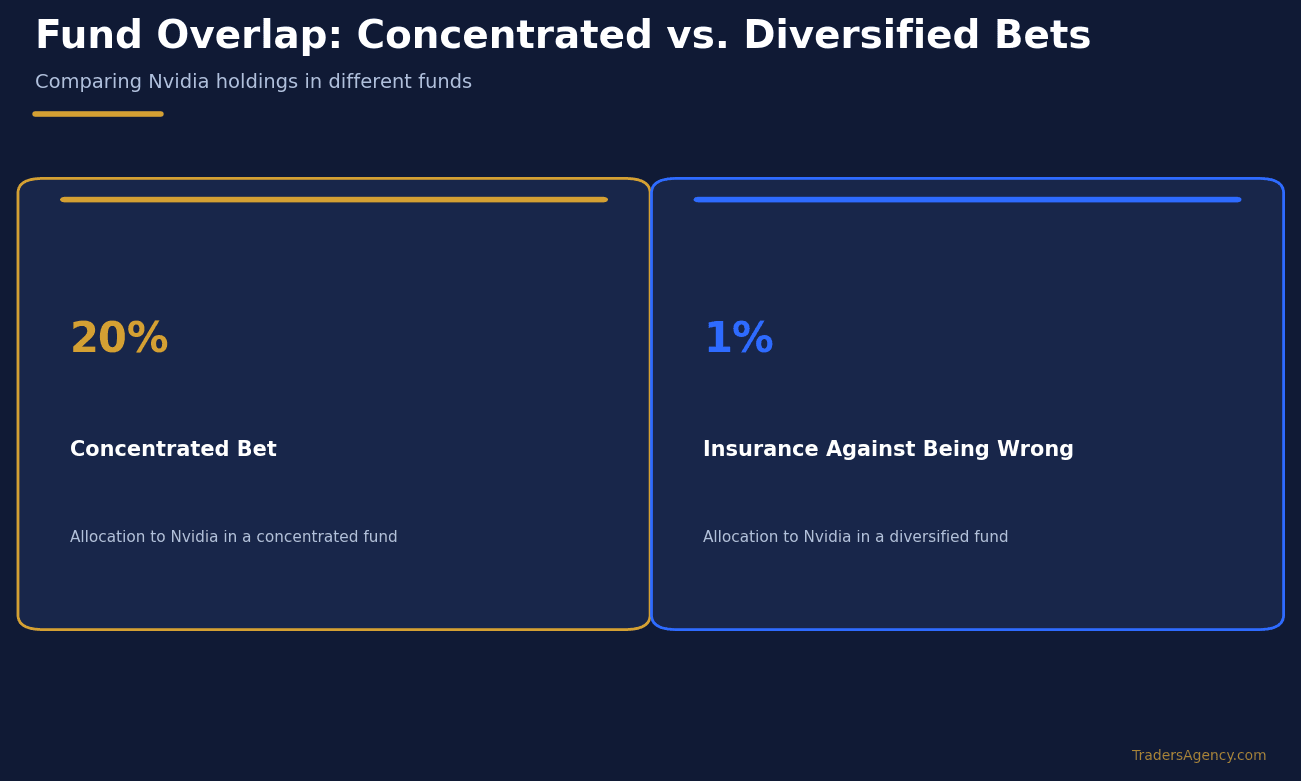
Two things stand out in the data. The semiconductor fund and the quantum fund are the pair to think the hardest about regarding overlap. Meanwhile, the space fund touches nothing else at all, which is the whole reason it makes the list. If you already own an S&P fund and a chip fund, you must check those overlap lines before adding anything else. A high overlap number does not mean two funds are exact duplicates. They may own most of the same companies, but one puts 20% of your money into Nvidia while the other just puts 1%. One is a concentrated bet on the winners, while the other is insurance against being wrong about who the winners are.
This overlap data explains why the popular Invesco QQQ Trust, or its cheaper twin QQQM, is not on this list. While QQQ genuinely beat the S&P fund over the last 10 years, it is 49% of the same fund as VOO and 32% of the same fund as the semiconductor ETF. Because VOO and SMH are the backbone of this strategy, adding QQQ is just a remix of the two positions you already lean on the hardest. It gets squeezed out from both sides.
Looking directly at the companies shows how accidental concentration happens. Nvidia sits inside three of these five funds. If you bought all five of them in equal amounts, Nvidia would end up at 5.9% of everything you own. However, your biggest position would actually be Micron. Micron sits inside four of the five funds, and it is a quarter of the memory fund all by itself. Buying all five funds in equal amounts turns one memory chip company into 7% of your entire portfolio, sitting ahead of Nvidia. You never picked that allocation. It happened because four fund managers each made a perfectly reasonable decision inside their own fund, and nobody added them up for you.
The Bottom Line
- The Comparison: VOO supplies broad-market exposure and the longest record in the group. SMH has the strongest cited 10-year return but much larger drawdowns. DRAM, NASA, and QTUM add narrower themes with concentration, profitability, or track-record risks.
- Managing Overlap: Buying multiple tech or growth ETFs often leads to accidental concentration in companies like Micron or Nvidia. Always calculate total exposure across all funds before adding a new ETF to your portfolio.
- What to Monitor: The memory chip cycle is worth watching closely. The specific memory required for AI chips is forecast to compound at 25% a year through the end of this decade, but supply could eventually catch up to demand, which could require active management of that specific position.
Want expert trading insights delivered daily?
Join thousands of traders who rely on Traders Agency for market analysis and trade ideas.
Join Traders AgencyThis content is for educational purposes only and does not constitute financial advice. All investing involves risk, including the potential loss of principal.
DISCLAIMER: Traders Agency does not offer financial advice. The information provided is for educational purposes only and should not be considered financial advice. Traders Agency is not responsible for any financial losses or consequences resulting from the use of the information provided. Trading carries inherent risks and may not be suitable for all individuals. You are advised to conduct your own research and seek personalized advice before making any investment decisions, recognizing the potential risks and rewards involved.
See more from Traders Agency on Google
Make us a preferred source and our market analysis will appear more prominently in your Google Search, Top Stories, and AI results.
Add to Preferred Sources