
Wall Street is pushing higher on tech earnings even as bond yields climb to multi-year highs, and the two forces are colliding right in front of us. We are tracking a sharp divergence in how capital is moving through the market, and the data we are watching reveals shifts that retail traders need to understand today.
How Did Wall Street Gain on Tech Earnings While XLK Dropped 10%?
The numbers tell a clear story of sector rotation and yield pressure. While the headlines focus on tech leading the tape, the underlying data reveals a more complicated picture. Over the last 60 days, the Technology Select Sector SPDR Fund (XLK) has posted a -10.23% price change.
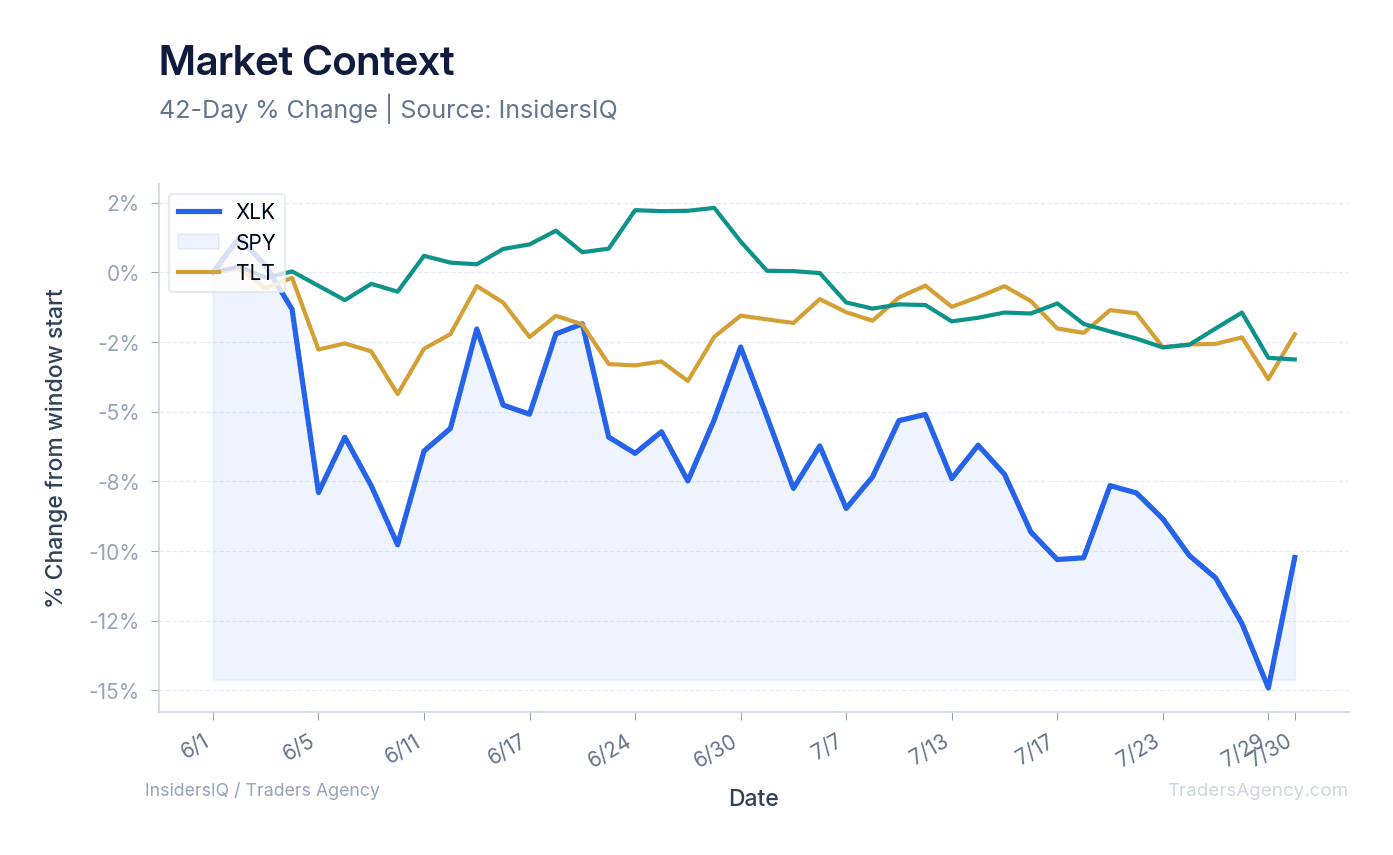
During this same period, the SPDR S&P 500 ETF Trust (SPY) experienced a milder -2.22% decline. At the same time, the iShares 20+ Year Treasury Bond ETF (TLT) shows a -3.12% drop over the last 60 days. That confirms bond yields are indeed reaching multi-year highs, creating a headwind for the very tech stocks trying to lead the market higher.
The Divergence: Over the last 60 days, XLK is down -10.23% while SPY is off just -2.22%. Tech is falling roughly five times faster than the broad index.
Which Tech Companies Drive the S&P 500?
A small group of mega-cap technology leaders carries an outsized share of index performance. When the market rallies on tech, these specific names dictate the overall direction. Their recent earnings are attempting to offset the pressure from rising yields.
Traders frequently ask about these leaders because of their heavy index weighting. When yields spike, high-valuation names typically face selling pressure. But the current earnings season is delivering enough fundamental strength to keep buyers engaged for now.
Why Are Bond Yields at Multi-Year Highs Impacting Tech?
Bond yields at multi-year highs hit tech valuations directly by raising the risk-free rate of return. That makes the future cash flows of growth companies less attractive to investors today. The -3.12% drop in TLT over the last 60 days reflects this yield movement.
Any inflationary pressure typically drives yields higher, and that raises borrowing costs across the board. It creates a difficult environment for spotting the next fast-growing tech name when the cost of capital keeps climbing.
Want expert trading insights delivered daily?
Join thousands of traders who rely on Traders Agency for market analysis and trade ideas.
Join Traders AgencyHow Will This Affect the Market?
This tug-of-war will drive increased volatility across major indices as tech earnings battle rising interest rates. We expect sharp intraday swings in both the XLK and SPY ETFs. Our team believes the market will heavily favor companies with immediate cash flow over speculative growth stories.
We are tracking several specific signals in this environment. The intersection of strong earnings and high yields calls for a tactical approach:
- Monitor the TLT: The -3.12% 60-day move in long-term bonds is the primary indicator for yield pressure.
- Track XLK relative strength: Watch whether the tech sector can recover from its -10.23% 60-day drawdown.
- Watch SPY support levels: The broader index's -2.22% dip suggests it is holding up better than pure tech.
What Does the Latest NVDA News Signal?
The latest NVDA action signals whether semiconductor strength can overpower the broader macro headwind of rising yields. Traders asking why the stock is moving need to look at its core earnings power. Strong individual corporate performance is currently acting as a counterweight to the multi-year highs in bond yields.
The technology sector remains highly sensitive to these earnings reports. When a major player posts strong numbers, it provides localized relief for the XLK. We are watching the following technical implications:
- The ability of tech leaders to sustain their earnings momentum.
- The ongoing resistance levels in the TLT ETF.
- The divergence between the XLK and the SPY.
The Bottom Line
We see a market caught in a tug-of-war between strong corporate earnings and restrictive bond yields. The gains in tech are real, but the -10.23% drop in XLK over the last 60 days proves the trend is volatile. We are keeping position sizing small and staying focused strictly on the data.
Want expert trading insights delivered daily?
Join thousands of traders who rely on Traders Agency for market analysis and trade ideas.
Join Traders AgencyKey Takeaways
- XLK dropped -10.23% over the last 60 days, falling roughly five times faster than SPY, which declined only -2.22% in the same period.
- TLT fell -3.12% over 60 days, confirming bond yields are at multi-year highs and creating a direct headwind for tech valuations.
- The headline narrative of 'Wall Street gains on tech' masks a deeper sector rotation, where capital is moving away from tech at a pace the broad index does not reflect.
- Individual mega-cap earnings are providing localized relief for XLK, but that relief is not enough to reverse the broader 60-day trend.
- The recommended trading posture is small position sizing with strict focus on data, given the tug-of-war between earnings momentum and restrictive yield conditions.
DISCLAIMER: Traders Agency does not offer financial advice. The information provided is for educational purposes only and should not be considered financial advice. Traders Agency is not responsible for any financial losses or consequences resulting from the use of the information provided. Trading carries inherent risks and may not be suitable for all individuals. You are advised to conduct your own research and seek personalized advice before making any investment decisions, recognizing the potential risks and rewards involved.
See more from Traders Agency on Google
Make us a preferred source and our market analysis will appear more prominently in your Google Search, Top Stories, and AI results.
Add to Preferred Sources