
The 30-year Treasury yield is closing in on 5.2%, and this is a market event traders cannot afford to ignore right now. Our analysis shows this climb is actively threatening long-duration bond funds, and a surge to 6% could slam stocks. That creates a dual-threat setup for both equity and fixed-income portfolios. We are watching this closely, because an accurate 30-year Treasury yield forecast is essential for anyone holding exposure today.
The numbers tell a clear story about market pressure. Over the last 60 days, we have tracked specific downward price action in major funds tied to these yield movements. If you are holding equities or long-duration bond funds, these exact levels demand your attention. The data we are watching suggests the window for managing this yield risk is narrowing fast.
What Is Driving the Current 30-Year Treasury Yield Higher?
Here is what we know based on the market data we are tracking. The current 30-year Treasury yield is approaching the 5.2% mark. Our analysis shows that a continued spike toward 6% presents a direct hazard to the broader stock market. This is not a distant possibility. The long-bond yield spike is increasingly likely right now.
We are tracking the direct fallout in the exchange-traded fund space. The data confirms that popular long-term Treasury and TIPS ETFs are facing deepening losses as this yield environment develops. Looking at the exact 60-day price changes, the iShares 20+ Year Treasury Bond ETF (TLT) is down -1.95%.
In the same 60-day window, the broader stock market is also showing signs of stress. The SPY, which tracks the S&P 500, has recorded a price change of -0.42%.
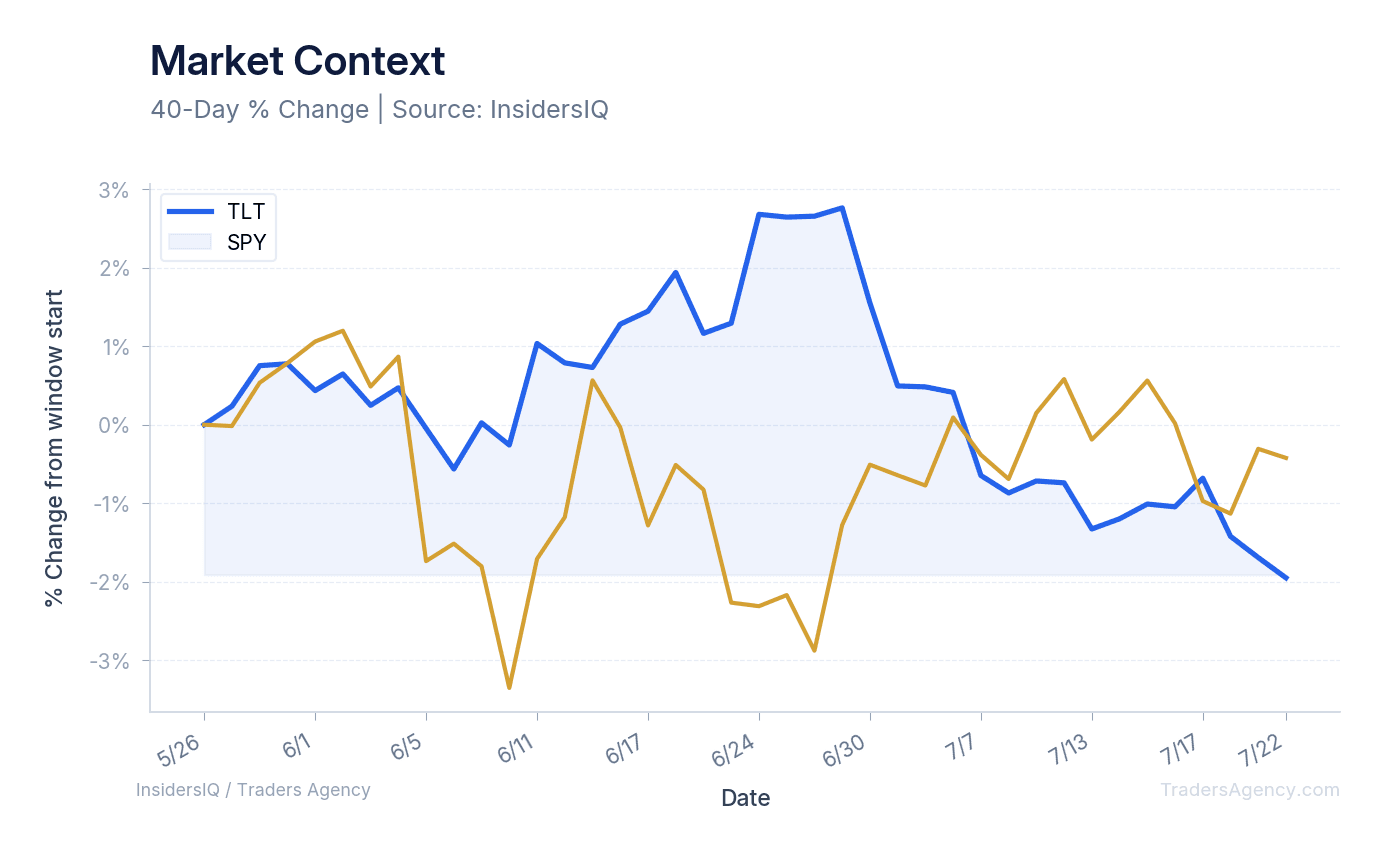
The Numbers: Over the last 60 days, TLT is down -1.95% as the 30-year yield nears 5.2%, while SPY has slipped -0.42%. A surge toward 6% could turn that minor equity decline into a much larger problem.
These figures form the baseline for our current market thesis. The -1.95% drop in TLT directly reflects the pressure of the yield nearing 5.2%. The -0.42% drop in SPY shows that equities are already feeling the early effects of this bond market movement.
What Happens When 30-Year Treasury Yields Rise?
When 30-year Treasury yields rise toward 5.2%, popular long-term Treasury and TIPS ETFs face deepening losses, and a further surge to 6% could slam the broader stock market. We see this dynamic playing out directly in the recent 60-day performance data for major index funds.
The relationship between yields and bond fund prices is strictly inverse. As the yield pushes higher, the price of the 30-year Treasury falls. That explains the -1.95% drop in TLT over the past 60 days. Traders holding these long-duration assets are absorbing the impact of the yield approaching 5.2%.
The deepening losses in these long-term Treasury funds are a direct mathematical result of the long-bond yield spike. The threat extends beyond bond funds, too. The possibility of the yield hitting 6% is a level that equity traders must respect.
The SPY is already showing a -0.42% decline over the same 60-day period. If the yield continues its upward path, our analysis suggests the pressure on stocks will intensify. A surge to 6% could slam stocks, turning that minor 60-day decline into a much larger structural issue for equity portfolios.
Adjusting Your 30-Year Treasury Yield Forecast
A reliable 30-year Treasury yield forecast requires looking at the specific funds absorbing the damage. The deepening losses in TIPS ETFs and long-term Treasury funds are the primary signals we are watching. We base our analysis entirely on the observable price action in these vehicles.
Traders often look at long-term bond price history to contextualize these moves. Right now, the immediate 60-day window gives us the most actionable data. The -1.95% slide in TLT confirms that the market is pricing in the increasingly likely long-bond yield spike.
We track this 60-day window because it captures the exact period where the yield began closing in on the 5.2% level. We are monitoring three specific market implications:
- The approach to 5.2%: The immediate move of the yield toward the 5.2% level.
- Fund degradation: The ongoing price erosion in TIPS ETFs and long-term Treasury funds.
- The 6% threat: A looming 6% yield, which could slam stocks and accelerate the -0.42% drop we have already seen in SPY.
We believe understanding these three points is mandatory for anyone holding exposure to either side of this trade. The data clearly shows that the long-bond yield spike is not isolated to the Treasury market.
Want expert trading insights delivered daily?
Join thousands of traders who rely on Traders Agency for market analysis and trade ideas.
Join Traders AgencyTracking the 30-Year Treasury Yield Chart
We are keeping a close eye on the 30-year Treasury yield chart as the rate approaches 5.2%. The visual read on this climb is essential for timing potential entries or exits in affected funds. We expect the price action in long-term Treasury and TIPS ETFs to stay highly sensitive to these chart levels.
While some traders might use a bond calculator to estimate their exact exposure, the broader market takeaway is simple. The long-bond yield spike is threatening portfolios. You must watch the 6% threshold.
If the yield hits that mark, the data indicates it could slam stocks entirely. The -0.42% drop in SPY over the last 60 days is the initial warning sign we are tracking. We are also watching related duration metrics, such as the 20-year Treasury yield, to see if the pressure is uniform across the long end of the curve.
The -1.95% drop in TLT over 60 days shows that the 20-plus year duration is already under heavy distribution. Traders should monitor these specific duration bands to understand exactly where the deepening losses are concentrated.
How Are SPY and TLT Moving Together as Yields Rise?
The 60-day performance numbers provide a clear roadmap for what to watch next. With SPY down -0.42% and TLT down -1.95%, we are seeing simultaneous pressure on both equities and long-term bonds. This correlation is the exact reason a surge to 6% could slam stocks.
Traders should watch whether the losses in TIPS ETFs begin to accelerate. The fact that a long-bond yield spike is increasingly likely means the current 5.2% level might be just a stepping stone. If the outlook shifts definitively toward 6%, we expect the 60-day price changes for both SPY and TLT to reflect even steeper declines.
We are treating the 5.2% level as the immediate trigger. If the yield breaks and holds above this line, the deepening losses in long-term Treasury ETFs will likely continue. We are using the -1.95% 60-day marker on TLT as our baseline for measuring future selling pressure.
The Bottom Line
Our analysis shows that the 30-year Treasury yield closing in on 5.2% is actively threatening long-term Treasury and TIPS ETFs. With TLT down -1.95% and SPY down -0.42% over the last 60 days, the data confirms that a surge to 6% could slam stocks. We are strictly monitoring these yield levels and the resulting price action in major index funds to manage exposure.
Want expert trading insights delivered daily?
Join thousands of traders who rely on Traders Agency for market analysis and trade ideas.
Join Traders AgencyKey Takeaways
- The 30-year Treasury yield is approaching 5.2%, a level our analysis identifies as an active threat to long-duration bond funds and equities.
- TLT, the iShares 20+ Year Treasury Bond ETF, is down -1.95% over the last 60 days, used here as the baseline for measuring ongoing selling pressure.
- SPY is down -0.42% over the same 60-day window, confirming that rising long-bond yields are already bleeding into equity markets.
- A surge toward 6% on the 30-year yield would create a dual-threat environment, hitting both fixed-income and stock portfolios simultaneously.
- The window for managing long-duration yield risk is narrowing, making current yield levels a priority for any portfolio with Treasury or TIPS exposure.
DISCLAIMER: Traders Agency does not offer financial advice. The information provided is for educational purposes only and should not be considered financial advice. Traders Agency is not responsible for any financial losses or consequences resulting from the use of the information provided. Trading carries inherent risks and may not be suitable for all individuals. You are advised to conduct your own research and seek personalized advice before making any investment decisions, recognizing the potential risks and rewards involved.
See more from Traders Agency on Google
Make us a preferred source and our market analysis will appear more prominently in your Google Search, Top Stories, and AI results.
Add to Preferred Sources