

President Donald Trump just disclosed a massive batch of new personal stock trades. This trump stock portfolio disclosure reveals exactly where the billionaire is parking his capital right now. Somewhere between $280 million and $470 million in net buying deployed into the market during the first quarter alone.
This is all public record. You just need to know where to look and how to read the data.
The pattern is clear: aggressive buying in commodities, emerging markets, and specific tech names. Heavy selling of dividend funds. And a portfolio that lines up with a commodity super cycle thesis.
What Did Trump's Stock Portfolio Disclosure Actually Reveal?
Bottom Line: Trump's Q1 disclosure is one of the largest single-quarter transaction reports ever filed by a sitting president, and the pattern inside it is consistent: sell yield, buy commodities, buy emerging markets. Whether you follow the trades or simply use them as a macro signal, the sheer scale of the repositioning makes the commodity super cycle thesis worth taking seriously.
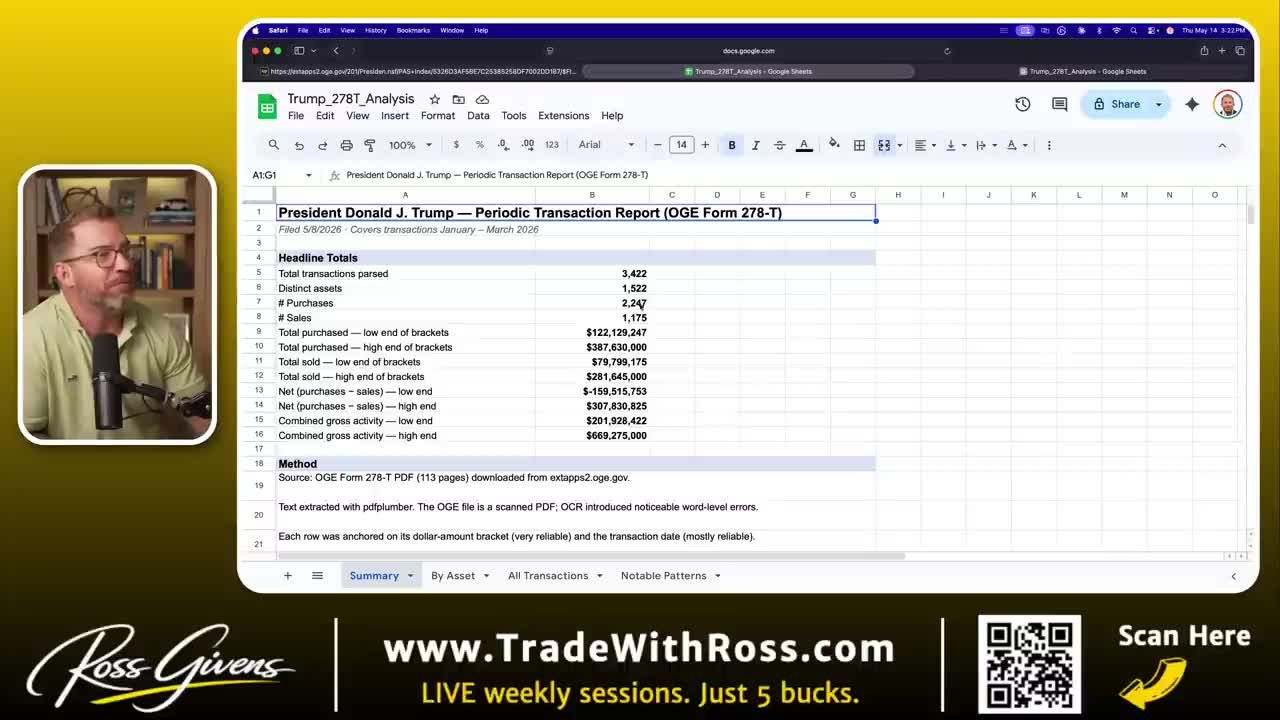
The disclosure, filed with the U.S. Office of Government Ethics, contains 3,422 individual transactions executed between January and March. The document itself is a physical paper filing housed at the White House, with the president's signature right at the top.
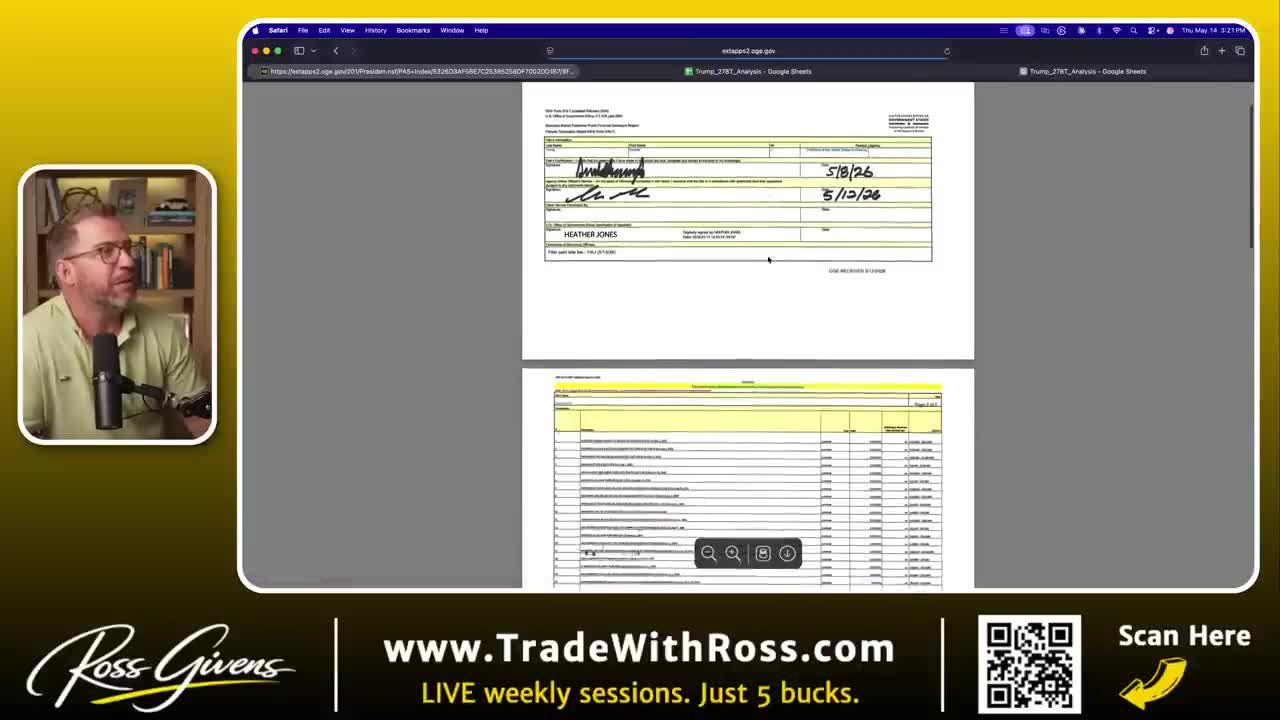
Just like the trades of senators and members of the House, these disclosures are mandatory for public servants. When you access the database, you see filings from officials like Abby Warren and Richard Omali. But the most important data comes from the president.
Love him or hate him, he is a billionaire. He is not sitting on his phone placing trades through a Robinhood account. He has professionals managing this money. The sheer volume of buys and sells represents a massive amount of capital moving through the equity market.
Why the Numbers Are Fuzzy
There is a frustrating element to federal financial disclosures. When the president or a member of Congress discloses a trade, they don't provide the exact dollar amount. They fill out the forms using predefined brackets.
$15,000 to $50,000 is one bracket. Then $50,000 to $100,000, followed by $100,000 to $250,000. The brackets get much wider as the numbers climb. One bracket simply states $1 million to $5 million.
That is a massive range. If you live in a $1 million house versus a $5 million house, you are in a completely different sphere of homeownership.
The Microsoft trades illustrate this perfectly. Purchases landed somewhere between $2.3 million and $7.8 million. Sales fell between $5 million and $26 million. The spread is incredibly wide.
Normalizing the Data
To find actual patterns in 3,422 transactions, the data requires normalization. The approach: calculate the midpoint for each range. If a trade was listed between $1 million and $5 million, record it as $3 million. Between $50,000 and $100,000, adjust it to $75,000.
This method is not perfect. These aren't exact to-the-penny numbers from his broker. We could be looking at buys on the high end of the range and sells on the low end, or vice versa.
But the normalization reveals the true net activity.
The Biggest Buys
When you filter for the largest net purchases, specific names stand out. These are assets showing heavy buying volume with zero sales.
At the very top of the list: the iShares MSCI Emerging Markets ETF.
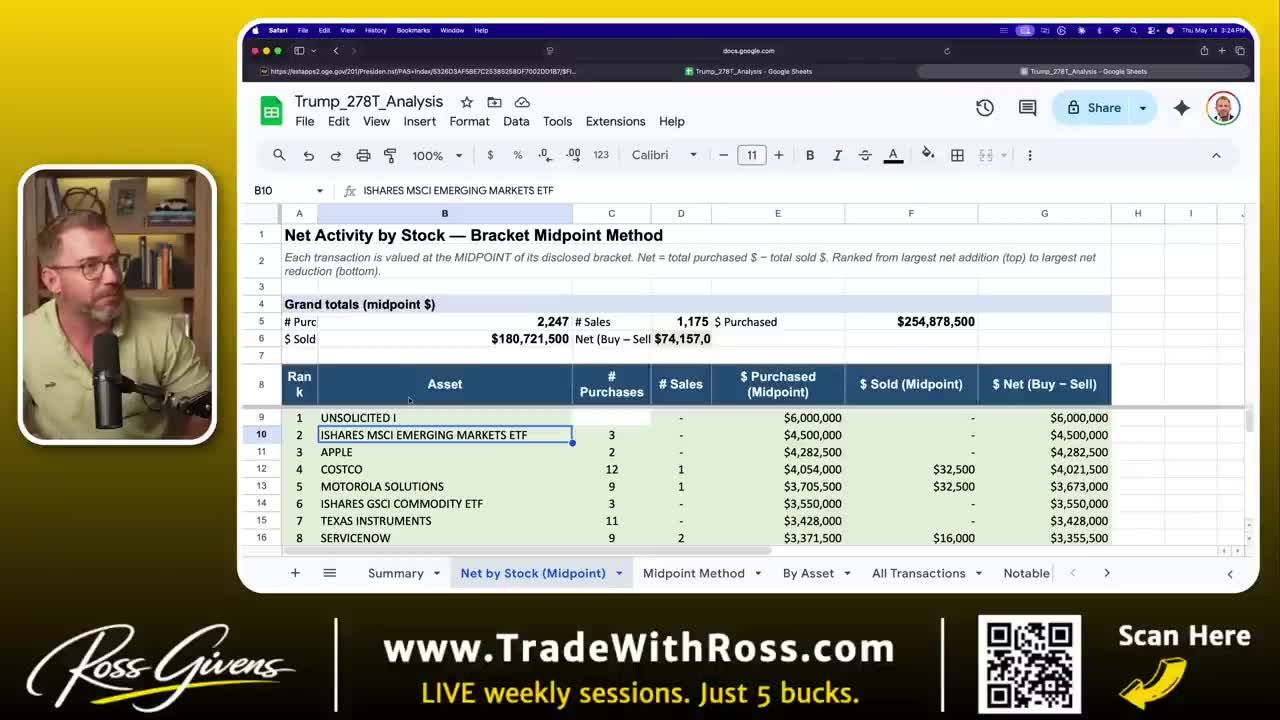
This is a highly strategic allocation. This is one of the largest holdings in my own retirement account. US stocks are getting richly valued and pretty extended. Smart capital is moving US dollars into commodity-rich emerging markets. Regions like Latin America are rich in oil and resources, the exact commodities currently trending higher.
He's also buying Apple. Apparently he and Tim Apple are still good friends, and they're reportedly in China together right now.
Other major purchases include Costco, Motorola Solutions, Uber, Synopsis, Fidelity, and Texas Instruments.
Motorola Solutions is an interesting target. It stands out from the rest of the buys, and it's not entirely clear what his team sees in it.
Get an entire year of live weekly mentoring sessions, my newsletter, indicators, bonus reports, tons more. Click the link and I'll see you in the next live session.
Join my Black Ops Trading ClubIs Trump's Portfolio Betting on a Commodity Super Cycle?
One of the largest allocations in the entire portfolio went to the GSCI Commodity ETF, a big basket that holds all kinds of trending commodities.
This purchase sends a very clear signal. Either President Trump or the professionals managing his money share a specific economic forecast.
We are in a commodity super cycle.
The most recent inflation numbers are getting worse. Prices will rise, and we are entering stagflation. This isn't about spreading fear. It ties directly into the thesis behind this massive commodity purchase. This trump stock portfolio disclosure reinforces the idea that serious capital is positioning for rising commodity prices.
The Biggest Sales
To fund hundreds of millions in purchases, you have to sell. The negative numbers at the bottom of the ledger reveal exactly what his team wanted to dump.
The biggest net sale: the Vanguard Dividend Appreciation ETF.
They dumped $15 million of this asset. Makes perfect sense. Dividends are nothing when the market's rising. He clearly wanted to pull that capital out of dividends and put it to work in the market.
Other major sales included Meta, Microsoft, Amazon, a High Dividend Yield ETF, United Health, Palantir, PNG, Netflix, Accenture, Capital One, and Palo Alto Networks.
He sold off Netflix. Frankly, I'm surprised he owned that one at all.
Sector Breakdown
On an asset-by-asset basis, the largest overall exposures still involve the mega-cap tech names: Microsoft, Amazon, Nvidia, Apple, Alphabet, and Meta. Not surprising.
But outside of mega-cap tech, the capital flowed into very specific sectors.
ETFs and Broad Market Exposure
The portfolio shows heavy reliance on funds to capture broad market moves. Beyond the emerging markets and GSCI commodity funds, he allocated into the Russell 1000, gold, international treasuries, and various Vanguard and State Street index funds.
Semiconductors
The chip sector saw major buying pressure. The portfolio added positions in Broadcom, AMD, and Lam Research.
Software
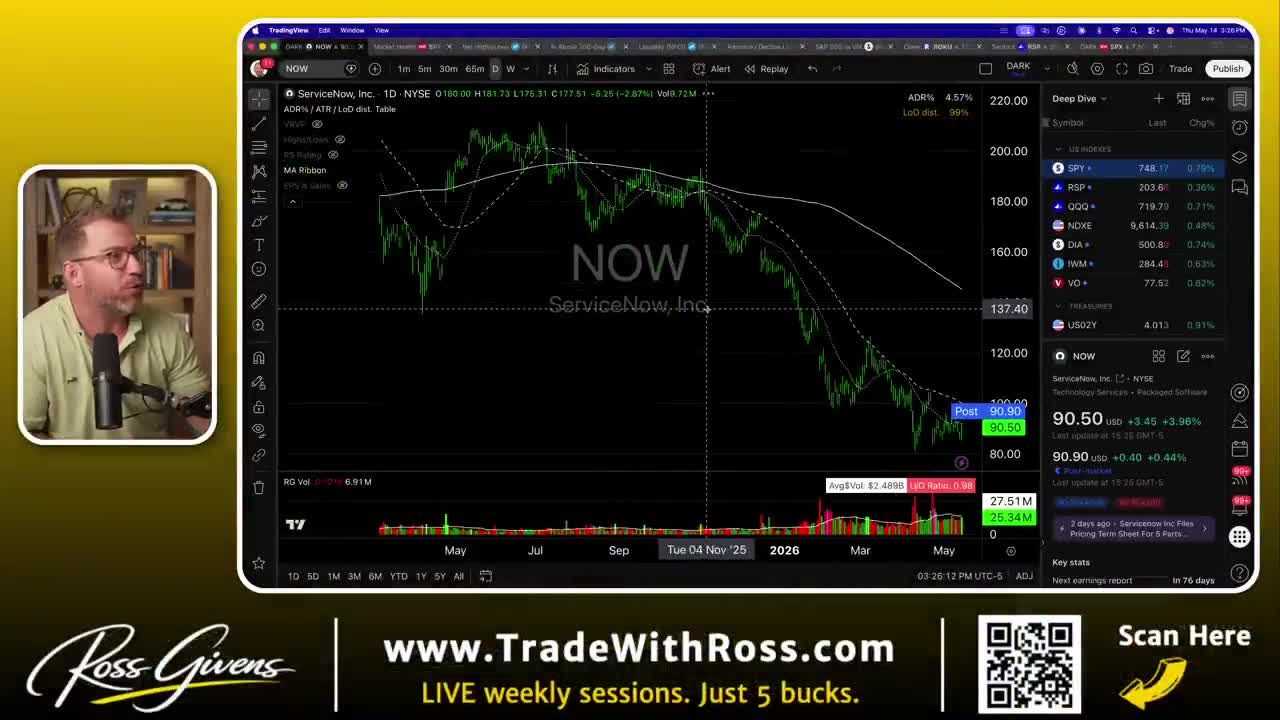
Software stocks have sold off in a really big way recently. This makes it a risky move, but the portfolio shows distinct buying here. ServiceNow is a major standout. The CEO of Nvidia has been talking about this company potentially doing 10x or 100x. It is very cheap compared to its historic valuation.
Industrials and Consumer Brands
The industrial buys focus on legacy defense and manufacturing: Boeing, Eaton, Trane, and Lockheed. On the consumer side, the capital went into really American brands like Costco, PNG, and Starbucks.
Fintech
The portfolio added exposure to Visa and Mastercard. Though I wouldn't really call these fintech. They're legacy payment processing, not new fintech.
How to Find These Trades Yourself
This trump stock portfolio disclosure is entirely public. You can verify every number yourself.
The U.S. Office of Government Ethics maintains a public database for all public servants. When you search for the president, the system provides a PDF. It's a paper document that lists every single transaction, and you can export it for your own analysis.
Following the Money
His team deployed up to $470 million in net buying during a single quarter. They dumped slow-moving dividend funds and put that capital to work in emerging markets, hard commodities, and oversold software stocks.
They are positioning for a commodity super cycle. The latest trump stock portfolio disclosure makes that thesis hard to ignore.
I'm not saying he's the greatest stock trader ever. I'm not even saying he personally made these trades. But this is his money. The leader of the free world is making massive financial moves, and his actions have immense consequences in the equity market.
Watch the commodities. Watch the emerging markets. The smart money is already there.
Get an entire year of live weekly mentoring sessions, my newsletter, indicators, bonus reports, tons more. Click the link and I'll see you in the next live session.
Key Takeaways
- Trump's Q1 2025 periodic transaction report logged 3,422 individual trades, with net buying estimated between $280 million and $470 million in a single quarter.
- The filing is a physical paper document housed at the White House and submitted to the U.S. Office of Government Ethics, the same mandatory disclosure system used by members of Congress.
- The heaviest buying was concentrated in commodities and emerging markets, while dividend-focused funds were sold off, signaling a deliberate rotation rather than random activity.
- The portfolio positioning aligns with a commodity super cycle thesis, meaning the trades reflect a macro bet on hard assets outperforming over a multi-year horizon.
- Because these are managed accounts, the trades reflect professional institutional decision-making tied to Trump's capital, not retail-level speculation.
DISCLAIMER: Traders Agency does not offer financial advice. The information provided is for educational purposes only and should not be considered financial advice. Traders Agency is not responsible for any financial losses or consequences resulting from the use of the information provided. Trading carries inherent risks and may not be suitable for all individuals. You are advised to conduct your own research and seek personalized advice before making any investment decisions, recognizing the potential risks and rewards involved.
See more from Traders Agency on Google
Make us a preferred source and our market analysis will appear more prominently in your Google Search, Top Stories, and AI results.
Add to Preferred Sources