
A swing trading screener is a filtering tool that scans thousands of stocks against specific technical and fundamental criteria to surface a short list of candidates worth watching for multi-day to multi-week trades. Instead of manually checking charts one by one, you set your rules once (price, volume, trend, pattern) and let the screener do the sorting. We build and rebuild these screens constantly on our own desks, and this guide walks through exactly how we do it, platform by platform, criteria by criteria.
By the end of this article, you'll know how to set up a swing trading screener on three different platforms, which seven criteria actually matter, and how to automate the whole process so you're not starting from scratch every morning. We'll also cover the mistakes that quietly wreck most homemade screens.
What Do Swing Traders Need in a Stock Screener?
Bottom Line: A swing trading screener only pays off when it's built around a handful of criteria that match a multi-day to multi-week holding period, not day trading or long-term investing filters. The real work is in setting it up once, automating it, and revisiting the thresholds regularly so it keeps surfacing useful setups as market conditions change.
A good swing trading screener needs to balance three things: a wide enough net to find opportunities, tight enough filters to avoid noise, and enough speed that setups which look perfect today don't disappear by tomorrow's open.
Swing trading sits between day trading and long-term investing. You're typically holding positions for 2 to 10 trading days, sometimes a few weeks, looking to capture a meaningful chunk of a price move without staring at a screen all day. That means your screener criteria need to reflect a different time horizon than a day trader's 1-minute volume scanner or a long-term investor's P/E ratio screen.
Here's what we actually prioritize when building one:
- Liquidity so you can get in and out without slippage eating your edge
- Price range that matches your account size and risk tolerance
- Trend direction confirmed by a moving average, not just a gut feeling
- Momentum showing the stock is already moving, not just sitting there
- Relative volume confirming real interest, not a random blip
- Volatility wide enough to be worth the trade, not so wild it blows through stops
- Pattern confirmation like a breakout, pullback, or consolidation setup
A screener that nails these seven factors will typically take a universe of 5,000+ stocks down to a workable watchlist of 30 to 50 names on any given day.
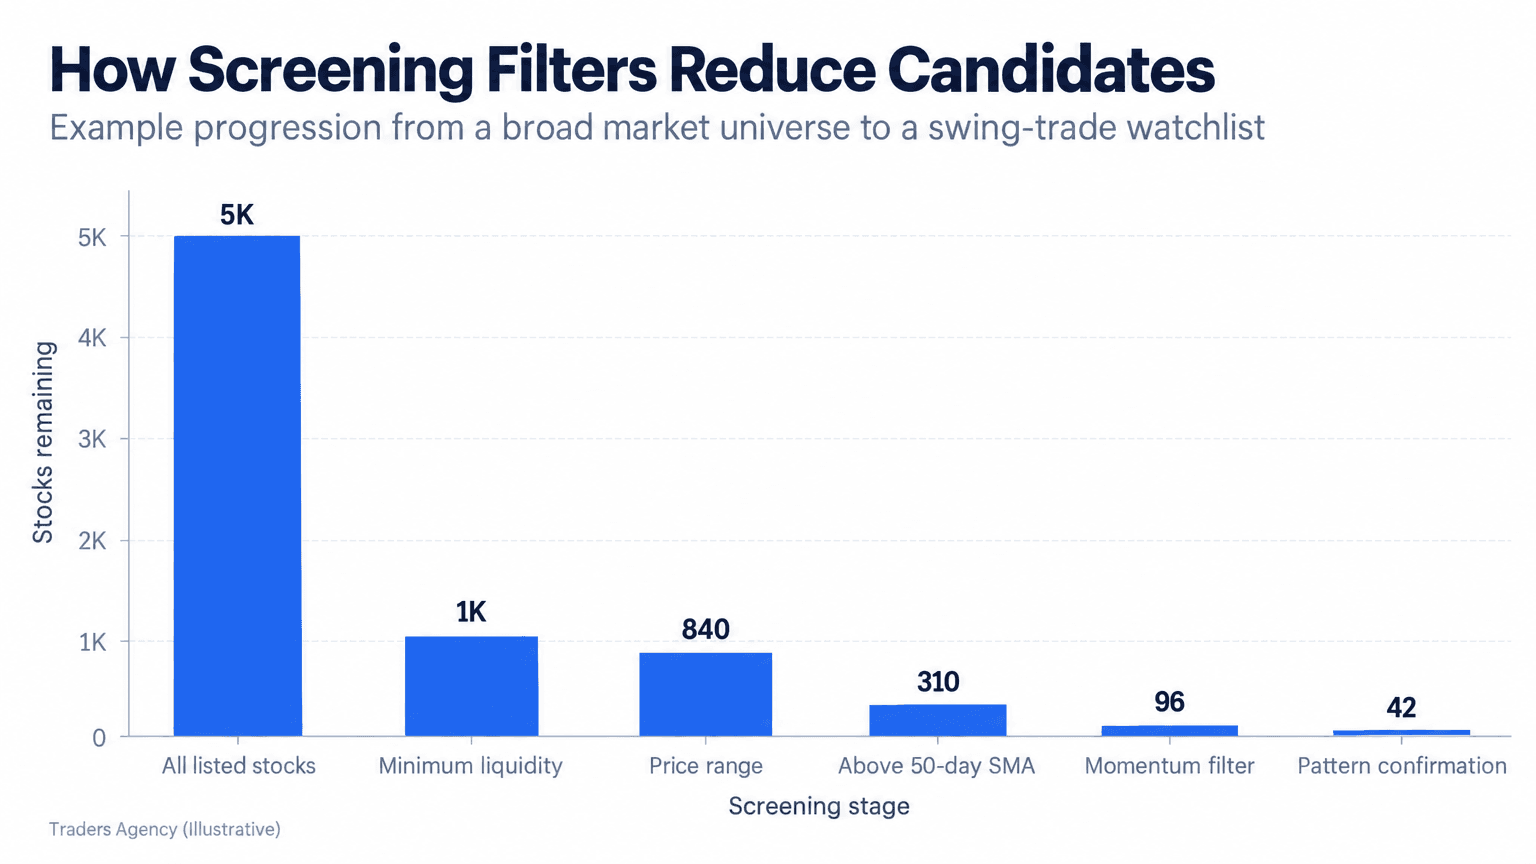
That reduction is the entire point. You're not trying to find every possible trade. You're trying to find the handful worth your attention today.
Key Concept: A screener isn't about finding more stocks to watch, it's about cutting a huge universe down to a short, manageable list you can actually act on before the setup disappears.
How Do You Set Up a Screener for Swing Trading?
Setting up a swing trading screener means choosing a platform, defining your filter criteria (price, volume, trend, pattern), and saving the scan so it can run automatically each trading day. The exact steps differ slightly across platforms, but the filter logic stays the same.
We'll walk through three platforms our members use most often: TradingView, Finviz, and TC2000. Each has strengths, and a lot of traders end up using one for free daily scans and another for deeper backtesting.
Setting Up a Swing Trading Screener on TradingView
TradingView's screener is popular because it's browser-based, visual, and integrates directly with charting.
- Open the Stock Screener tab from the main TradingView menu
- Click Filters and remove any default criteria you don't need
- Add core filters for Market Cap (we usually start above $300M to avoid illiquid micro caps), Average Volume (above 500,000 shares), and Price (set a floor and ceiling matching your risk per trade)
- Add a technical filter for price relative to the 50-day and 200-day moving averages
- Save the screen using the Save As button and name it something specific, like "Swing Breakout Scan"
Setting Up a Swing Trading Screener on Finviz
Finviz remains one of the most popular choices for a free swing trading screener, and the interface is fast once you know where to click.
- Go to the Screener tab and select All filters
- Under Descriptive, set Average Volume to "Over 500K" and Price to your preferred range
- Under Technical, set 50-Day Simple Moving Average to "Price above SMA50"
- Add Relative Volume of "Over 2" to catch stocks with unusual interest
- Click Save Screen (available on paid tiers) or bookmark the URL, which carries your filter settings
Setting Up a Swing Trading Screener on TC2000
TC2000 is the choice for traders who want deeper historical scanning and backtesting alongside their screens.
- Open EasyScan from the main toolbar
- Build conditions using the plain-language formula builder: "Close is above Average(Close, 50)" handles your trend filter
- Add a volume condition like "Volume is above Average(Volume, 50) * 2" for your relative volume filter
- Save the scan and assign it to a watchlist that auto-updates
No matter which platform you choose, the goal is the same: turn a vague idea ("stocks in an uptrend with rising volume") into a precise, repeatable rule set.
The 7 Best Swing Trading Screener Criteria
The best swing trading screener settings combine liquidity, trend, momentum, volume, volatility, price range, and pattern confirmation into one filtered scan, rather than relying on any single indicator alone.
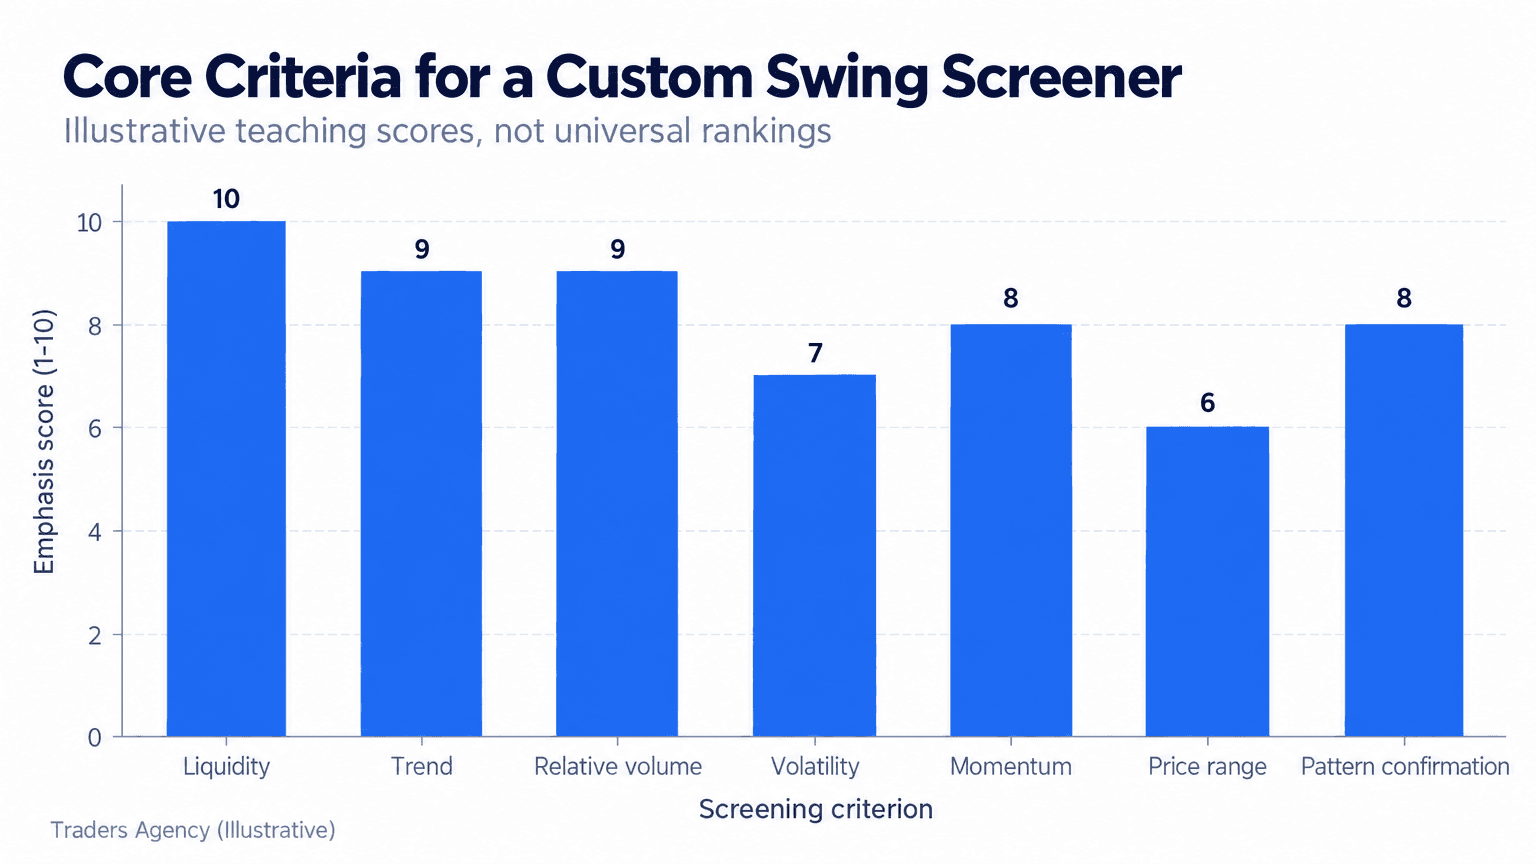
Here's how we define and set each one in practice:
- Liquidity: minimum average daily volume of 500,000 shares, so a position of a few hundred shares doesn't move the price
- Price range: typically $10 to $200 per share, wide enough for meaningful dollar moves but not so expensive it limits position sizing
- Trend: price trading above the 50-day simple moving average, with the moving average itself sloping upward
- Momentum: a Relative Strength Index (RSI) reading between 50 and 70, showing strength without flashing extreme overbought
- Relative volume: current volume at least 1.5x to 2x the 50-day average, a strong sign of fresh interest
- Volatility: Average True Range (ATR) of at least 2% of share price, giving the trade room to actually move
- Pattern confirmation: a recognizable setup like a flag, cup-and-handle, or breakout above resistance on the daily chart
These seven filters are the backbone of nearly every swing trading strategy we teach, whether the specific setup is a breakout, a pullback, or a gap continuation.
Want expert trading insights delivered daily?
Join thousands of traders who rely on Traders Agency for market analysis and trade ideas.
Join Traders AgencyPrice Above the 50-Day SMA
Price trading above the 50-day simple moving average (SMA) is one of the simplest and most widely used trend filters available, and it's a standard first condition in almost any swing trading screener.
Here's a concrete walkthrough. Say a stock is trading at $48.50, and its 50-day SMA sits at $44.20. The price has been above that moving average for 12 consecutive sessions, and the SMA itself has been sloping gently upward over that same period. That combination, price above a rising average, tells you the stock is in an established uptrend rather than just popping above the line for a day or two.
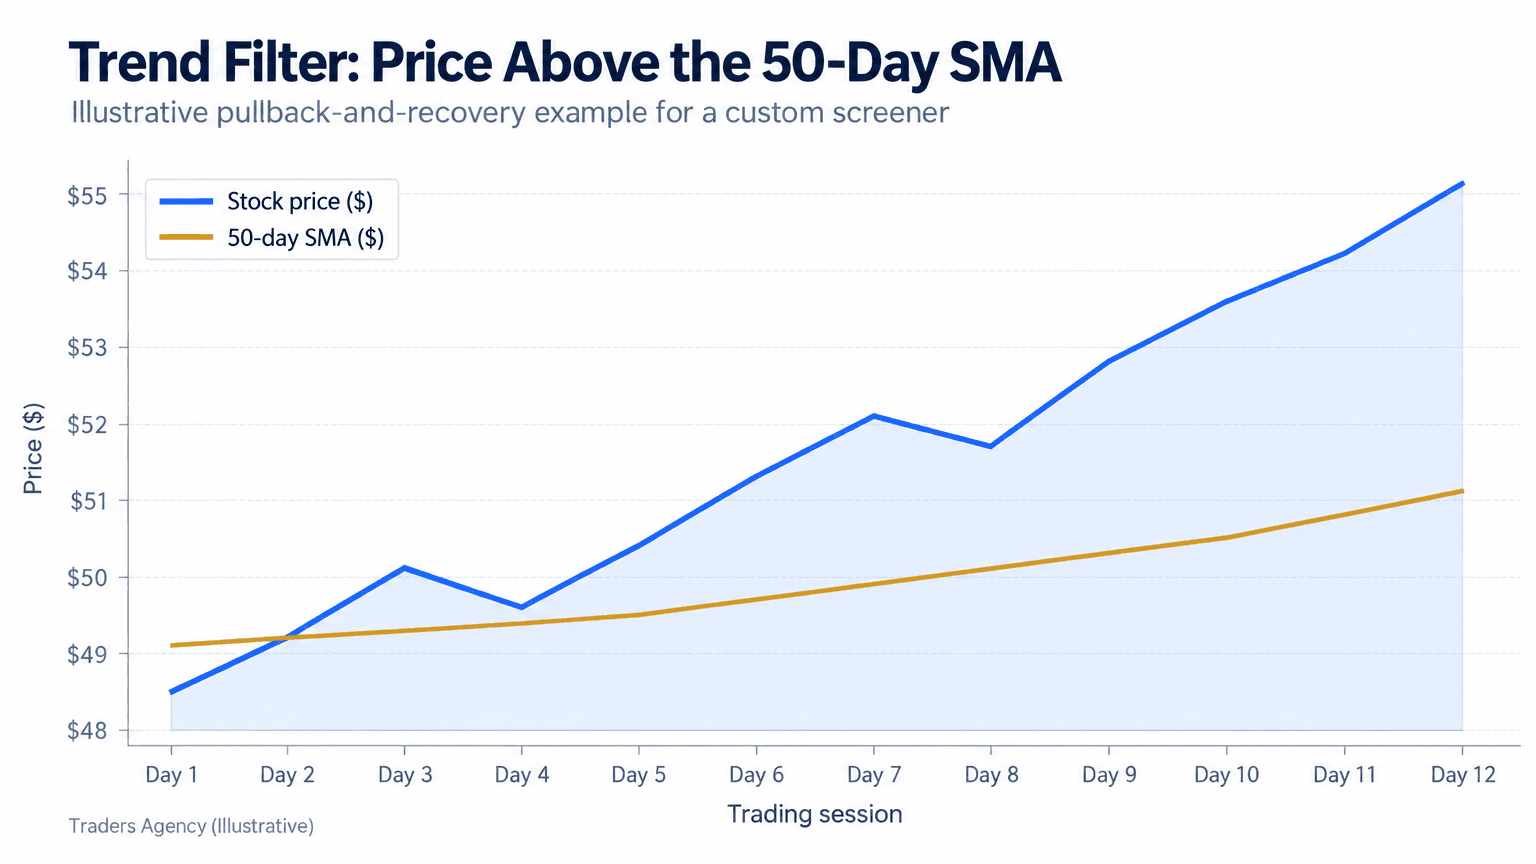
In your screener, this filter reads as "Close > SMA(50)" and should be paired with a second condition requiring the SMA's current value to be higher than its value 10 days ago, confirming the slope is actually rising and not flat or falling.
Why Relative Volume Confirms the Setup
A price breaking above resistance on light volume is a weak signal. The same breakout on heavy volume tells a completely different story.
Say that same stock, after holding above its 50-day SMA, breaks through a $49.80 resistance level on a day where volume reaches 2.8 times its 50-day average. That surge in relative volume is what separates a real breakout from a random wiggle that fails within a day or two.
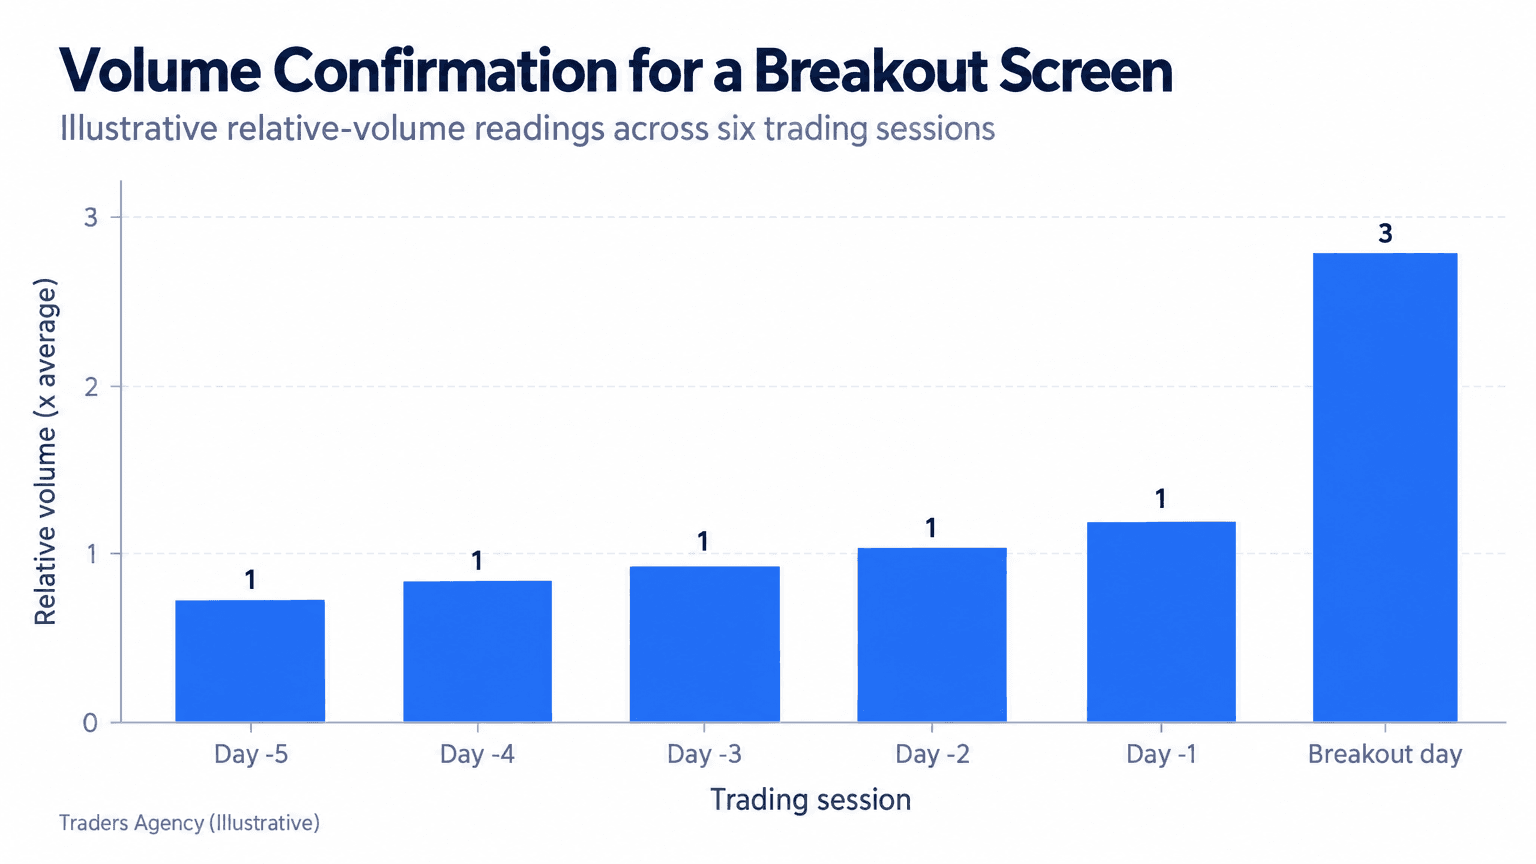
We treat relative volume above 2x the average as a meaningful confirmation threshold. Below that, we tend to flag the setup as "watch" rather than "trade ready."
Key Concept: Trend tells you the stock is moving in the right direction. Relative volume tells you whether real money is behind the move. You generally want both before you commit capital.
Saving and Scheduling Your Swing Trading Screens
Building a screen once is only half the job. The real value of a swing trading screener comes from running it automatically, every trading day, without rebuilding filters from memory.
How to Save Your Screen
On TradingView, use the Save As function and name your screens by setup type: "Breakout Scan," "Pullback to SMA20," "Gap and Go." On Finviz, paid accounts can save screens directly, while free users can bookmark the filtered URL, since Finviz encodes your filter settings into the web address itself. On TC2000, saved EasyScans can be attached to a dynamic watchlist that refreshes automatically as new stocks qualify.
How to Schedule Recurring Scans
Most swing traders check their screens at two points: after the market closes (to plan tomorrow's trades) and before the open (to confirm nothing has changed overnight).
- Run your end-of-day scan by setting a recurring reminder for 15 minutes after close
- Review the resulting list against your 7 criteria and discard anything that doesn't meet all of them
- Re-run a quick premarket check around 8:30 AM using the same saved screen, watching for gap news that invalidates a setup
- Keep a simple log (a spreadsheet is fine) tracking which screen produced which trades, so you know which setups are actually working over time
TC2000 and some TradingView plans support alert-based scanning, where you get notified the moment a stock newly matches your filter criteria, which cuts down on manual checking significantly.
Template Screens for Common Setups
Three ready-to-use templates we rely on:
| Template | Core Filter Conditions |
|---|---|
| Breakout | Price above 50-day SMA, relative volume over 2x, price breaking a 20-day high, ATR above 2% of price |
| Pullback | Price above 50-day SMA but within 3% of the 20-day SMA, RSI between 40 and 55, volume below average (quiet retracement) |
| Gap-and-Go | Pre-market gap above 2%, relative volume over 3x at the open, price above prior day's high |
Common Screener Mistakes and How to Avoid Them
Even a well-built screener can lead you astray if you're not watching for these issues.
- Over-filtering: Stacking 15 conditions on top of each other often returns zero results. Start with your 7 core criteria and add more only if you're drowning in candidates.
- Ignoring liquidity: A stock that looks perfect on every technical filter is worthless if you can't exit the position without slippage.
- Static screens in changing markets: A screen tuned for a trending bull market may return almost nothing in a choppy, sideways tape. Revisit your RSI and ATR thresholds when market conditions shift.
- Treating the screener as the whole strategy: A swing trading screener finds candidates. It doesn't replace your own chart review, risk management, or entry timing.
- Chasing every result: Just because a stock appears on your list doesn't mean it's tradeable today. Confirm with price action before entering.
Watch Out: We see this pattern constantly: traders build increasingly complex screens, then wonder why the results dry up. Simpler, well-maintained filters tend to outperform overengineered ones.
How to Set a Screener for Swing Trading
Setting a screener for swing trading means defining liquidity, price, trend, momentum, and volume thresholds that match your personal risk tolerance and holding period, then saving those filters as a reusable, named scan on your chosen platform.
Start with the baseline settings we outlined: a 500,000 share minimum volume, price above the 50-day SMA, relative volume above 1.5x, and RSI between 50 and 70. From there, adjust the price range and ATR threshold to fit your account size. A trader with a $5,000 account might cap price at $50 per share to maintain reasonable position sizes, while a trader with a $50,000 account can comfortably screen stocks up to $200 or higher.
What Is the Best Tool for Swing Trading?
There's no single best swing trading screener for every trader. The right tool depends on your budget, whether you want free access, and how deep you need to go into backtesting and automation.
For traders starting out, Finviz's free tier covers the core technical and volume filters well. For those wanting chart integration and alert-based scanning, TradingView's paid plans add significant value. For traders who want to backtest a screen's historical performance before risking capital, TC2000 is worth the subscription cost. Mobile apps, available through both TradingView and TC2000, let you check your saved scans from anywhere, which matters if you're running that premarket check away from your desk.
When Should You Use a Swing Trading Screener (And When Shouldn't You)?
A swing trading screener works best in markets with clear trending behavior, where price and volume filters can reliably separate strong candidates from noise.
It's less useful during extremely choppy, low-volume periods like the days around major holidays, when relative volume thresholds become unreliable and trend filters whipsaw. During earnings season, we also recommend adding an earnings-date filter to avoid getting screened into a stock the night before it reports, since that introduces a different kind of risk than a technical swing setup.
Risk Management Alongside Your Screener
A screener finds opportunities, but it doesn't manage your risk. Pair every screen result with:
- A defined risk per trade of no more than 1-2% of your account, which is what determines your position size
- A hard stop loss placed below the recent swing low or a fixed percentage, typically 5-8% below entry
- A pre-defined profit target or trailing stop, so you're not deciding exit points emotionally mid-trade
Combine your screener with a broader swing trading strategy that includes a trading plan, a watchlist review process, and consistent position sizing. The screener narrows the universe. Your plan decides what to actually do with the names it surfaces.
Frequently Asked Questions
Which stocks are the best for swing trading on a screener?
The best candidates are liquid stocks (500,000+ average daily volume) trading above a rising 50-day SMA, showing relative volume above 1.5x average, with RSI between 50 and 70 and a clear chart pattern like a breakout or pullback.
How much total capital would I need to make $1,000 a month swing trading?
This depends heavily on win rate, position sizing, and risk per trade, and there's no fixed number that applies to everyone. Traders generally need enough capital to size positions so that risk per trade stays near 1-2% of the account while still taking multiple setups per month, which in practice often means accounts in the five figures, though results vary widely and are never guaranteed.
How do I set a screener for swing trading?
Define filters for liquidity, price range, trend (price above the 50-day SMA), momentum (RSI 50-70), and relative volume (above 1.5x average), then save the scan on your platform so it runs automatically.
What is the best tool for swing trading?
There's no universal answer. Finviz works well for free basic screening, TradingView adds chart integration and alerts, and TC2000 offers deeper backtesting for traders willing to pay for it.
Can I build a swing trading screener for free?
Yes. Finviz and TradingView both offer free tiers with enough filtering power to build the 7 core criteria we cover in this guide.
How often should I update my screener settings?
Review your thresholds at least monthly, and more often if overall market volatility shifts significantly, since static settings can stop producing useful results in a changed market.
Want expert trading insights delivered daily?
Join thousands of traders who rely on Traders Agency for market analysis and trade ideas.
Join Traders AgencyDISCLAIMER: Traders Agency does not offer financial advice. The information provided is for educational purposes only and should not be considered financial advice. Traders Agency is not responsible for any financial losses or consequences resulting from the use of the information provided. Trading carries inherent risks and may not be suitable for all individuals. You are advised to conduct your own research and seek personalized advice before making any investment decisions, recognizing the potential risks and rewards involved.
See more from Traders Agency on Google
Make us a preferred source and our market analysis will appear more prominently in your Google Search, Top Stories, and AI results.
Add to Preferred Sources