Hey friend,
Consumer prices rose 0.4% in October, above the 0.3% economists expected.
Core inflation, which leaves out food and energy, came in at 0.3% for the month versus 0.2% expected.
Core prices have now risen 0.3% three months in a row, strengthening the case for a December rate hike.
The Daily Direction
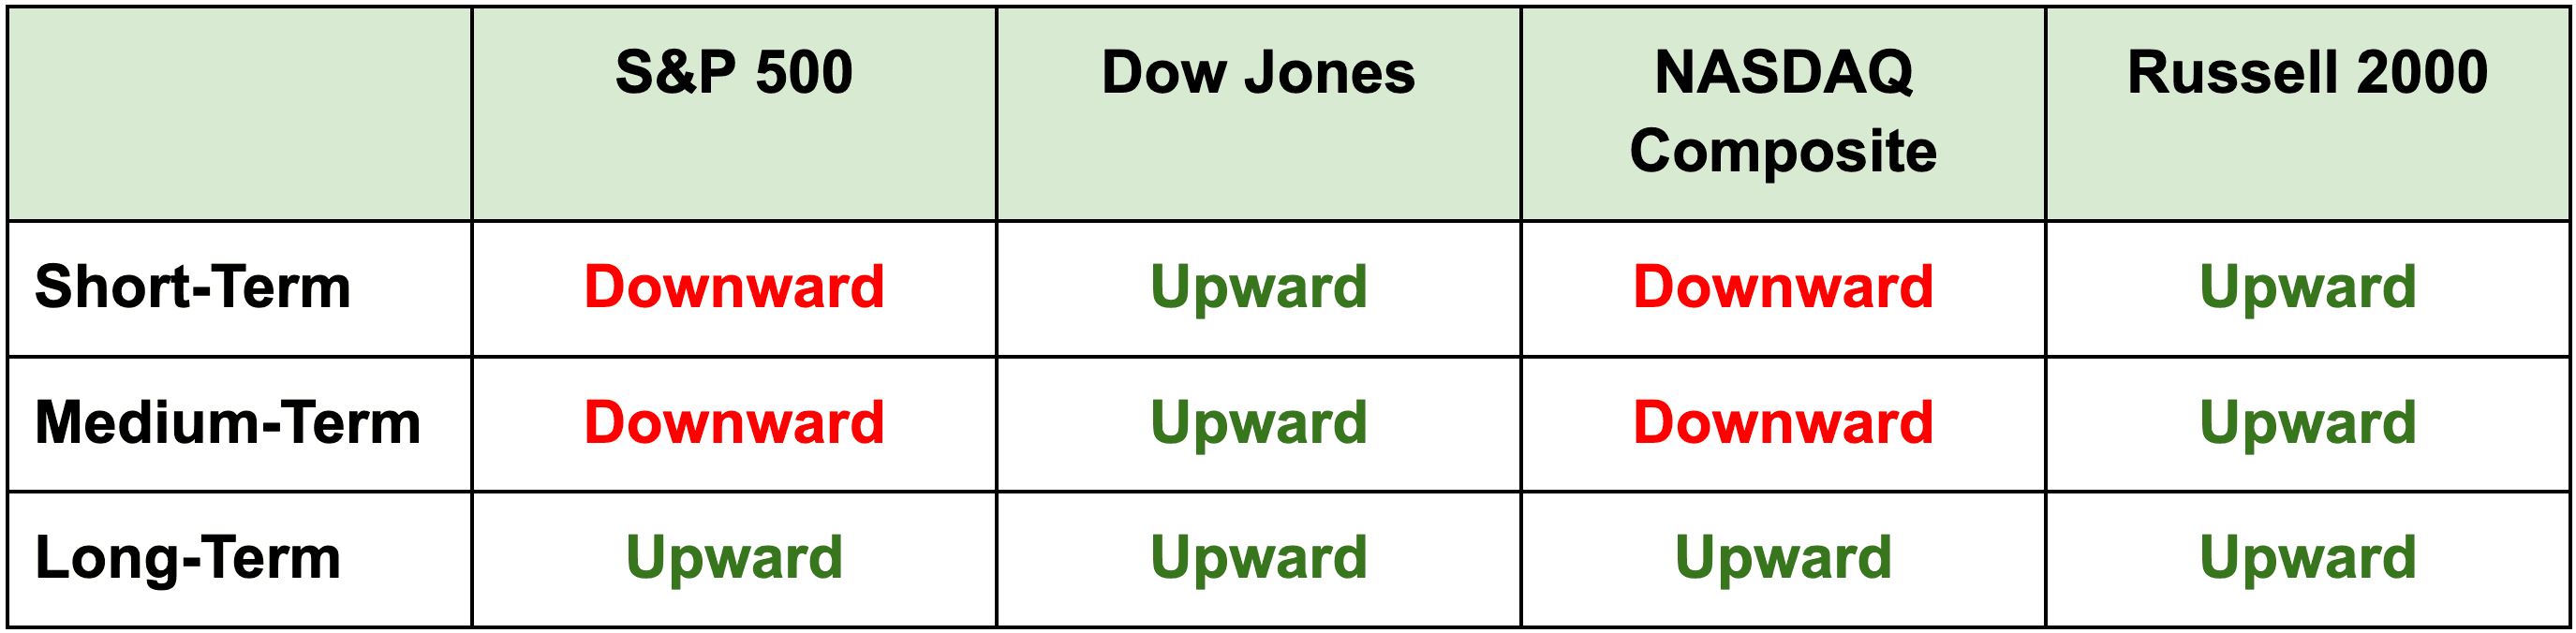
Note: Stocks resumed their bounce yesterday, with the Dow Jones and the Russell reclaiming all their positive index directions – while the Nasdaq saw its long-term direction move back upward.
The Daily Nugget
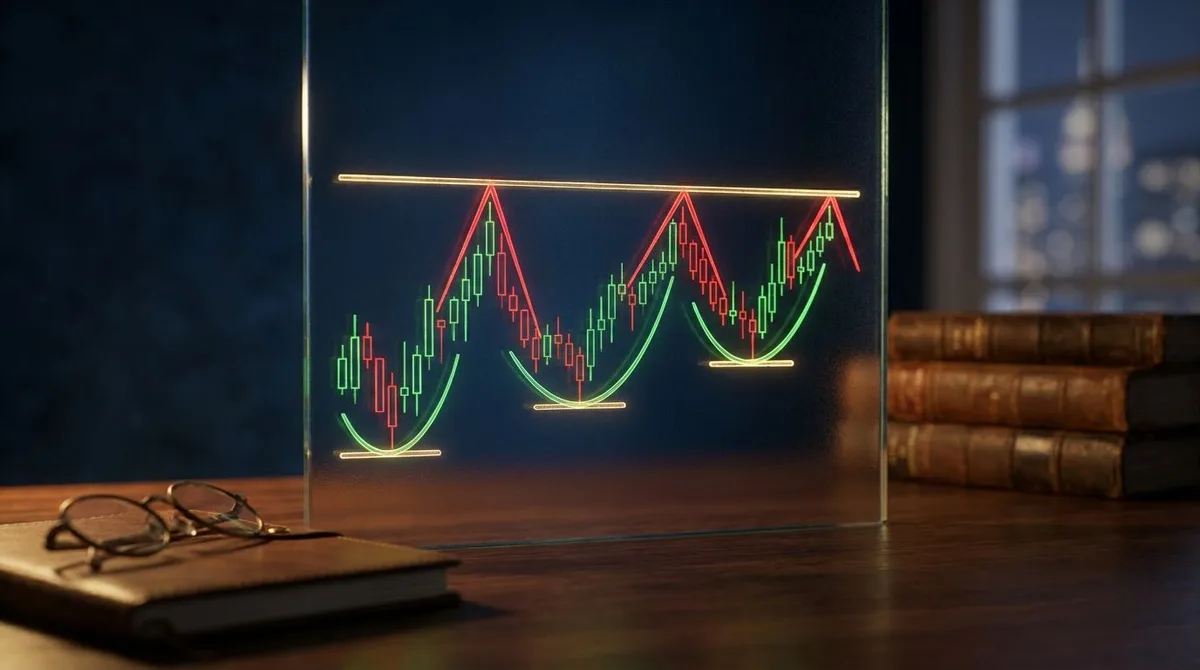
Watch what happens each time sellers show up.
You can spot buyers getting stronger even when the stock looks like it’s going nowhere.
Say a stock has hit $50 three times this month. Every time, sellers knock it back down.
It’s tempting to write it off. Why watch a stock that can’t get past the same price?
Take a look at where the selling stopped.
The first time, the stock fell to $42 before buyers stepped in.
The next time, they were willing to pay $46. On the third try, it barely dipped to $49.
Anyone waiting to buy at $42 again hasn’t had a chance.
Other buyers keep getting there first, and they’re willing to pay more each time.
That doesn’t mean $50 will give way.
But if all you wrote down was “failed at $50 again,” you missed what changed.
Next time a stock keeps hitting the same ceiling, take your eyes off the highs for a minute.
Look at the lows.
The Traders Agency Team
See more from Traders Agency on Google
Make us a preferred source and our market analysis will appear more prominently in your Google Search, Top Stories, and AI results.
Add to Preferred Sources