
Earnings per share explained simply: it's a company's profit divided by how many shares of stock exist, giving you profit on a per-share basis. If you've ever looked at a stock quote and seen "EPS: $2.45" and wondered what that actually means for your trade, this guide is for you. By the end, you'll know how to calculate it, where to find it, and what separates a genuinely strong number from a misleading one.
We teach earnings per share as one of the first metrics every new investor should learn, because almost every other valuation tool builds on it. Once you understand this one number, ratios like P/E start making a lot more sense.
What Is Earnings Per Share (EPS)?
Bottom Line: EPS turns raw profit into a comparable, per-share number, but it only tells part of the story. A rising EPS looks good on the surface, yet buybacks, one-time gains, and diluted share counts can distort it, so the number is most useful alongside other metrics, not on its own.
Earnings per share (EPS) is a company's net income divided by its total number of outstanding shares. It tells you how much profit is attributed to each individual share you own.
Think of it like splitting a pizza. If a company earns $10 million in net income and there are 5 million shares outstanding, each share gets a theoretical slice worth $2.00. That's your EPS.
This matters because stock prices alone tell you nothing. A $300 stock isn't automatically "expensive" and a $10 stock isn't automatically "cheap." EPS gives you a profit yardstick that lets you compare a $300 company against a $10 company on equal footing.
Key Concept: EPS is a profit yardstick, not a price tag. It lets you compare companies of any size on equal footing.
How Do You Calculate EPS?
The earnings per share formula is straightforward: EPS equals net income minus preferred dividends, divided by weighted average shares outstanding.
The Formula
EPS = (Net Income - Preferred Dividends) / Weighted Average Shares Outstanding
We subtract preferred dividends because that money belongs to preferred shareholders first, not common shareholders. Only what's left over counts toward your EPS.
Earnings Per Share Example
Here's a real calculation, step by step:
| Input | Value |
|---|---|
| Net Income | $50,000,000 |
| Preferred Dividends Paid | $2,000,000 |
| Weighted Average Shares Outstanding | 24,000,000 |
| Resulting EPS | $2.00 per share |
How to Calculate Earnings Per Share From Balance Sheet Data
Here's a common point of confusion: net income comes from the income statement, not the balance sheet. The balance sheet tells you what a company owns and owes at a single point in time. The share count, however, often needs adjusting using balance sheet and equity statement details, since companies issue or buy back shares throughout the year. That's why the formula uses a weighted average rather than just the year-end share count.
Where to Find This Data
You don't need to calculate EPS by hand every time. Here's where we look:
- 10-Q and 10-K filings filed with the SEC list EPS directly on the income statement, both basic and diluted.
- Earnings press releases companies issue each quarter summarize EPS near the top.
- Stock screeners and brokerage platforms display current and historical EPS automatically.
- An earnings per share calculator (widely available on brokerage and financial data sites) can run the math for you if you input net income, preferred dividends, and share count.
Want expert trading insights delivered daily?
Join thousands of traders who rely on Traders Agency for market analysis and trade ideas.
Join Traders AgencyBasic vs Diluted EPS: What's the Difference?
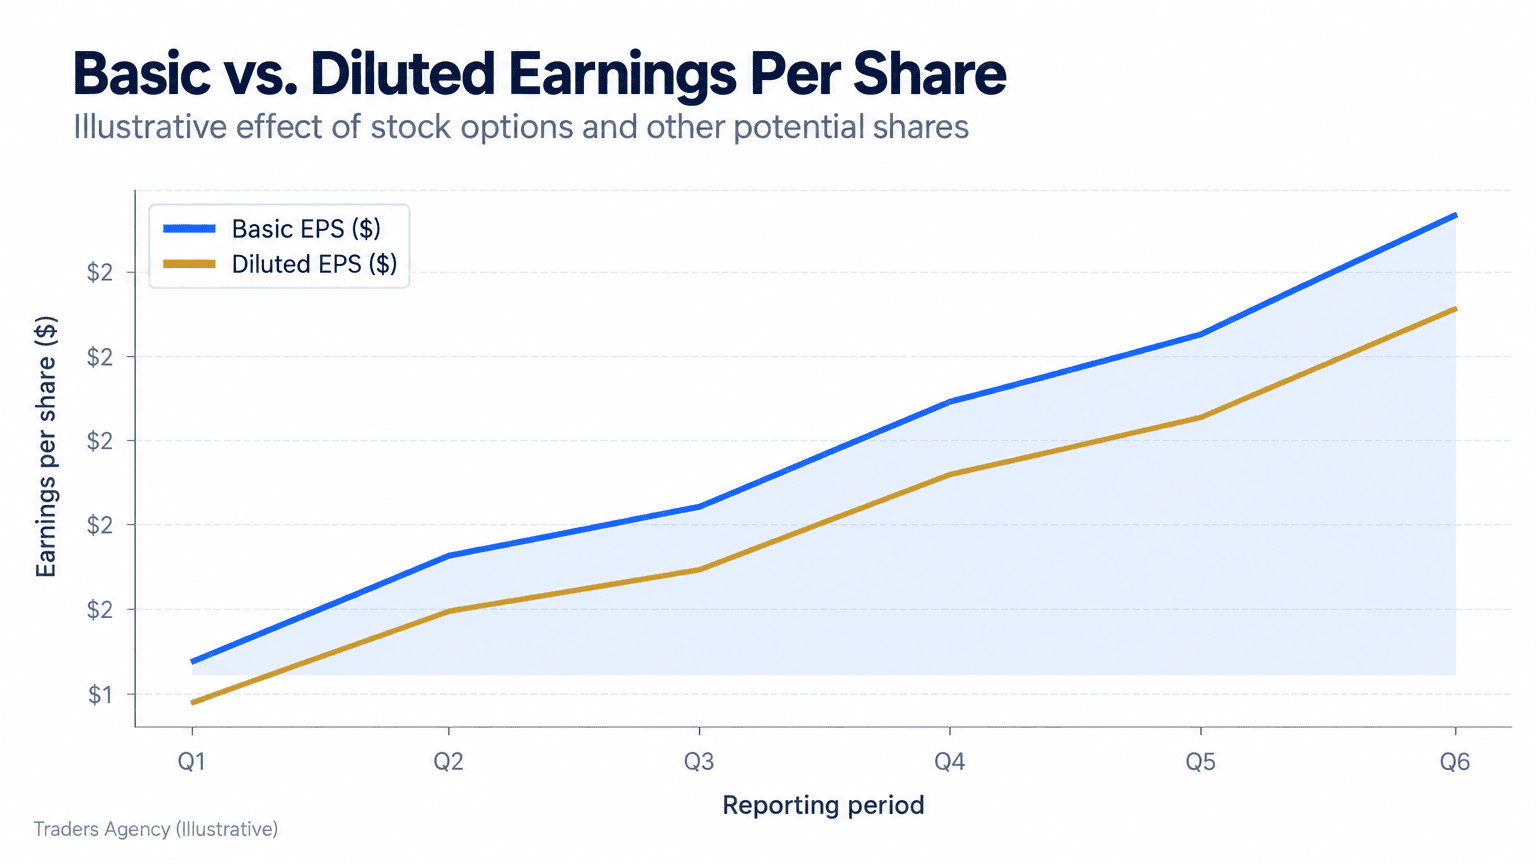
Basic EPS uses only the weighted average shares actually outstanding during the period. Diluted EPS assumes every convertible security, like stock options, warrants, and convertible bonds, gets converted into common shares.
Diluted Earnings Per Share Formula
Diluted EPS = (Net Income - Preferred Dividends) / (Weighted Average Shares + Potential Dilutive Shares)
Because diluted EPS adds more shares to the denominator without adding more profit, it's always equal to or lower than basic EPS. We always check diluted EPS first, since it's the more conservative, realistic number for valuing a company.
What Does EPS Actually Tell You?
EPS tells you how much profit a company generates for each share you hold, letting you track whether that profit is growing or shrinking over time. On its own, it does not tell you whether the stock is a good buy.
We look at EPS in two ways: quarter-over-quarter (comparing this quarter to last quarter) and year-over-year (comparing this quarter to the same quarter last year). Year-over-year is usually more useful because it avoids seasonal noise, like a retailer's huge fourth quarter from holiday shopping.
Analyst Estimates and the Beat/Miss Game
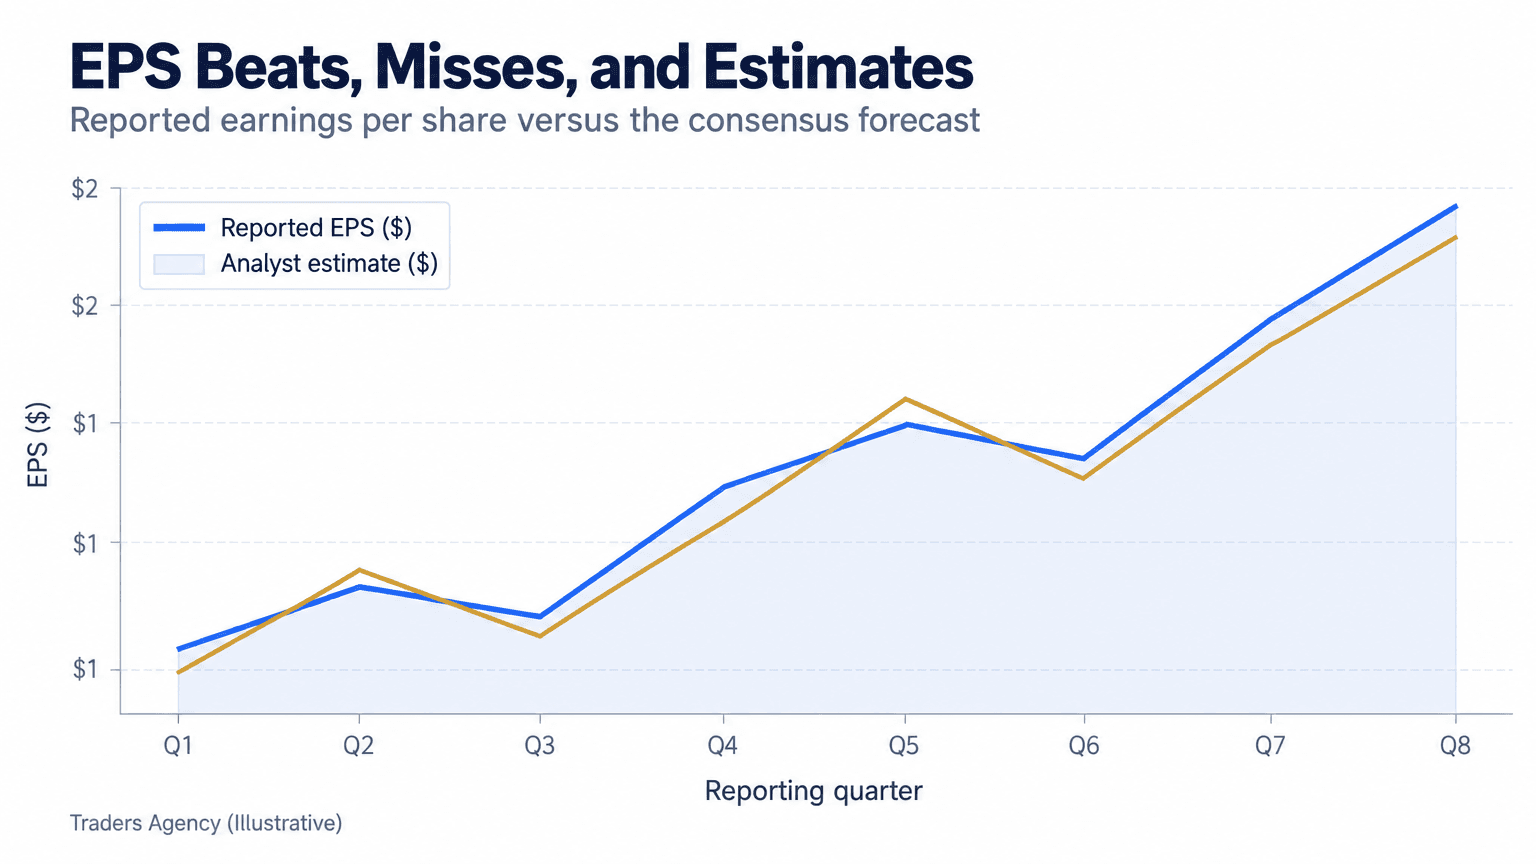
Before a company reports earnings, analysts publish an estimated EPS. When the actual reported number comes in higher, that's called a "beat." When it comes in lower, that's a "miss."
This matters for traders because stocks often move sharply right after earnings, sometimes more on whether the company beat estimates than on the actual EPS number itself. A company can grow EPS and still see its stock drop if it missed what analysts expected.
How Do Stock Buybacks Affect EPS?
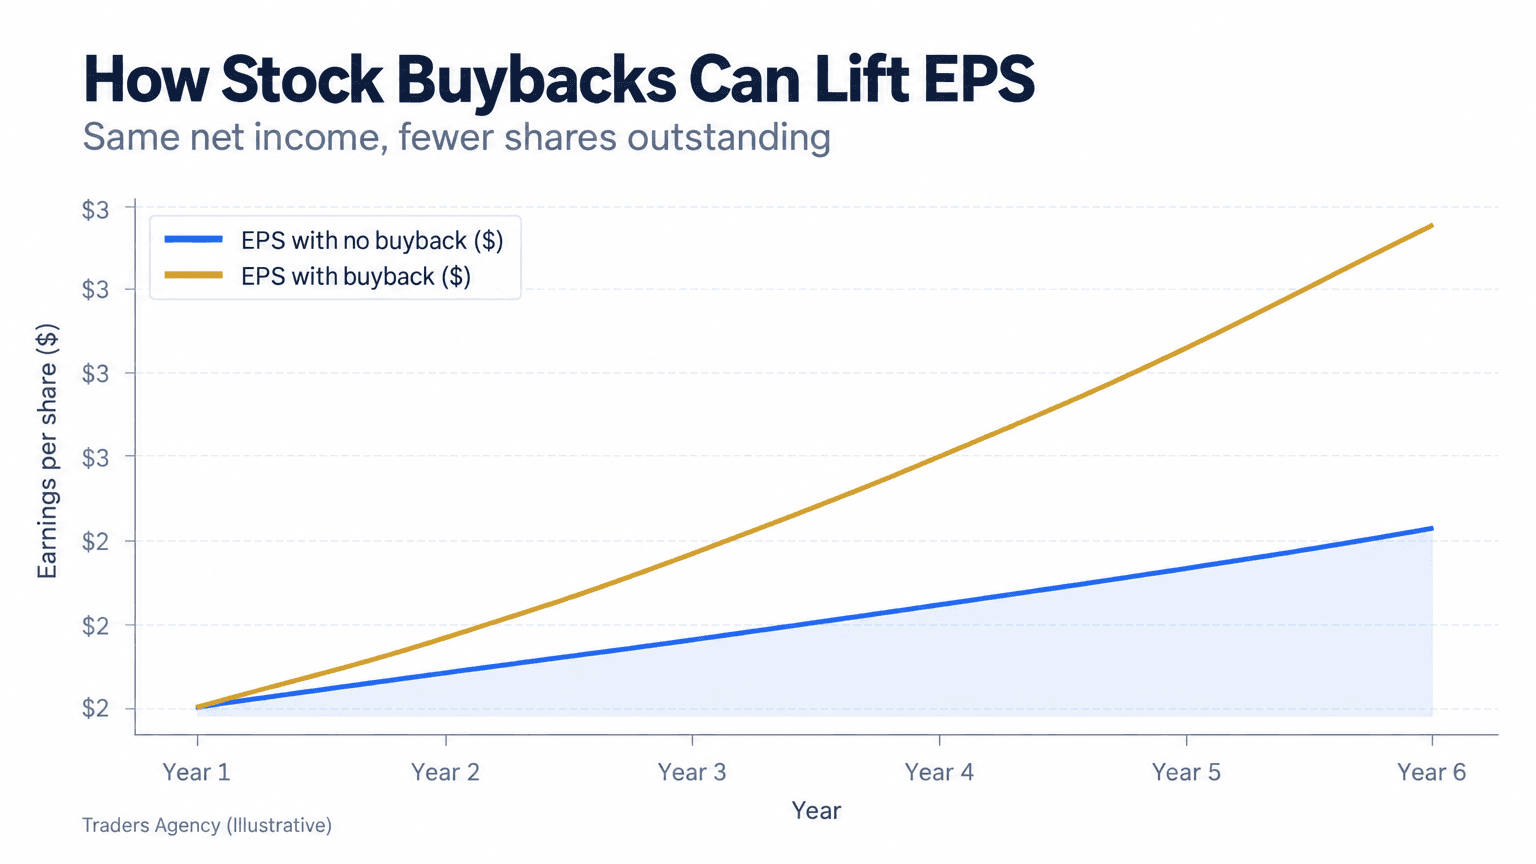
Stock buybacks increase EPS even when net income stays flat, because reducing the number of outstanding shares shrinks the denominator in the EPS formula. This can make earnings growth look stronger than it really is.
Here's a concrete example of how this plays out:
| Scenario | Net Income | Shares Outstanding | EPS |
|---|---|---|---|
| Before Buyback | $100,000,000 | 100,000,000 | $1.00 |
| After Buyback | $100,000,000 | 90,000,000 | $1.11 |
Notice the company didn't become more profitable. It just has fewer slices to divide the same pizza. We always check whether EPS growth is coming from real revenue and profit increases, or just from a shrinking share count.
Watch Out: Rising EPS driven mainly by buybacks can mask flat or weakening underlying business performance. Always check whether revenue and net income are actually growing before crediting EPS gains to a stronger business.
What Is a Good EPS on a Stock?
A "good" EPS depends entirely on the company's size, share count, and industry, so there's no single number that applies across the board. A $500 million company and a $500 billion company can both have an EPS of $3.00, and that tells you nothing about which is the better investment.
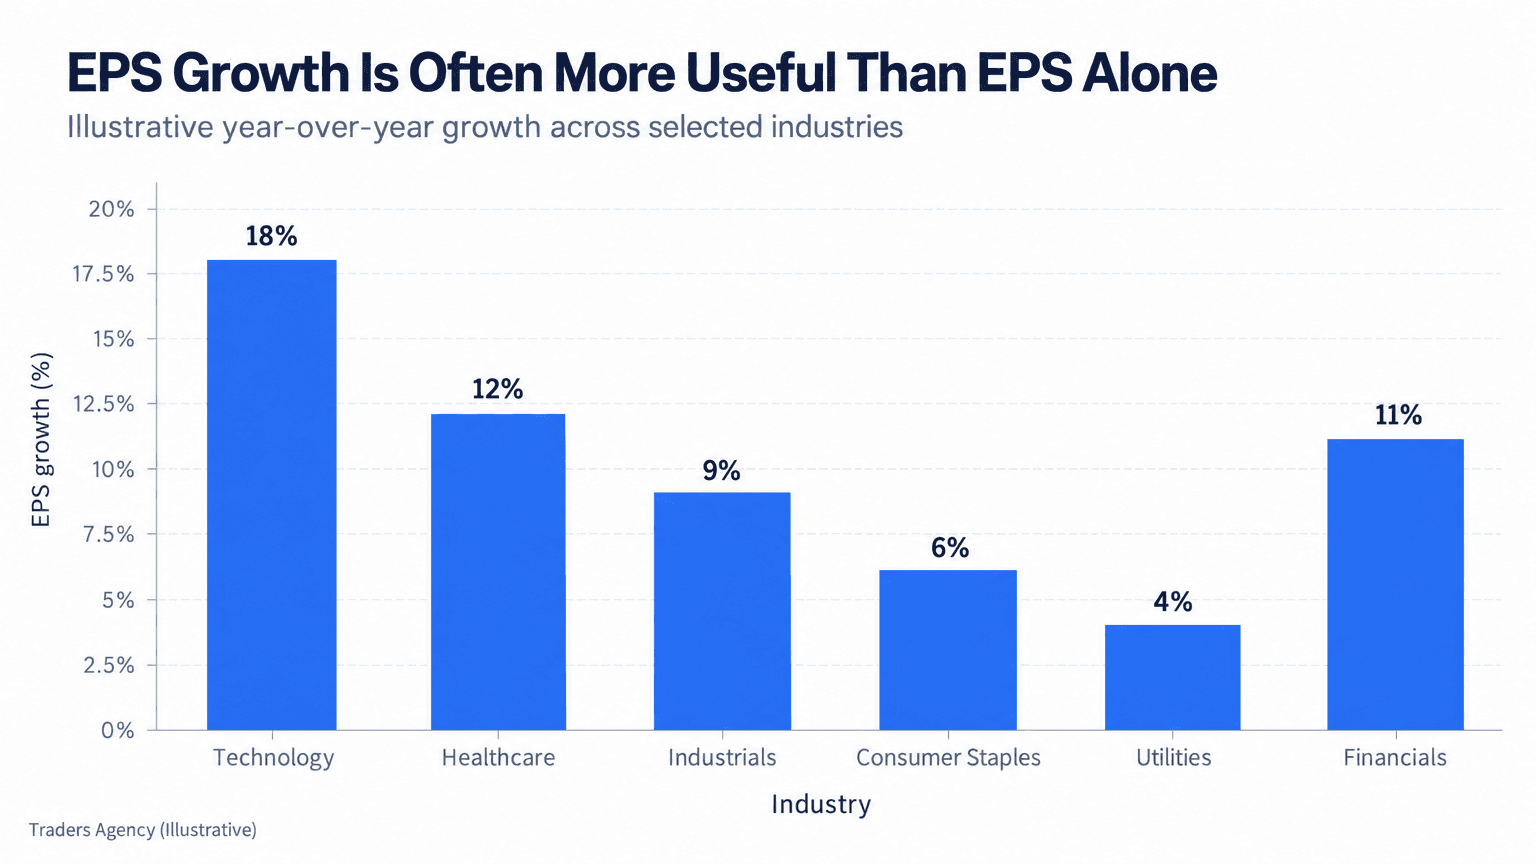
What matters more is EPS growth over time, and how that growth compares to similar companies in the same sector. A software company growing EPS 15% year-over-year might be considered average for its industry, while a utility company growing EPS 4% might be considered strong, since utilities typically grow more slowly.
This is also where EPS connects to another widely used metric: the price-to-earnings (P/E) ratio, calculated by dividing stock price by EPS. A reasonable P/E ratio varies by sector too, but it exists because EPS gives us the "E" to measure price against.
What Are the Limitations of EPS?
EPS is useful, but it has real blind spots that we always flag for newer traders.
- It ignores debt. A company can grow EPS while taking on heavy debt that creates long-term risk.
- It can be manipulated by buybacks, as covered above, inflating the number without real business improvement.
- It says nothing about cash flow. A company can report positive EPS while struggling with cash on hand.
- It doesn't account for one-time items, like a one-off asset sale that temporarily boosts net income.
Because of these gaps, we never use EPS by itself. We pair it with revenue growth, free cash flow, and debt levels before forming an opinion on a stock.
Frequently Asked Questions
Can you explain EPS in a simple way?
EPS is a company's total profit divided by its total shares outstanding. It shows how much profit belongs to each individual share, similar to splitting a total profit pool into equal pieces.
What is a good EPS on a stock?
There's no universal "good" EPS number. What matters more is consistent EPS growth over time relative to the company's industry peers, rather than the raw dollar figure.
What is a good PE ratio and why?
A good P/E ratio varies by sector, but it matters because it shows how much investors are paying for each dollar of a company's earnings. Comparing P/E within the same industry gives more useful context than comparing it across unrelated sectors.
What does EPS actually tell you?
EPS tells you how much profit a company generates per share and whether that profit is growing or shrinking over time. It does not tell you about debt levels, cash flow, or whether the stock price is fairly valued.
Is diluted EPS more important than basic EPS?
Diluted EPS is generally considered the more conservative and realistic figure, since it accounts for all potential shares that could dilute existing shareholders.
Where can I find a company's EPS?
EPS appears directly on the income statement inside a company's 10-Q and 10-K filings with the SEC, as well as on most brokerage platforms and stock screeners.
How often does EPS get reported?
Public companies report EPS quarterly alongside their earnings releases, and also report a full-year EPS figure annually.
Want expert trading insights delivered daily?
Join thousands of traders who rely on Traders Agency for market analysis and trade ideas.
Join Traders AgencyDISCLAIMER: Traders Agency does not offer financial advice. The information provided is for educational purposes only and should not be considered financial advice. Traders Agency is not responsible for any financial losses or consequences resulting from the use of the information provided. Trading carries inherent risks and may not be suitable for all individuals. You are advised to conduct your own research and seek personalized advice before making any investment decisions, recognizing the potential risks and rewards involved.
See more from Traders Agency on Google
Make us a preferred source and our market analysis will appear more prominently in your Google Search, Top Stories, and AI results.
Add to Preferred Sources