
You've probably seen a stock jump 8% or drop 10% right after a company reports earnings, even when the headline profit number looked perfectly fine. That reaction usually has less to do with whether the company made money. It has to do with whether the company beat or missed what the market expected. In this guide, we'll show you how to read earnings guidance, compare it against analyst estimates, spot the patterns companies use when setting expectations, and use that information before you place a trade around an earnings date.
What Is Earnings Guidance?
Bottom Line: A stock's earnings-day move is driven less by whether a company made money and more by whether its results and guidance beat or missed what the market already priced in through analyst estimates. Reading guidance against estimates, rather than just the headline profit number, is what lets a trader understand why a stock jumped or dropped and avoid being blindsided before an earnings date.
Earnings guidance is a company's own projection of its future financial results, usually given as a range for revenue or earnings per share (EPS). Management typically shares guidance on quarterly conference calls or in press releases, and it covers the upcoming quarter or full year.
In practical terms, guidance is the company telling investors: "here's roughly what we expect to earn, based on what we can see in our own business right now." For example, a company might say it expects next quarter's EPS to land between $1.15 and $1.25. That's a guidance range in its simplest form, not a single number, because the future is never certain, even to the people running the company.
What Is EPS, in Simple Terms?
EPS, or earnings per share, is a company's total profit divided by the number of shares outstanding. If a company earns $100 million in profit and has 100 million shares, its EPS is $1.00. It's the simplest way to measure how much profit is attributable to each individual share you own.
How Does Guidance Differ From Analyst Estimates?
Analyst estimates are independent forecasts built by professional analysts at banks and research firms, not by the company itself. They use their own models, industry data, and conversations with management to predict what a company will actually report.
The consensus estimate is simply the average of all analysts covering a stock. So where company guidance says "we expect $1.15 to $1.25," the analyst consensus might land at $1.22, built from twenty different analysts' individual models.
This is the heart of earnings guidance vs estimates: guidance is the company's internal view, estimates are the market's external view, and the two don't always agree. When they diverge significantly, that gap itself becomes a signal worth watching.
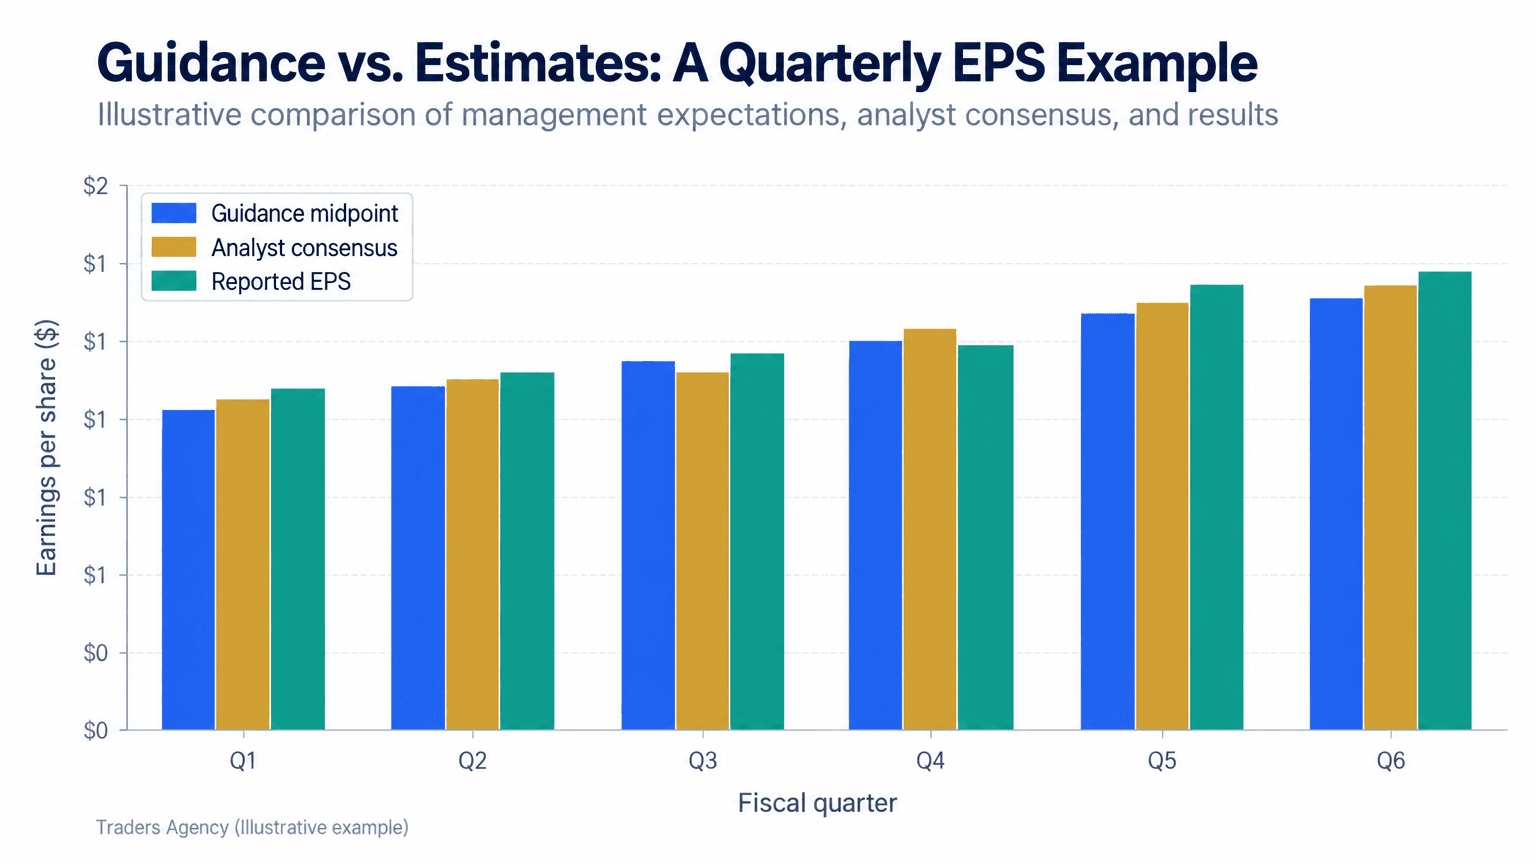
Notice in a chart like this how the actual reported number tends to sit above both the guidance midpoint and the consensus estimate in most quarters. We'll explain why that happens below.
Why Does Guidance Move Markets?
Stock prices react to surprises, not to absolute profit levels. A company can report record profit and still see its stock fall if that profit came in below what the market expected.
This is why earnings season trading is really a game of expectations. If consensus estimates sit at $1.22 and the company reports $1.30, that's a clean beat, and the stock often rises. Report $1.15 instead, and even though the company still made money, the stock can drop sharply.
The Whisper Number and External Factors
The whisper number is an unofficial estimate that circulates among active traders shortly before earnings, often slightly different from the published consensus. It reflects real-time chatter and positioning rather than formal analyst models.
A few things we want you to know about whisper numbers and the environment around earnings:
- They're not published on standard financial sites, so you'll mostly encounter them through trading forums and chat rooms.
- They tend to matter more for heavily traded, high-profile stocks with large options markets.
- Broader market conditions (interest rate moves, sector news, macro data) can overshadow even a clean earnings beat.
- A beat against consensus but a miss against the whisper number can still send a stock lower.
Want expert trading insights delivered daily?
Join thousands of traders who rely on Traders Agency for market analysis and trade ideas.
Join Traders AgencyWhy Do Companies Give (or Not Give) Guidance?
Not every company issues guidance, and that's a deliberate choice. Some management teams give detailed quarterly and annual ranges. Others give none at all, citing unpredictable demand or a preference to let results speak for themselves.
There are real pros and cons to weigh as an investor when it comes to guidance versus estimates. Guidance gives you a direct window into management's thinking, but it can also be used strategically.
This brings us to guidance sandbagging: the practice of setting guidance deliberately low so the company can comfortably "beat" it later. If you track a company's history and notice it beats its own guidance midpoint by 5% to 8% nearly every quarter, that's a pattern, not a coincidence.
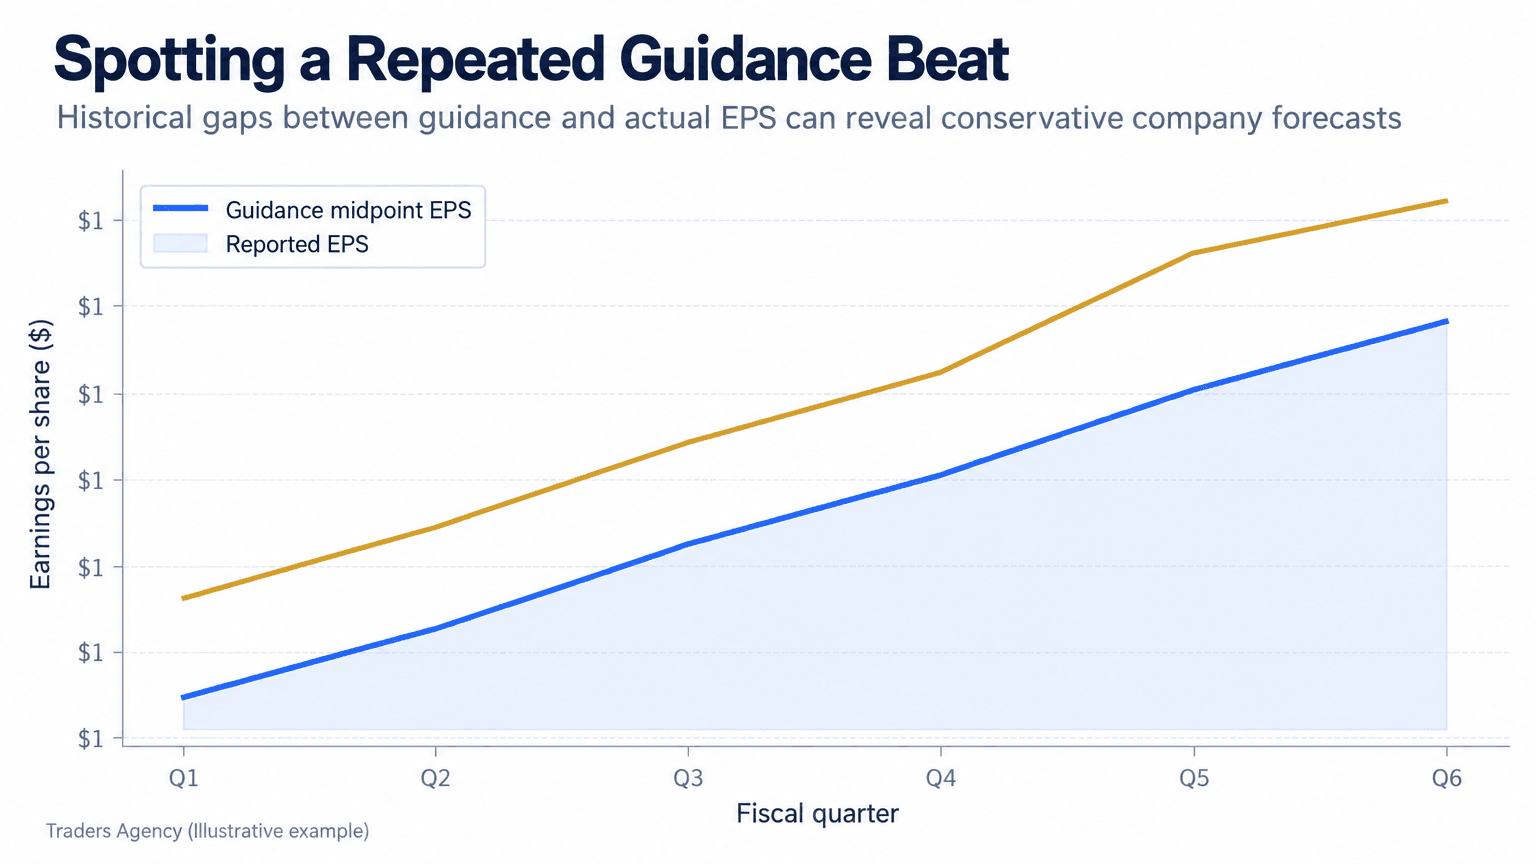
Key Concept: Our team always checks a company's last four to six quarters of guidance against what it actually reported before trusting a new range at face value. A consistent beat pattern tells you more than the headline guidance number does.
How Do You Evaluate Guidance vs Estimates Before Earnings?
- Step 1: Find the Company's Own Guidance, Check the company's most recent quarterly earnings press release, the transcript of its earnings call, or its investor relations page. Earnings releases that contain guidance are furnished to the SEC on Form 8-K, while the quarterly (10-Q) and annual (10-K) reports give you the reported results and management's discussion to measure that guidance against.
- Step 2: Pull the Analyst Consensus, Financial data sites and most brokerage research tools publish the consensus estimate alongside the stock's quote. This is your benchmark for what analyst estimates are doing relative to guidance.
- Step 3: Watch for Estimate Revisions, Estimate revisions happen when analysts update their models in the weeks before an earnings report, based on new data like sales trends, industry reports, or management commentary. A steady upward trend in estimates before earnings is often called revision momentum, and it tends to favor the stock.
- Step 4: Compare the Gap, Line up three numbers side by side: the guidance midpoint, the consensus estimate, and (once reported) the actual result. The size and direction of the gaps tell you whether the market was too optimistic, too pessimistic, or right on target.
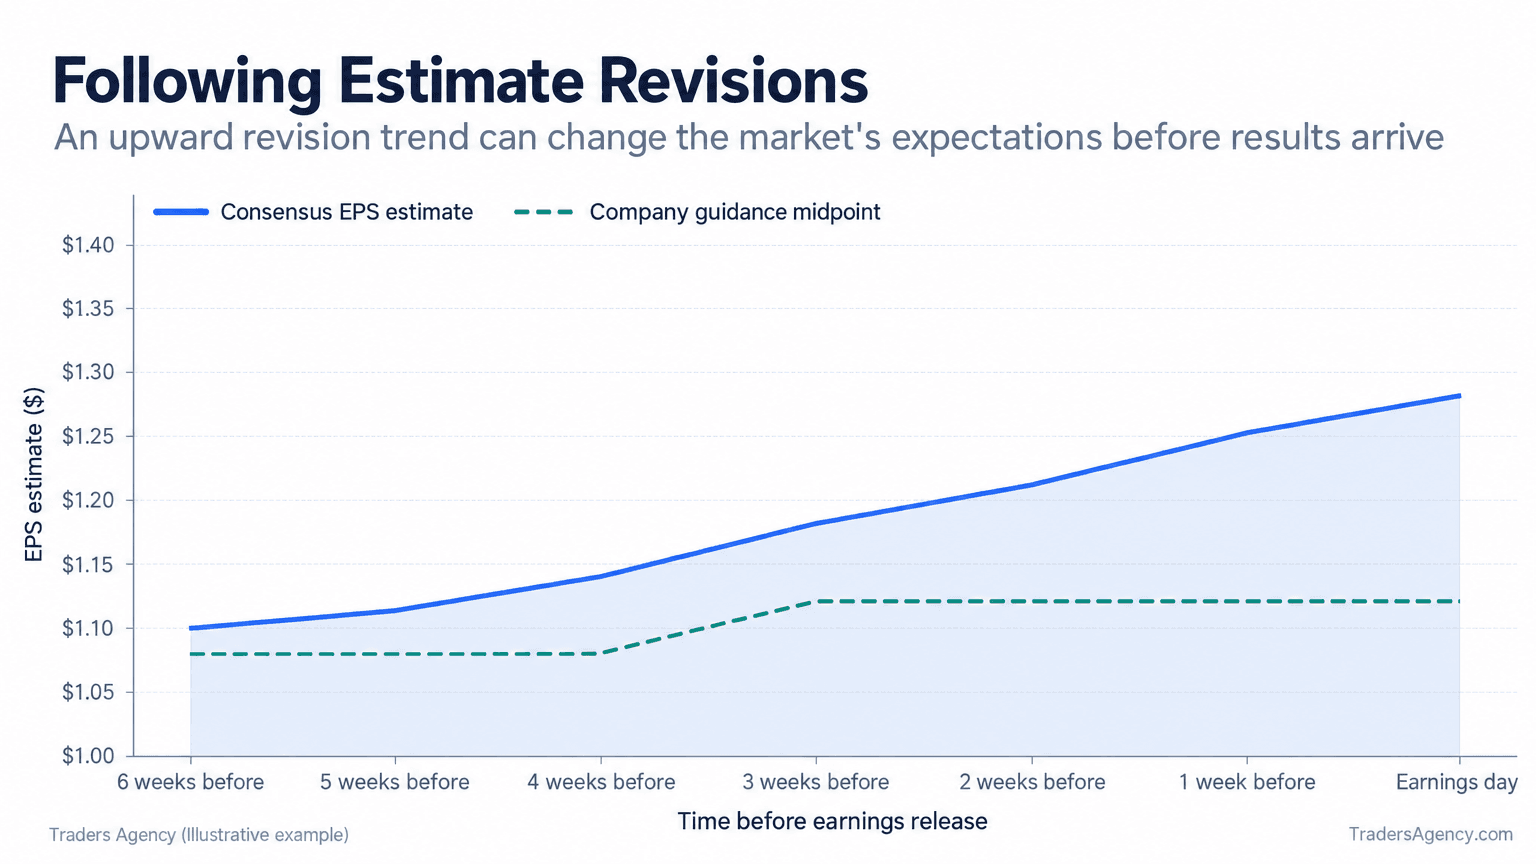
In the chart above, the estimate climbs from $1.10 to $1.28 over six weeks. That kind of steady upward revision is one of the clearer pieces of earnings guidance data retail traders can access for free on most brokerage platforms.
Forward P/E vs Trailing P/E: What Changes With Guidance
The price-to-earnings (P/E) ratio measures a stock's price relative to its earnings. The trailing P/E uses the last 12 months of actual reported earnings. The forward P/E uses projected future earnings, typically the next 12 months, based on guidance and estimates.
When guidance or estimates rise, the forward P/E falls even if the stock price doesn't move, because you're dividing the same price by a larger expected earnings number.
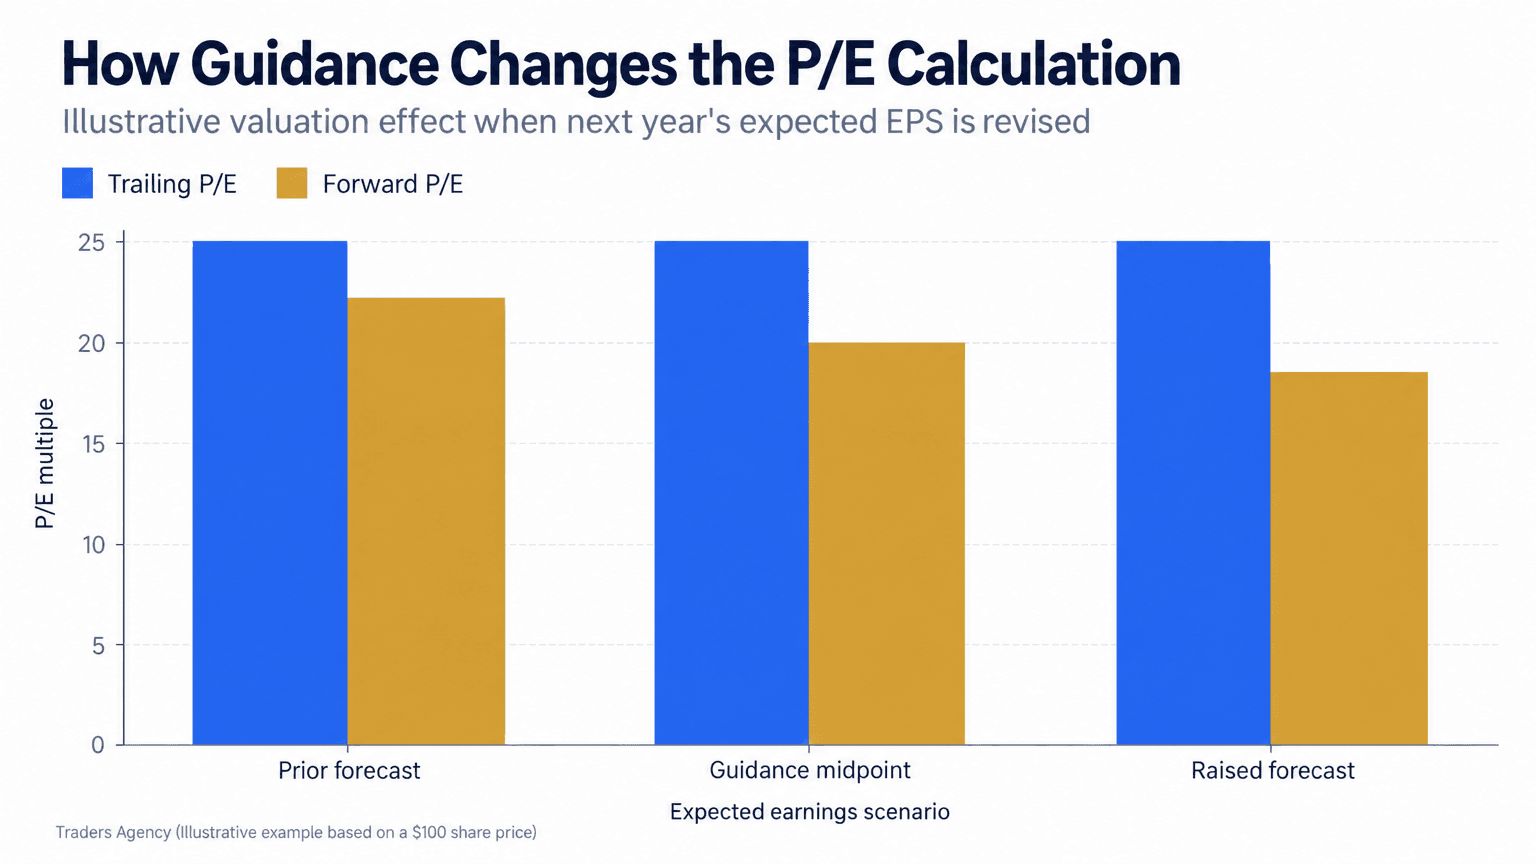
| Scenario | EPS Used | P/E Ratio (at $100 price) |
|---|---|---|
| Trailing P/E | $4.00 (last 12 months) | 25 |
| Forward P/E (guidance implies growth) | $5.00 (next 12 months) | 20 |
A stock priced at $100 with trailing EPS of $4 has a trailing P/E of 25. If forward guidance implies EPS of $5 next year, the forward P/E drops to 20, making the stock look cheaper on a forward basis even though the price hasn't changed at all.
What Is the 7% Rule in Stocks?
The 7% rule is a guideline some traders use to set a sell stop roughly 7% to 8% below their purchase price, limiting losses on any single position. It's unrelated to guidance itself, but it pairs naturally with earnings trading because earnings surprises can cause fast, large price swings.
Putting It Into Practice
We generally recommend comparing guidance and estimates in the two to three weeks before a reported earnings date, not the day before. This gives you time to see whether estimates are drifting up or down and whether the stock is pricing in a beat or a miss.
A few guardrails our team follows around earnings:
- Never size an earnings-season position larger than you'd be comfortable losing entirely overnight, since gaps can skip past stop losses.
- Check at least four prior quarters of guidance-versus-actual results before trusting a new guidance range.
- Treat a wide gap between guidance and consensus as a reason to dig deeper, not as a trade signal on its own.
- Remember that forward P/E is only as reliable as the estimates feeding it.
Watch Out: Guidance versus estimates analysis isn't a prediction tool. It's a way to understand what's already priced into a stock before news hits, which helps you avoid being surprised by a move that, in hindsight, the data was already hinting at.
Guidance comes directly from each company's investor relations materials and the earnings releases and periodic reports filed with the SEC, so it's worth getting comfortable pulling those documents yourself rather than relying only on headline summaries.
Want expert trading insights delivered daily?
Join thousands of traders who rely on Traders Agency for market analysis and trade ideas.
Join Traders AgencyDISCLAIMER: Traders Agency does not offer financial advice. The information provided is for educational purposes only and should not be considered financial advice. Traders Agency is not responsible for any financial losses or consequences resulting from the use of the information provided. Trading carries inherent risks and may not be suitable for all individuals. You are advised to conduct your own research and seek personalized advice before making any investment decisions, recognizing the potential risks and rewards involved.
See more from Traders Agency on Google
Make us a preferred source and our market analysis will appear more prominently in your Google Search, Top Stories, and AI results.
Add to Preferred Sources