
The S&P 500 just broke out to fresh record highs after surviving a brutal July momentum stock wreck, and traders need to understand what is really happening beneath this rally before committing new capital. Our team has been tracking a market that spent nearly three months grinding inside a tight 3% range before finally forcing its way higher. This Santoli market wrap up breaks down what the breakout means for you right now.
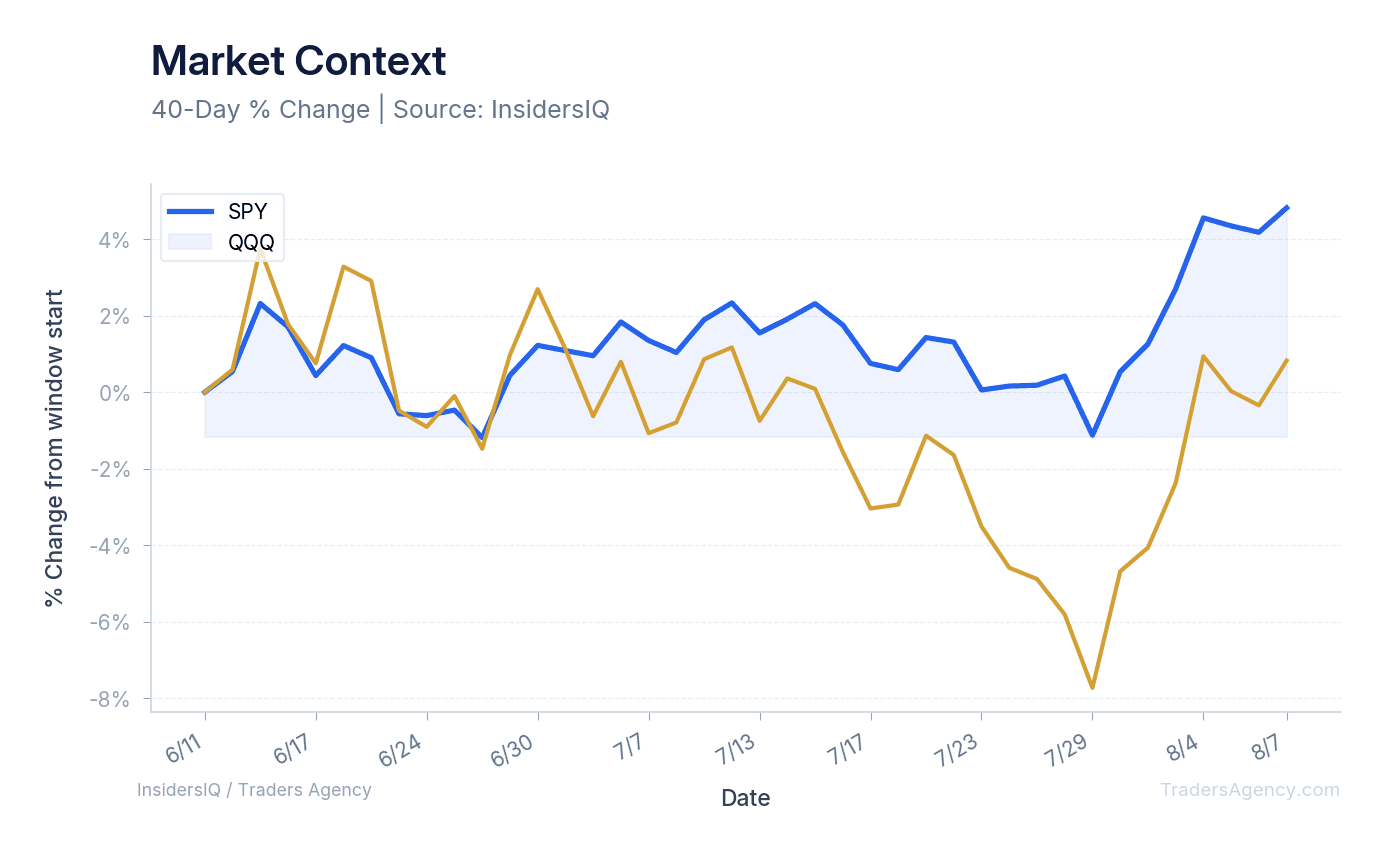
The data we track shows the SPY exchange-traded fund is up +4.81% over the last 60 days. That move follows the July momentum stock bust and the recent breakout. Meanwhile, the QQQ registers a far smaller +0.82% gain over the same window. This divergence reflects the weaker recovery in technology and momentum names relative to the broad index.
What Happened in the Market This Week?
The recent action centers on the S&P 500 rallying above the 7750 level following a weak jobs report. This is a textbook case of bad economic news driving equity buying, with traders betting the Federal Reserve will hold off on raising interest rates.
Our analysis shows this breakout was fueled by a classic scare-and-relief sequence. The market absorbed the July crash in momentum stocks and immediately rotated capital into lagging sectors. The majority of stocks actually gained ground on the index leaders during that transition.
The negative reaction to Federal Reserve Chairman Kevin Warsh's deliberately cagey July press conference gave the index the exact energy it needed to thrust out of its trading range. Nearly three months of churning inside that tight 3% range had exhausted both buyers and sellers before the eventual breakout.
The historical context here matters for anyone running a screener today. The S&P 500 has posted a positive return in more than 70% of all calendar years. It carries a 54% daily win rate. The index has hit an all-time high on 7% of all trading days since 1952. It is far more common for stocks to finish a year up 20% or more than to decline at all.
The Number: The S&P 500 has been positive in over 70% of calendar years and hits new all-time highs on 7% of all trading days since 1952. New highs are the norm, not the exception.
How Are Hedge Fund Liquidations Hitting Momentum Stocks?
The liquidation of the hedge fund Situational Awareness sent a shockwave through the market after its leveraged AI-hardware positions unwound. That forced selling acted as an offering to the market that established a definitive low. The 25% semiconductor retreat that followed flushed out weak hands across the technology sector.
We are tracking the severe damage done to crowded technology trades. A $100 investment placed in the long-short tech momentum strategy at the June peak is now worth just $61. The historical path for these busts suggests that value could fall to $41 within a year, after a short-term recovery.
Traders need to recognize that the second-quarter highs in these momentum stocks were built on massive leverage. That kind of crowding does not return quickly. The recent bounce in memory-chip leaders looks like a positioning adjustment, not fundamental improvement.
The momentum trade originally sprang from a perceived scarcity of memory chips. Eager dip buyers tend to forget how payback works in these cyclical industries, and we are watching those buyers get punished right now.
Are Stocks Showing Market Topping Behavior Today?
Our data points to clear market topping behavior right now. We see a market that is overbought, overowned, and overvalued. These conditions have historically preceded major secular tops, and they demand defensive planning from active traders who want to protect their capital.
Our review of the Secular Bear Watch model confirms these dangerous underlying conditions. The sentiment metrics we monitor validate the same overheated environment. The Fear & Greed index currently sits at 68, showing distinct greed in the market.
WallStreetBets sentiment registers at 0.03 with 2,748 mentions, proof that retail sentiment has reheated aggressively. When the headlines celebrate stocks returning to winning ways, we look for the structural cracks underneath the rally. The wall of worry has worn down significantly. Options market activity and Market Vane data both point to a trading crowd that has grown far too comfortable with the upside.
Want expert trading insights delivered daily?
Join thousands of traders who rely on Traders Agency for market analysis and trade ideas.
Join Traders AgencyThe Data Behind Our 2026 Market Outlook
The macroeconomic numbers driving this rally deserve careful scrutiny. Our outlook factors in corporate earnings currently tracking to rise an astounding 30% over last year. Nominal GDP growth is also running above 6%, a major tailwind for equities.
We are watching exactly how capital is flowing into the economy. The data points we track include:
- Roughly $750 billion spilling into the market through partly debt-financed AI capital expenditures.
- Corporate-bond spreads remaining completely benign.
- Nominal GDP growth exceeding the 6% threshold.
The earnings quality, however, is highly suspect. The S&P 500 reported 47% second-quarter earnings growth. Nearly 20 percentage points of that came from $140 billion in unrealized gains, generated strictly by investments from Alphabet and Amazon into Anthropic and SpaceX.
The Catch: Of the S&P 500's 47% Q2 earnings growth, nearly 20 percentage points came from $140 billion in unrealized gains, not operating performance. The market will not pay a sustained multiple on windfalls like these.
The market will not assign a durable multiple to these one-off, third-party investment windfalls. Companies may also be over-earning by pulling demand forward and riding fleeting pricing advantages.
How Market Fragmentation Is Affecting Trading Today
The current trading environment is suffering from severe fragmentation. Electronic venues have split order flow across countless buyers and sellers, creating a chaotic environment for retail participants. That dynamic makes it incredibly difficult to track true institutional accumulation and distribution.
We see parallels between today's market structure and the chaos in the restaurant-reservation ecosystem. Multiple middlemen and third-party players step in front of the public, breeding distrust in the information that gets displayed openly.
Traders have to rely on raw price action rather than public narratives. The erratic flows of the over-intense dispersion trade are a direct result of this fragmentation. The bears had an opening to inflict more aggregate damage and seize on those erratic flows, but they failed to execute.
What Does History Tell Us About This Market Setup?
Our team frequently studies historical parallels to guide our analysis. The current environment shares traits with the start of the great bull market on August 13, 1982. On that Friday, the Dow Jones Industrial Average gained 1.4% coming off a bear-market low of 776.
That 1982 low was a level first reached 18 years earlier. It was followed by 18 years of superb equity returns and valuation expansion. Traders should remember that this same period was interrupted by the savage crash of 1987.
Our analysis suggests the secular bull market that began in 2009 is now in its waning phase. We expect investors to face a lost decade of meager stock returns at some point across an investing lifetime. The nine-month cyclical bear market of 2022 was a more routine setback, but a true lost decade of meager returns is a bigger risk to long-term outcomes.
What Traders Should Do With Their Stock Picks Now
This environment demands a highly specific approach to your stock picks. The data shows retail traders struggling to keep pace with the broader indices. Robinhood's earnings presentation showed its clients collectively underperformed the S&P 500 in the year ended June 30.
We recommend adjusting your strategy immediately. Here are the specific signals our team is watching:
1. Reduce Exposure to Crowded AI Trades
The momentum frenzy was built on leverage that has now evaporated. We are avoiding the semiconductor names that suffered the recent 25% drawdown.
2. Monitor the 7750 Level
The S&P 500 rally above 7750 is the definitive line in the sand. We are watching it closely to see whether buyers can hold control or whether a failed breakout takes shape.
3. Screen for Fundamental Quality
Ignore the inflated earnings numbers driven by third-party investments. We are focusing our picks on companies generating real cash flow without leaning on unrealized venture gains.
The Bottom Line
The headline that stocks have returned to their winning ways does not tell the whole story. The long-term win rate of the stock market reaches 100% over any past 20-year span. The interim risks, though, are severe, and traders should expect cyclical bear markets and extended stretches of poor performance.
Our team sees a market that survived a momentum wreck but remains structurally vulnerable. The extreme leverage is gone, but the overvaluation warnings are flashing red. We are keeping our position sizes small and demanding strict fundamental confirmation before deploying new capital.
Want expert trading insights delivered daily?
Join thousands of traders who rely on Traders Agency for market analysis and trade ideas.
Join Traders AgencyKey Takeaways
- The S&P 500 broke out to record highs after spending nearly three months grinding inside a tight 3% range, with SPY up +4.81% over the last 60 days.
- QQQ gained only +0.82% over the same 60-day window, revealing that technology and momentum names have lagged the broad market recovery significantly.
- The breakout above 7750 was triggered by a weak jobs report, a classic bad-news-is-good-news reaction where traders priced in a Fed rate hold.
- The July momentum stock crash actually accelerated a rotation into lagging sectors, with the majority of stocks gaining ground on index leaders during the transition.
- Despite the new highs, the team is keeping position sizes small and requiring strict fundamental confirmation before deploying capital, citing overvaluation warnings and lingering structural vulnerability.
DISCLAIMER: Traders Agency does not offer financial advice. The information provided is for educational purposes only and should not be considered financial advice. Traders Agency is not responsible for any financial losses or consequences resulting from the use of the information provided. Trading carries inherent risks and may not be suitable for all individuals. You are advised to conduct your own research and seek personalized advice before making any investment decisions, recognizing the potential risks and rewards involved.
See more from Traders Agency on Google
Make us a preferred source and our market analysis will appear more prominently in your Google Search, Top Stories, and AI results.
Add to Preferred Sources