
Hey, Ross here:
Last month, the S&P 500 triggered one of the most bullish historical setups I’ve seen in a while.
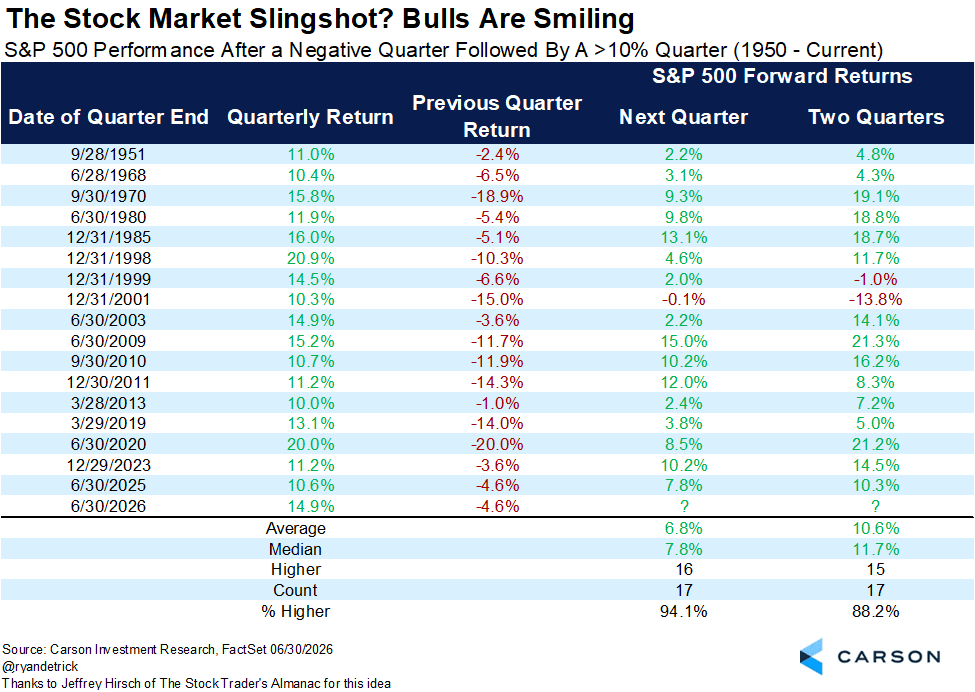
It’s only happened 17 times since 1950…
And 16 of those times, stocks kept climbing the following quarter.
Take a look:
Chart of the Day
Here’s the setup that caught my eye.
The S&P 500 fell 4.6% in Q1…
Then came roaring back 14.9% in Q2.
Since 1950, we’ve only seen that combination 17 times:
A down quarter…
Followed immediately by a gain of 10% or more.
And after 16 of those 17 setups, stocks kept climbing the following quarter.
That’s a 94% hit rate.
The average gain?
Another 6.7%.
You can see why some traders call it a “slingshot.”
The market gets yanked backwards…
Then snaps hard in the other direction.
Of course, nothing says history has to repeat this time.
But there’s another part of this rally that makes the setup even more interesting.
Look at small caps:
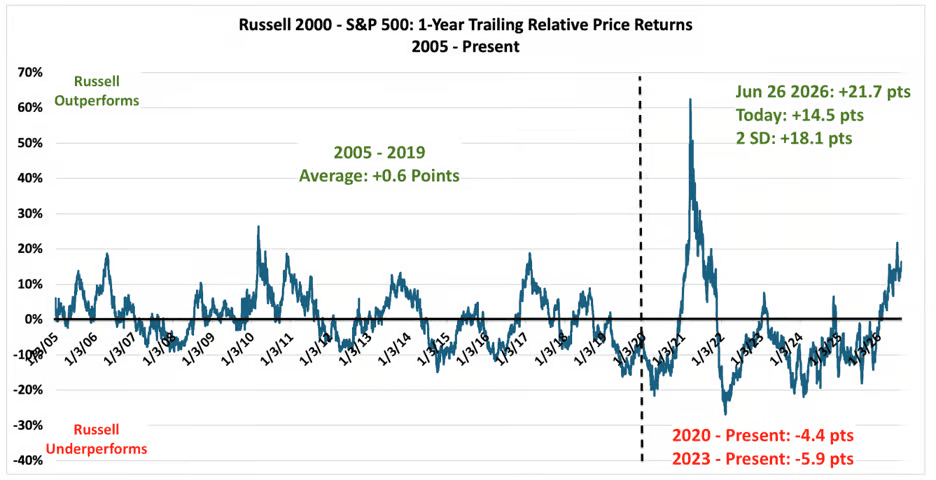
For most of the past few years, the Russell 2000 has been the market’s punching bag.
Since 2023, small caps have repeatedly lagged the S&P 500 by one or even two standard deviations.
Now the rubber band has snapped the other way.
The Russell is outperforming the S&P by roughly 14.5% over the past year.
That’s about a two-standard-deviation move in favor of small caps.
So if this really is another S&P slingshot…
The best opportunities may not be in the giant stocks everyone already owns.
They may be much further down the market.
And that creates a completely different problem.
I explain below.
Insight of the Day
Small-caps create huge blind spots
Small caps can make monster moves.
That’s why so many traders – myself included – love them.
It takes a lot less buying to move a $500 million company than a $500 billion giant.
But the smaller you go…
The harder the research gets.
Apple has an army of analysts picking through every number.
A tiny company might have three – sometimes none.
There are fewer reports… less media coverage.
And far fewer people digging around for what might happen next.
That can create huge blind spots.
A small stock could have something important brewing beneath the surface…
While almost nobody on Wall Street is paying attention.
So if small caps really are starting to lead again, you need another way to find the most lucrative opportunities.
I’m going to share more about my powerful – yet controversial – “underground” strategy for targeting the most lucrative opportunities.
So make sure you keep an eye out for that.
In the meantime, have you heard of the massive window of opportunity that just opened up in gold?
Customer Story of the Day
“IF YOU WANNA MAKE MONEY, DO IT.
Hands down the best investment I’ve ever made.
Clear, simple and the most effective method I’ve come across. I’ve invested in training with other “gurus” who although they were good, they left out the most important part. … HOW TO FIND STOCKS.
Ross and his crew have completely hit it out of the park. With his method of entering and exiting my account is up 13% in a month.
I have multiple stocks currently at 50% gains after only a few weeks. The cost to join his memberships will be made back in less than a month. ….. unlike others out there”

Ross Givens
Editor, Stock Surge Daily
See more from Traders Agency on Google
Make us a preferred source and our market analysis will appear more prominently in your Google Search, Top Stories, and AI results.
Add to Preferred Sources