


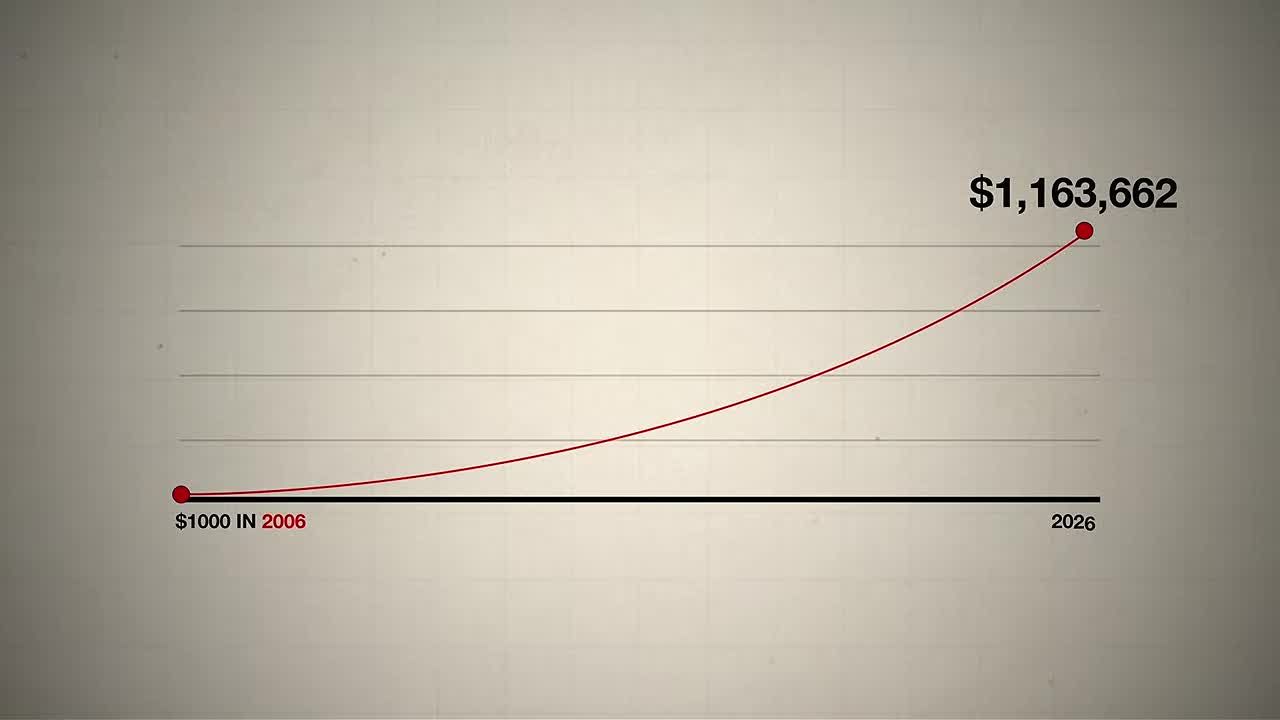
The one stock a year strategy is about as mechanical as investing gets: every January, buy the prior year's best-performing S&P 500 stock and hold it. Run from 2006, it would have turned $1,000 into $1,163,662 by late 2026. That's a compound annual growth rate above 40%, nearly four times the S&P 500. Total return: 116,000% versus 793% for the index.
The mechanics are simple. The risk is not.
I backtested it, pulled apart why it worked, then ran three variations to see whether the returns survive without betting an entire account on a single name every twelve months. Some of what came back is exciting. Some of it should make you nervous, especially given where this market cycle currently sits.
Here's the strategy, and how I'd actually run it with my own money.
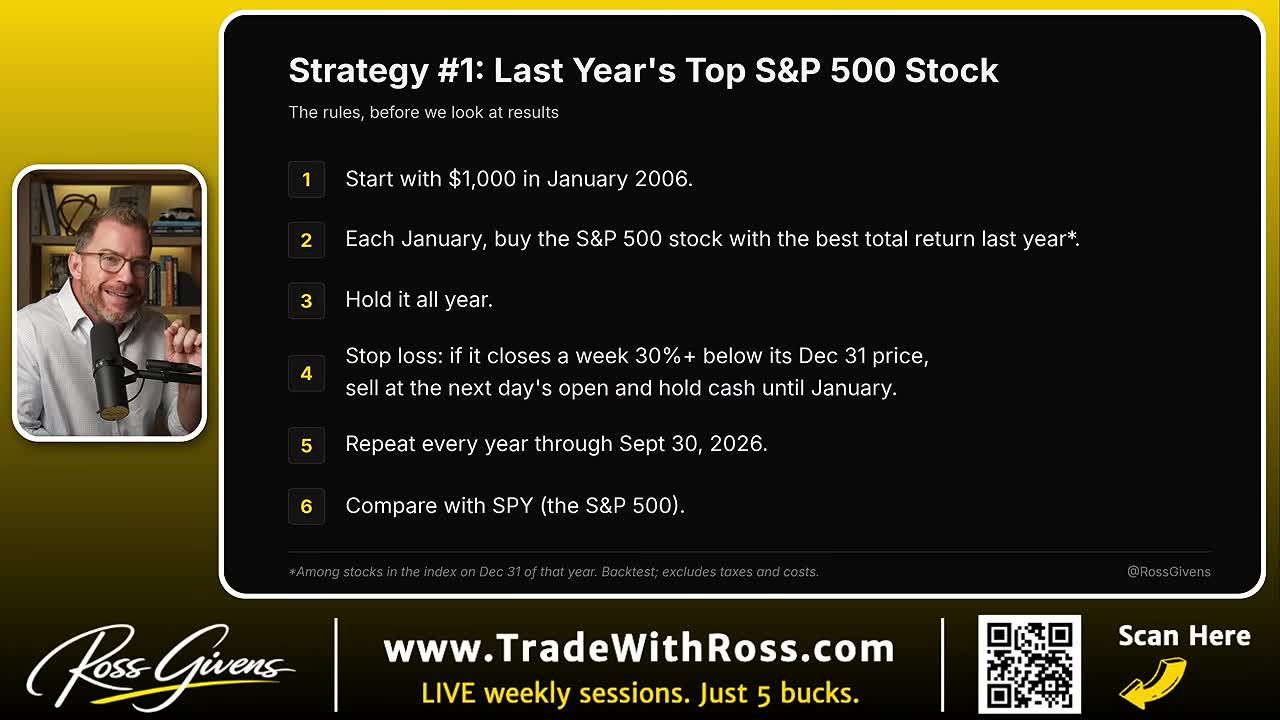
The Rules, Start to Finish
Bottom Line: Buying the prior year's top S&P 500 stock each January turned $1,000 into over $1.16 million since 2006, far outpacing the index, because winners tend to keep winning for a stretch before reversing. That edge comes with brutal single-stock drawdowns past 50%, so spreading the bet across the top three names and using a weekly (not intraday) stop loss keeps the momentum edge while cutting the risk of ruin.
One trade each January, one stop loss, checked weekly
- Each January, identify the S&P 500 stock with the best total return from the prior year.
- Buy that single stock and hold it for the entire year.
- Set a 30% stop loss measured from where the stock opened the year.
- Check the price once a week at the weekly close, not intraday.
- If it closes the week more than 30% below that opening price, exit the following Monday.
Repeat every January with whatever name topped last year's leaderboard. That's the whole system.
The weekly-check stop matters more than it sounds. A hard, real-time 30% stop gets you shaken out by every intraday whipsaw. Checking once a week gives a volatile winner room to breathe while still protecting you from riding a stock in freefall for months.
The One Stock a Year Strategy: $1,000 to $1.16 Million
Run from 2006 through the third quarter of 2026, the $1,000 stake grew to $1,163,000 and change. The same money parked in the S&P 500 grew to $8,931.
The growth curve is not a straight line, and you need to understand that before the headline number does any damage to your judgment.
The strategy underperformed the S&P 500 for roughly a decade. Max drawdown came in at 58%, meaningfully worse than the index over the same stretch. Start this in 2006 and you spend years watching a boring index fund beat you.
Now the part that should really temper the enthusiasm: most of the total gain came from a single year. 2026 year to date returned 633%, entirely because the strategy went full bore into SanDisk (SNDK), the top performer of 2025. Strip that year out and you land somewhere near $150,000 instead of over a million. Still a massive win over the index. A very different story than "$1,000 into $1.16 million."
Why 2008 Lost 49% With a 30% Stop
The strategy dropped 49% in 2008 with the stop loss in place. The stock that year, NOV, fell so fast between weekly checks that it blew through the level before the Monday exit could fire.
That's the tradeoff. A weekly stop keeps you from getting flushed out on short-term noise. It cannot save you from a stock that craters mid-week.
Why Hold Just One Stock Instead of a Diversified Portfolio?
Be honest with yourself before adopting any version of this. Why would you hold one stock, or even three, instead of a diversified portfolio? This is not money you need in the next year or two.
If the goal is outsized growth and you accept outsized risk to get it, a concentrated position isn't unreasonable. If you're near retirement, or this is capital that can't afford to fall more than 10%, it's the wrong tool entirely.
The approach also runs straight at one of the oldest rules in investing: buy low, sell high. This does the opposite on purpose. You're buying last year's biggest winner, which means you're buying after the move, not before it. A deliberate bet on momentum, not value.
Why Can a One-Stock Strategy Lose 80% of Its Value?
A strategy with a 58% max drawdown, or 80% in one variation, is only usable if you can watch your account get cut in half or worse without bailing at the bottom. Most people can't. That's not a character flaw, it's reality.
Swap the S&P 500 for the Nasdaq and the single-stock results are similarly strong: roughly $1.2 million versus $1.1 million. The Nasdaq, tech heavy, has outperformed the S&P over the last 20 years. But the drawdown ballooned to 80% peak to trough, playing out from roughly 2006 into 2011.
In hindsight it's easy to say you would have trusted it long term. No, you wouldn't. I wouldn't have. If I lose 80% of my money, I'm throwing the thing in the trash bin.
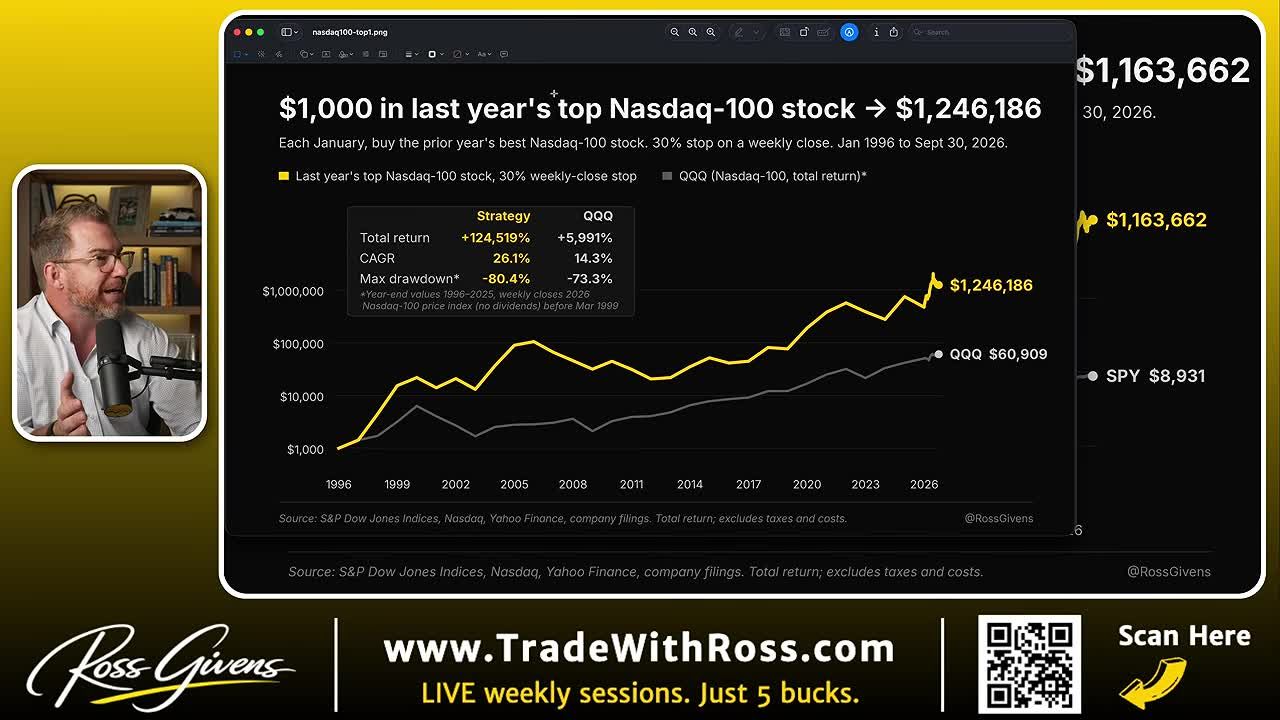
That's the honest tension at the center of every debate about going all in on one stock. The backtest looks incredible. Living through an 80% drawdown is nothing like looking at a finished chart.
Get an entire year of live weekly mentoring sessions, my newsletter, indicators, bonus reports, tons more. Click the link and I'll see you in the next live session.
Join my Black Ops Trading ClubWhat Is the Real Risk of Betting on a Single Stock?
Three problems stack up here: concentration risk, dependence on one or two outlier years for the bulk of the return, and drawdowns that dwarf anything a diversified index produces. One bad pick can erase years of gains before a stop even gets a chance to work.
Blackberry is the obvious warning. It shows up in the data as a position that hit the stop outright. We've seen enough names go from 100 to 1 to know that concentrating capital in a single stock, even a recent leader, carries real tail risk. A 30% stop helps. It doesn't eliminate a gap-down between weekly checks, which is exactly what NOV delivered in 2008.
Then there's the quieter problem: false diversification. I combined the top Nasdaq stock with the top S&P 500 stock expecting better risk-adjusted returns. The results weren't any better. There's overlap between Nasdaq 100 and S&P 500 constituents, so you sometimes end up in the same name, or two names in the same group moving on the same idea, thinking you're diversified when you're not.
Spreading the Bet Across Three
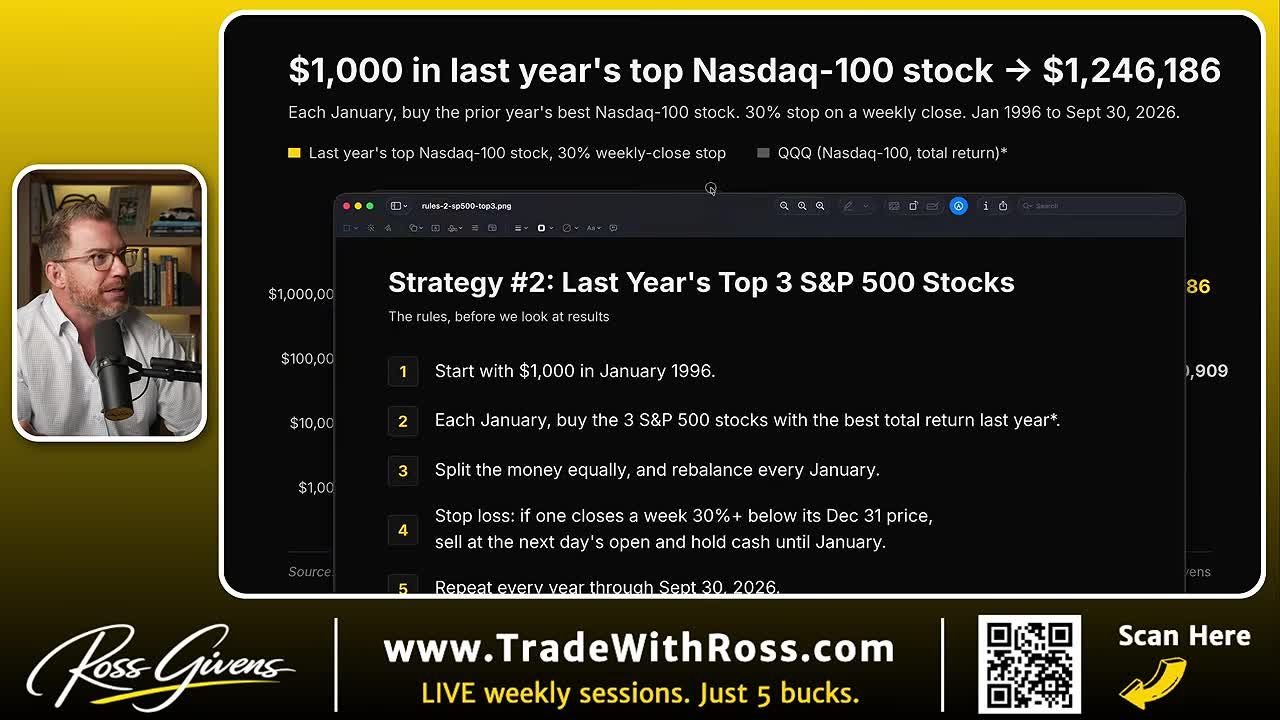
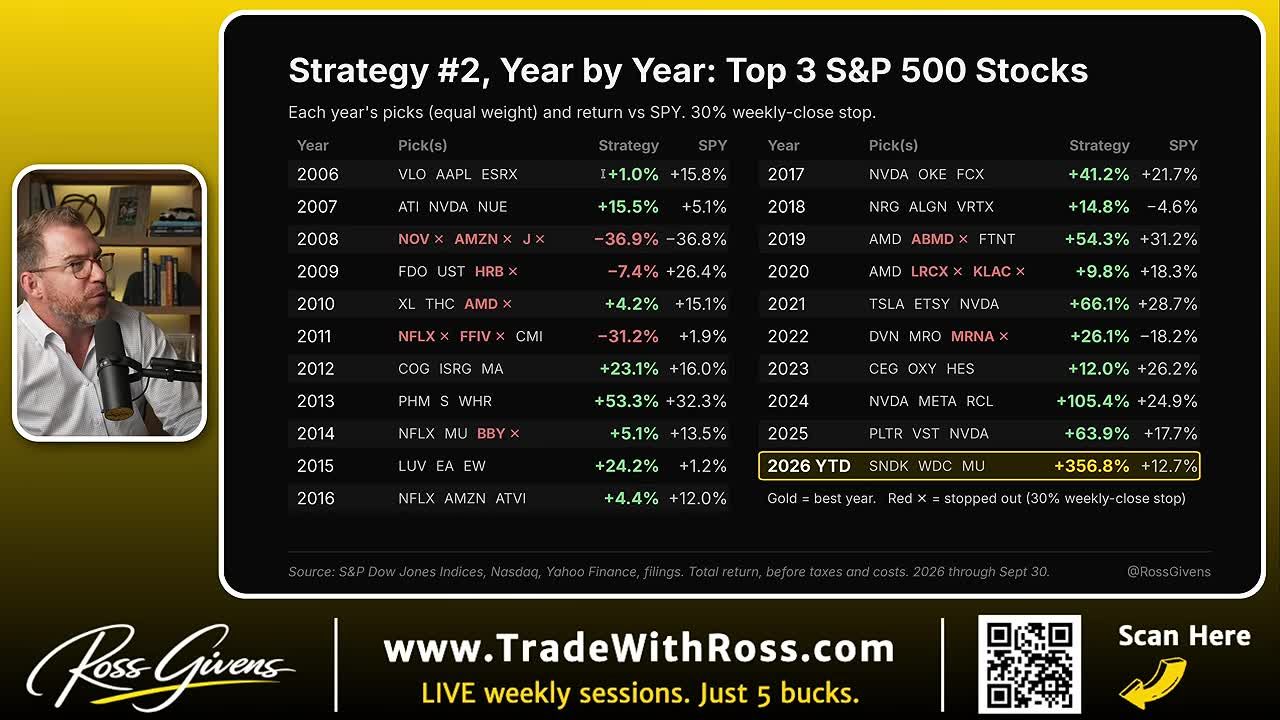
The fix for concentration risk isn't abandoning momentum. It's widening the bet. Same rules, same January timing, same 30% weekly-close stop, but the money goes into the top three performers in the S&P 500, split evenly, one third each.
Still a massive outperformance: roughly a 26% compound annual growth rate, about two and a half times the market. Total return lands near a tenth of the one stock a year strategy's result, almost entirely because that one SanDisk year carried so much weight in the original.
But the ride is smoother. The worst year, when NOV hit its stop, was softened by also holding Amazon. Other names across the backtest include Western Digital, Micron, Netflix, and Cummins. SanDisk still shows up, just as a third of the book instead of the whole thing, producing something closer to 350% than 600-plus.
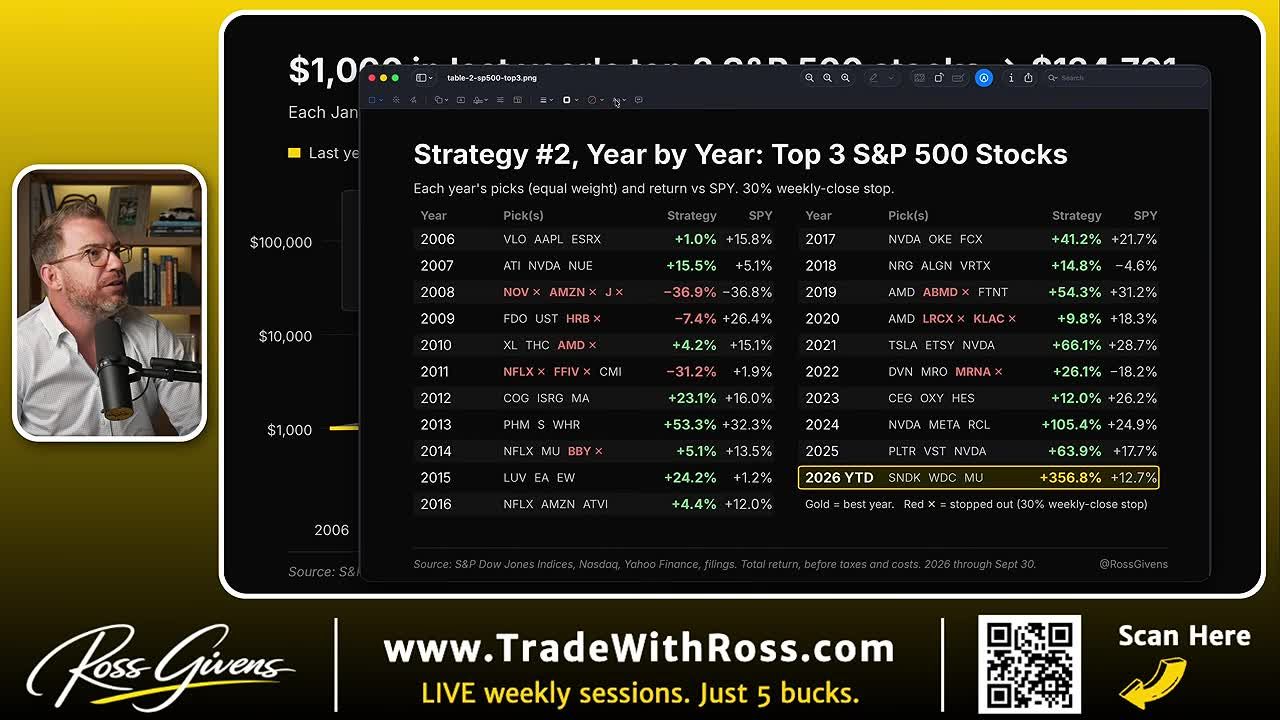
Compare the annual numbers to SPY sitting right next to them. 2006 underperformed. 2008 came in about even. 2009, a recovery year, underperformed. The outperformance years are enormous: 53% versus 32%, 24% versus 1%. Over the last decade, big outperformance in nearly every year.
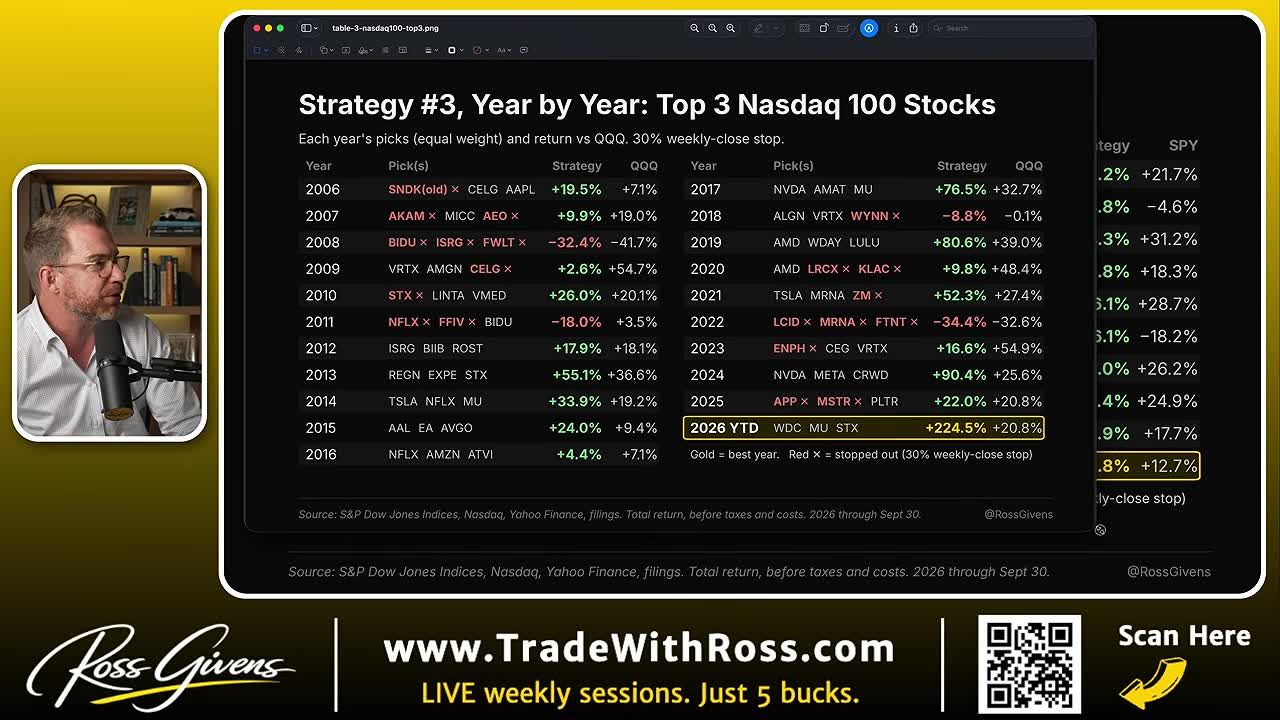
The Nasdaq Version Has a Twist
Running the same top-three approach on the Nasdaq produced slightly lower total returns than the S&P version, with one result worth sitting with: the max drawdown beat the index itself. The Nasdaq saw a 41.7% drawdown in the 2008 decline. This strategy drew down 34%.
Lower drawdown than the benchmark, higher compound growth rate, far bigger total return, and it stayed ahead for the bulk of the last 10 years. That combination is rare.
Taking It Back to 1996
The fair objection is that a 2006 start date skips the dot-com bubble, the biggest test available. So I ran the top-three S&P strategy back to 1996.
The pattern held. $1,000 grew to roughly $8,000 between 1996 and 2000, an 800% return, followed by a hard correction that recovered quickly. The drawdowns are bigger, which is a universal finding when you own one or three stocks instead of 500. Pick the wrong horses two or three years running and it hurts.
What stands out in the 30-year test is consistency. The outperformance was spread across the whole period rather than hanging on a single final year the way the recent SanDisk spike does.
Which brings up the part I find a little worrisome. The big numbers in 2024, 2025, and especially 2026 look like what shows up at the end of a bull market peak. 1997 through 1999 produced the same shape before the top fell out. We may be running into the eighth or ninth inning of this AI bubble.
How Concentrated Should You Be?
There's no universal answer, but the data gives you a framework: the more concentrated the portfolio, the higher the potential return and the deeper the potential drawdown. Spreading across the top three momentum leaders instead of a single name trims the drawdown, though it stays large, while still beating a plain index approach.
The dollar amount barely matters. An account that falls 58% is the same gut punch at any account size. The real question is how much volatility you can watch in real time without selling at the worst possible moment.
Owning 500 stocks through an index pads the blow. Concentrating into three names, or one, strips that padding away in exchange for a shot at outsized returns.
How I'd Run It
Top three S&P 500 stocks, never the single top performer, and never without a stop loss. Blackberry and NOV show that even a 30% stop isn't a guarantee. Running the one stock a year strategy with no stop at all while betting everything on a single name is a bridge too far for me.
I also wouldn't use a hard, real-time stop. These big movers are volatile and need room. Where a stock closes the day or the week is where it actually landed in the race. The intraday noise is mostly irrelevant.
A weekly stop does two things. It lets a position bounce back from some wild piece of news and recover by Friday. And it cuts your workload down to five minutes on a weekend: check the close, sell Monday if it broke, sit in cash until January.
This is not a strategy for capital you need soon. It's for investors chasing outsized growth who accept that buying what already went up is the entire premise, in direct opposition to buy low, sell high.
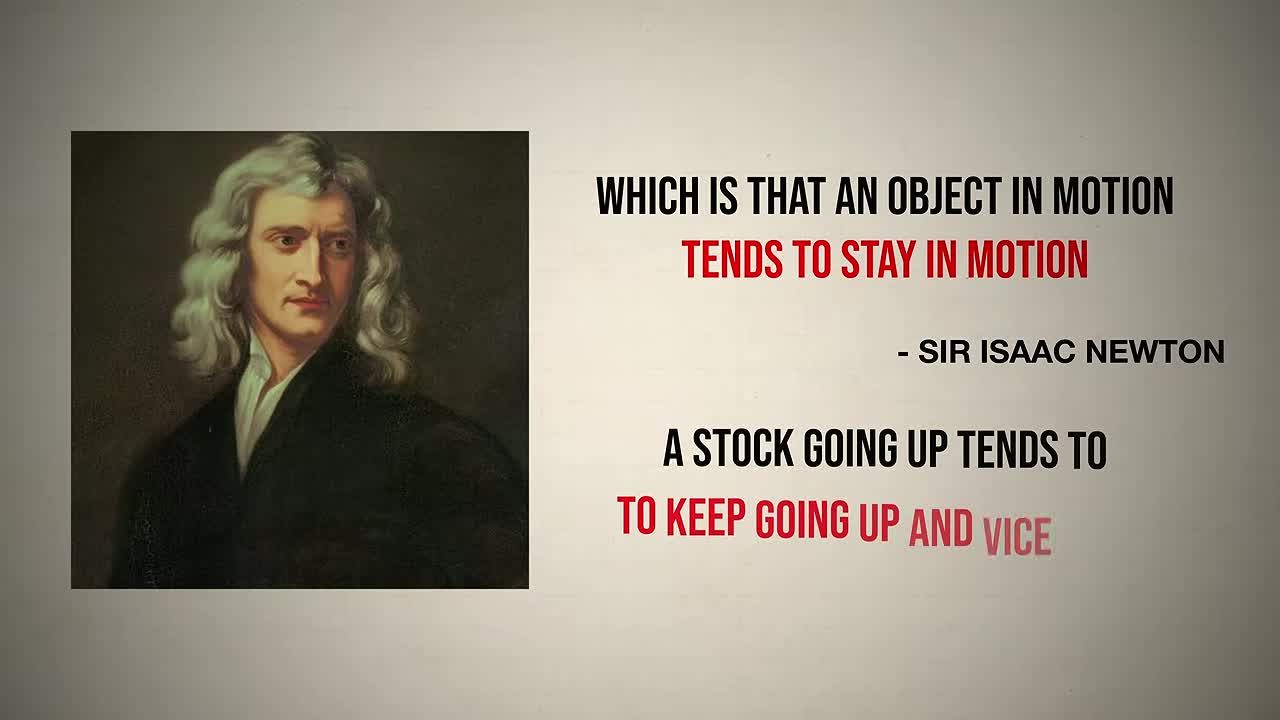
The market has a way of embarrassing the greatest number of people. Everyone who thinks those stocks are too high watches them go higher. Everyone who thinks these stocks are cheap watches them get cheaper. Newton's first law: an object in motion tends to stay in motion. A stock going up tends to keep going up, and vice versa.
Three leading names instead of one. A weekly stop, not an hourly one. Clear eyes about drawdowns that can run past 50%. The one stock a year strategy and its top-three variations are more volatile than an index, the upside is higher, and the only person who can decide whether that trade is worth it is you.
Get an entire year of live weekly mentoring sessions, my newsletter, indicators, bonus reports, tons more. Click the link and I'll see you in the next live session.
DISCLAIMER: Traders Agency does not offer financial advice. The information provided is for educational purposes only and should not be considered financial advice. Traders Agency is not responsible for any financial losses or consequences resulting from the use of the information provided. Trading carries inherent risks and may not be suitable for all individuals. You are advised to conduct your own research and seek personalized advice before making any investment decisions, recognizing the potential risks and rewards involved.
See more from Traders Agency on Google
Make us a preferred source and our market analysis will appear more prominently in your Google Search, Top Stories, and AI results.
Add to Preferred Sources