Hey, Ross here:
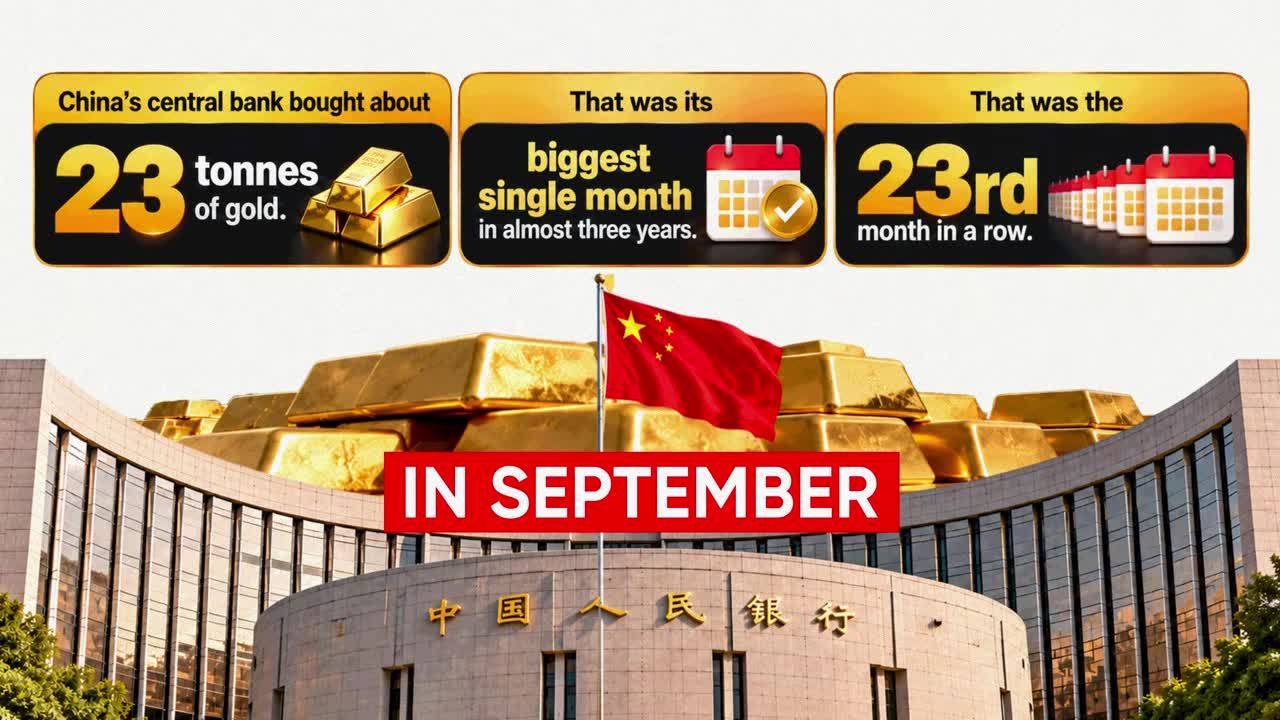
Commodity boom stocks are back in focus, and the setup behind this move is bigger than most investors realize. China's central bank just bought roughly 23 tons of gold in September, its biggest single month in almost three years, and the 23rd month in a row it has added to the pile. Meanwhile, the world is staring down a copper shortfall the International Energy Agency says will still leave mine supply about 25% short by 2035.
This isn't a two-week news cycle. It's a supply problem that took decades to build and will take decades to fix.
Below is the data behind the boom, plus the two commodity boom stocks I'm using to play both sides of it: copper and gold.
Why Are Commodity Boom Stocks Still Early?
Bottom Line: Copper and gold face slow-to-fix supply problems, not short-term news cycles. Mine development takes about 17 years and central bank gold buying has continued for 23 straight months, so pullbacks in commodity boom stocks look more like entry points than warning signs.
Demand turns on in a year. Supply takes two decades.
Commodity booms don't behave like tech booms. When a software company gets popular, it hires a few hundred engineers and doubles output inside a year. When the world needs more copper, somebody has to find it, dig it out of a mountain, crush it, and ship it. That process is slow by nature, and no amount of capital or hiring speeds it up.
The numbers make the point. A copper project takes roughly 17 years to go from discovery to production. A mine opening in 2043 has to be discovered right now. On top of that, only 5% of all copper deposits found in the last 35 years were discovered in the last decade. The miners simply aren't finding much.
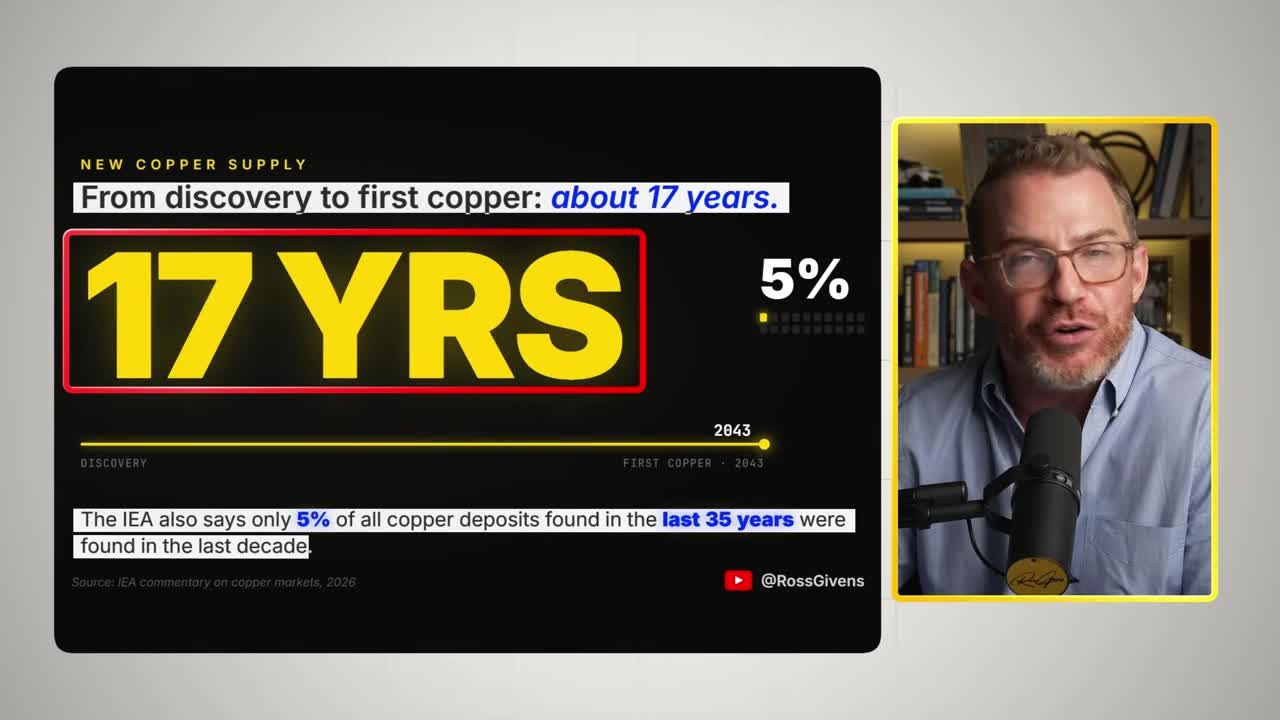
Demand can turn on in a year. Supply takes the better part of two decades to answer. That mismatch is the entire thesis.
Copper: The Plumbing of the Modern World
Copper is in every power line, every car, every air conditioner, every phone charger. Anything you plug into an outlet runs through copper, and data centers are now eating it by the ton.
So the IEA ran the numbers. It added up every copper mine operating today, plus every new mine that has been announced, and compared that total to projected global demand. The answer: by 2035, mine supply comes up about 25% short. One quarter of the copper the world needs in 2035 has no mine behind it yet.
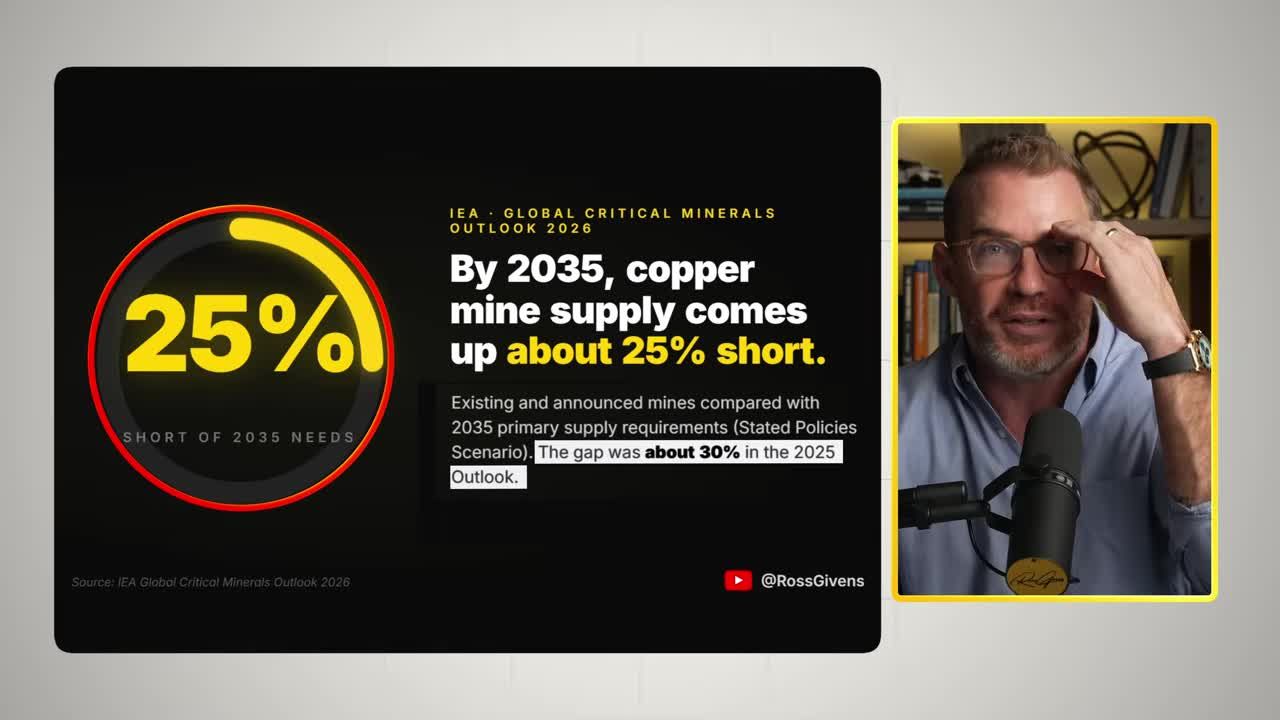
To be fair, that number improved a little. In the 2025 report the gap was closer to 30%, narrowed by new projects in Africa. But a 25% shortfall in a material you cannot easily substitute, one that takes 17 years to bring online, is still a structural problem.
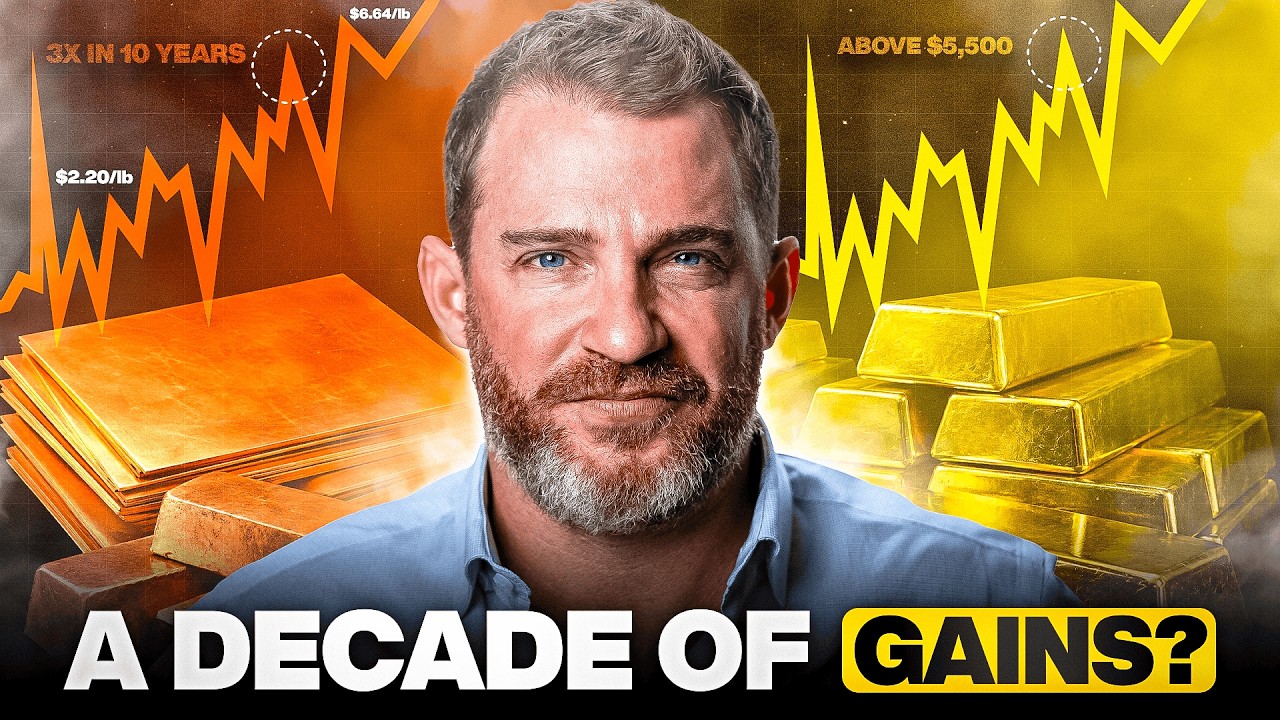
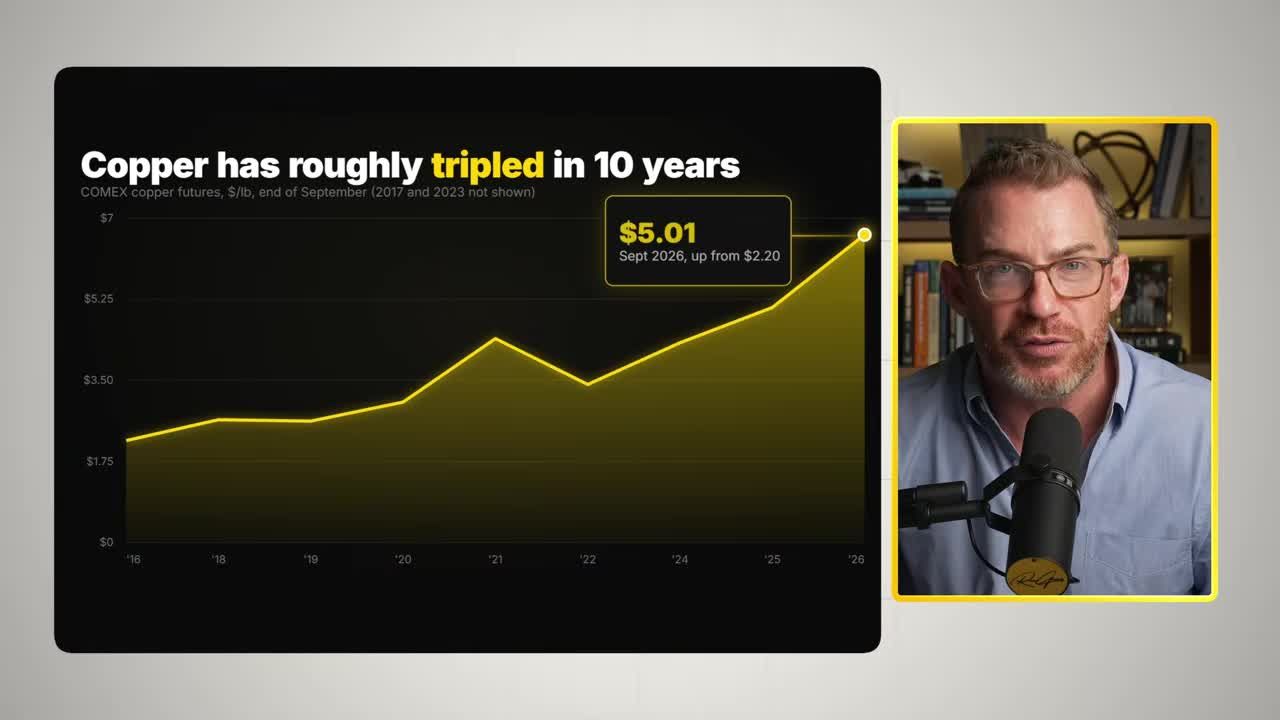
The price has already responded. Copper has gone from $2.20 a pound to $6.64 over the last ten years, roughly tripling in a decade.
Why That Matters for Miners
A mine's costs barely move when the copper price moves. Same diesel, same trucks, same wages either way. Almost every extra dollar on the copper price drops straight to profit.
When copper goes up a little, a miner's profit goes up a lot. That's why the right copper stock can run far faster than copper itself.
The Copper Pick: Freeport-McMoRan
Freeport-McMoRan is the largest publicly traded copper miner based in America. It runs the giant Morenci mine in Arizona, big operations in Peru and Chile, and one of the largest copper and gold deposits on the planet: Grasberg in Indonesia.
Grasberg had a disaster in September 2025 when a mud rush inside the underground mine shut down a big chunk of production. That sounds like bad news. It's exactly why I like Freeport here. In the third quarter, Grasberg was running at about 67% of its normal rate, and Freeport expects to be near full capacity by the end of 2027.
Most miners are fighting to squeeze a few extra percent out of tired old mines. Freeport has a third of one of the world's biggest mines still waiting to come back online, right as the world runs short on copper. That's growth most copper companies would kill for, and it doesn't require a single new discovery.
There's a bonus people forget. Grasberg isn't just copper. It's also one of the biggest gold mines in the world. Freeport gets paid on both legs of this boom.
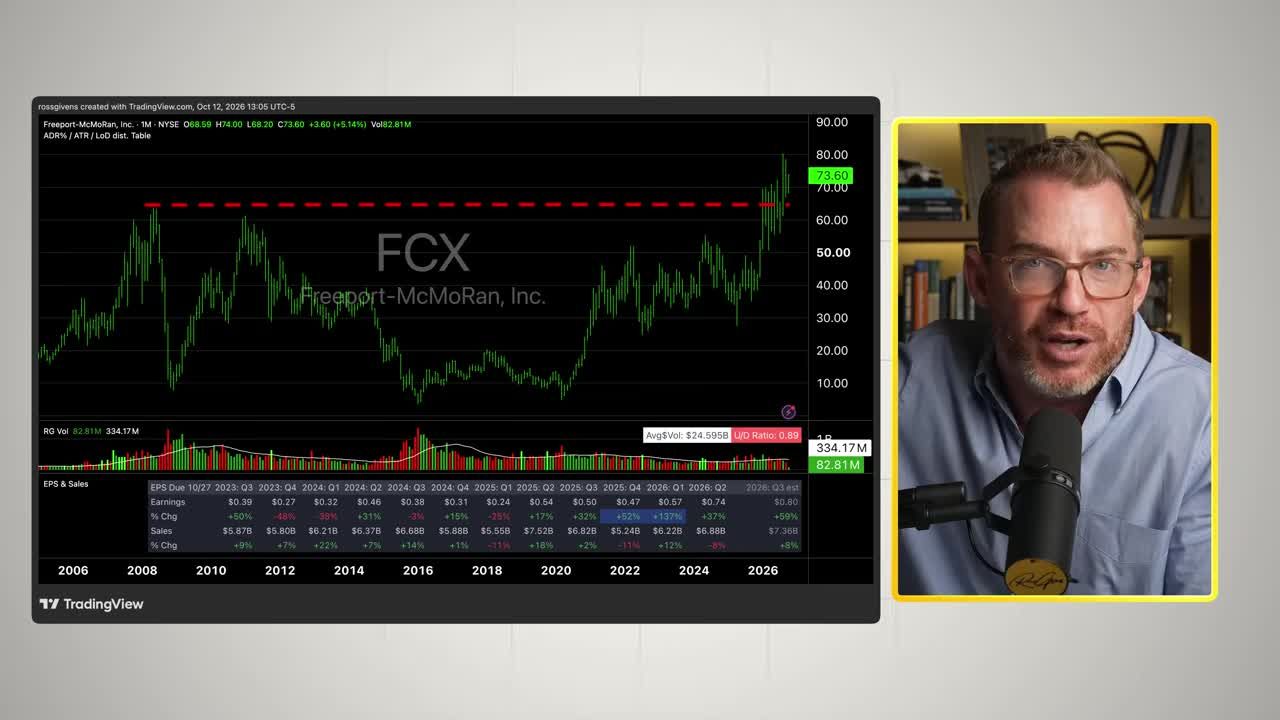
The stock trades in the low 70s and is up about 70% over the last year, trying to break out to new all-time highs. It's not the bargain-bin stock it was a decade ago. But zoom out. On a 20-year monthly chart, FCX is just barely above its 2008 peak.
Don't make the mistake of calling the run over after a couple of strong years when the stock went nowhere for 18. Freeport is about to sell a lot more copper into a market that doesn't have enough of it. That's a pretty good place to be.
Get an entire year of live weekly mentoring sessions, my newsletter, indicators, bonus reports, tons more. Click the link and I'll see you in the next live session.
Join my Black Ops Trading ClubWhy Does China Keep Buying Gold?
China's central bank already owns more than 2,300 tons of gold, and it keeps buying every single month. Analysts at Julius Baer say the main reason is political. After Russia invaded Ukraine in 2022, Western governments froze Russia's central bank money. China watched and learned the lesson: dollars held overseas can be frozen, gold in your own vault cannot.
So China has been selling U.S. Treasury bonds and buying gold instead. That isn't the only reason rates have risen, but it has contributed to the rise in interest rates.
And it isn't just the government. Chinese families are piling in for their own reasons. Real estate, where most households kept their savings, has been stuck in a slump for years. Bank deposits pay almost nothing. When your house is falling in value and your bank pays you a fraction of a percent, you buy gold.
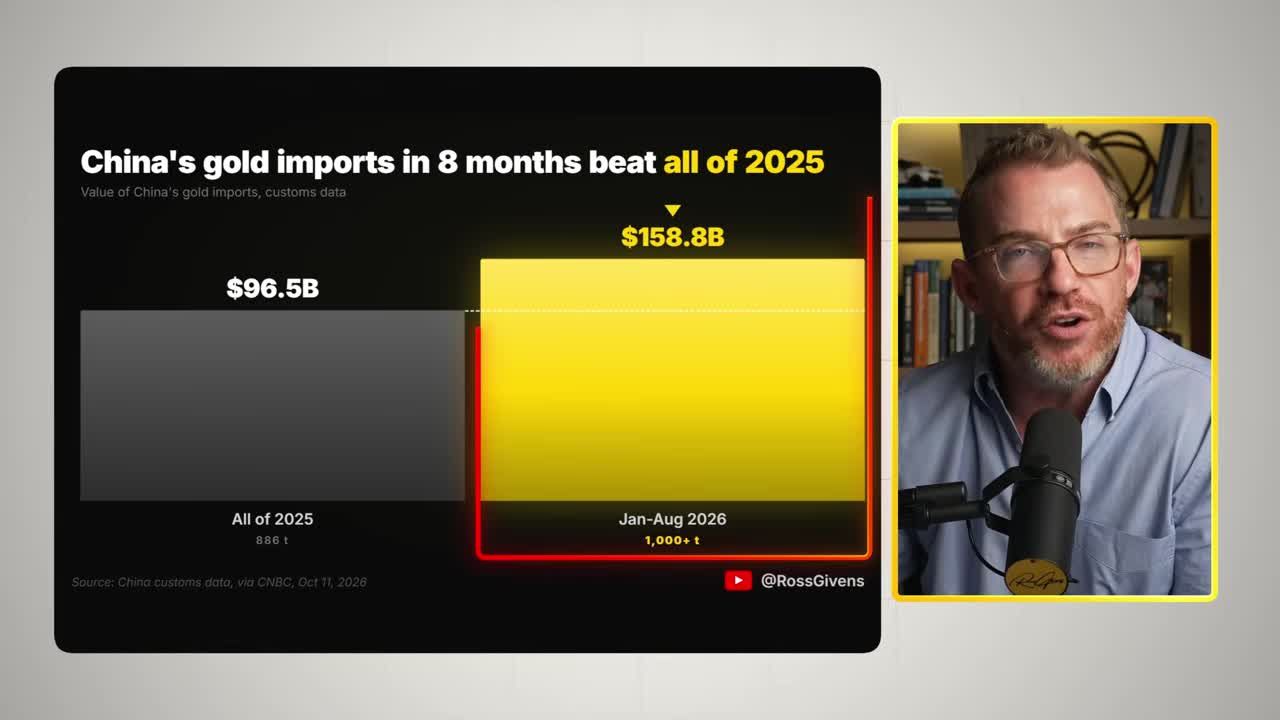
In just the first eight months of this year, China imported a record $158.8 billion worth of gold. That's more than all of last year combined, with four months still to go.
The 50-Year Record Just Fell
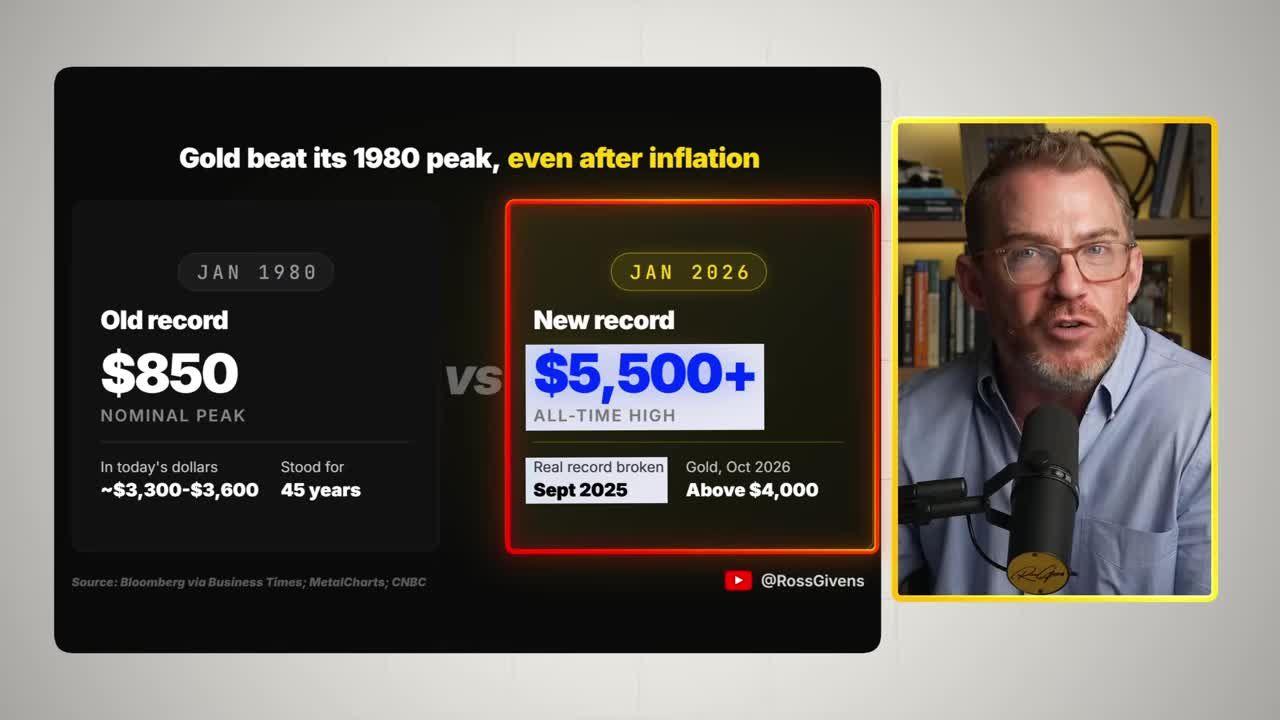
Here's the detail that tells me this is a real boom and not a fad. The old inflation-adjusted record for gold was set in January 1980. For 45 years, gold couldn't beat it. It finally broke through in September 2025, then ran to a new all-time high above $5,500 in January.
When somebody calls this the biggest commodity boom in 50 years, gold already made that case on its own.
Gold has pulled back since then and sits just over $4,000 an ounce. Honestly, I'm fine with that. A central bank that buys every month for two years isn't trading the chart. It's buying every dip.
The Gold Pick: Kinross Gold
I'd rather own gold through a miner than the metal itself, and my pick is Kinross Gold, ticker KGC. It's one of the bigger gold miners in the world, and we recommended it through my Alpha Stock Service two years ago. It ran 500% earlier this year, then pulled back, and now sits about 40% below its highs.
Gold is down roughly 17% from its January peak. Kinross is down more than twice that. Why the gap?
In September, Kinross said production this year and next would come in 2 to 3% below the low end of guidance, mostly because of bad weather and problems at two of its smaller mines. Two to three percent. On two small mines. Meanwhile, its two biggest, lowest-cost mines are running well.
In that same update, Kinross raised the share of free cash flow it plans to hand back to shareholders from 40% to 50%. It has already returned more than $1.5 billion since early 2025.
A company confident enough to hand you more cash while the market punishes it for a small miss is exactly the kind of disconnect worth paying attention to.
And remember the mechanic. Miners move faster than the metal because their costs stay fixed while profits swing. When gold falls, Kinross's costs don't change, so profit shrinks fast. When gold moves back toward its highs, that math works in reverse, and the profit swing at Kinross is a lot bigger than the swing in the gold price.
The same reason Kinross is down 40% right now is what could send it 50%, 60%, even 70% higher.
The Risks on Both Sides
There are obviously risks with both of these. That's why they're called investments and not guarantees.
- Copper: a global recession. If factories slow down, copper demand drops and the price can fall hard in the short run. That doesn't fix the 17-year supply problem. It only delays it.
- Gold: China changing its mind. Analysts at Saxo Bank say a real recovery in Chinese real estate and stocks could cool the pace of gold buying. I'd watch it. I wouldn't bet on it happening anytime soon.
Two Legs, One Boom
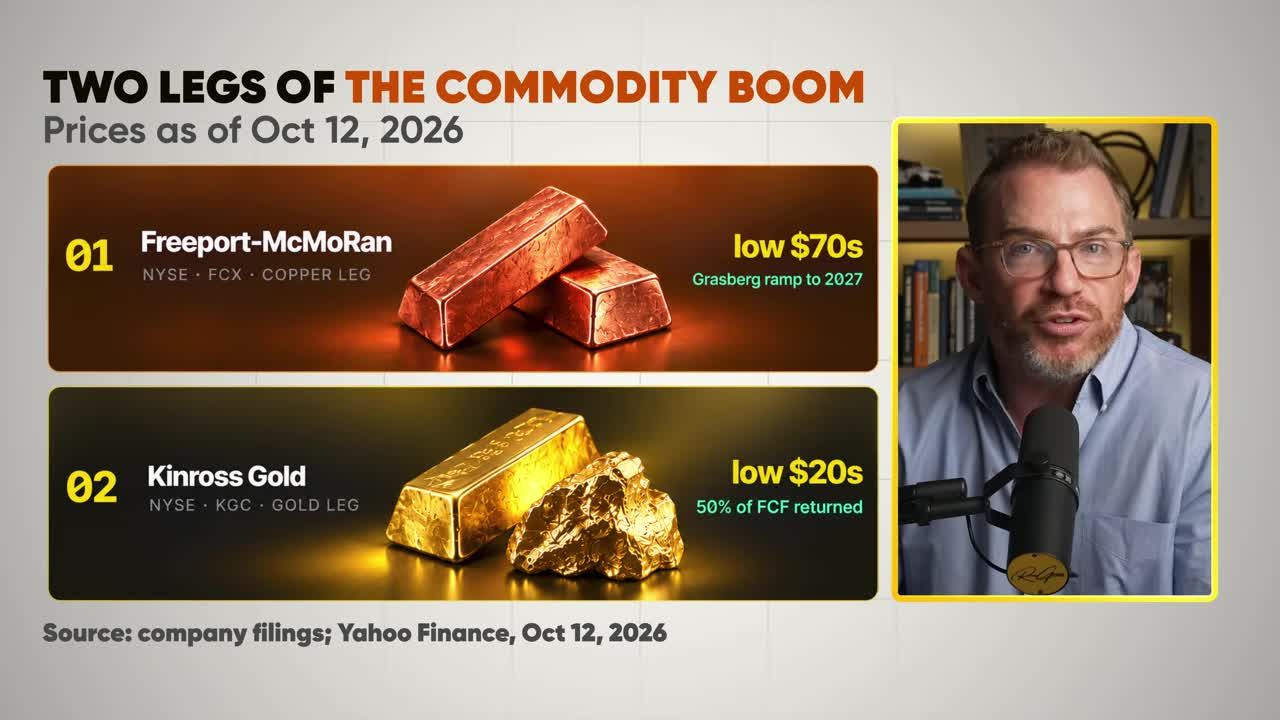
These are the two commodity boom stocks I'd use to ride both metals.
Freeport-McMoRan is the copper leg. It's the stronger stock, with a major mine coming back online directly into a shortage and a gold kicker on top through Grasberg. Freeport's filings are worth a read if you want the operating detail.
Kinross Gold is the gold leg. It's the beaten-up one, priced like a small production miss matters more than where gold itself is headed.
One's running, one's resting. Both get paid if this boom has as many years left as I think it does.
Every boom has a moment when people decide it's over, and it usually comes right after the first big pullback. Gold just had one. Copper will have one too. But a mine still takes 17 years to build, and China has been buying gold for 23 months straight without blinking. Neither of those things cares about one bad month on the screen.
I'd rather own the companies digging the metal out of the ground than wait for a headline to tell me it's safe.
Freeport and Kinross. That's where I'd start.
Get an entire year of live weekly mentoring sessions, my newsletter, indicators, bonus reports, tons more. Click the link and I'll see you in the next live session.
DISCLAIMER: Traders Agency does not offer financial advice. The information provided is for educational purposes only and should not be considered financial advice. Traders Agency is not responsible for any financial losses or consequences resulting from the use of the information provided. Trading carries inherent risks and may not be suitable for all individuals. You are advised to conduct your own research and seek personalized advice before making any investment decisions, recognizing the potential risks and rewards involved.
See more from Traders Agency on Google
Make us a preferred source and our market analysis will appear more prominently in your Google Search, Top Stories, and AI results.
Add to Preferred Sources