
Candlestick patterns are visual price formations that signal potential shifts in market direction based on how a candle (or group of candles) opens, trades, and closes. Every candle captures four pieces of information: the open, high, low, and close for a given period. Once you learn to read these shapes in sequence, you stop seeing just where price ended up and start seeing what buyers and sellers were actually fighting over.
By the end of this guide, you'll know the most reliable bullish and bearish patterns, how we confirm them before taking a trade, and the mistakes that cause most beginners to lose money chasing a candle that looked good in isolation.
This isn't about memorizing fifty shapes. It's about understanding the handful of candlestick patterns that show up often enough, and work well enough, to actually matter in your trading.
What Are Candlestick Patterns in Trading?
Bottom Line: Candlestick patterns for beginners only become useful when paired with confirmation, like volume or a close beyond a key level, rather than traded on shape alone. The real edge comes from knowing which few patterns repeat often enough to matter and avoiding the common mistake of acting on a candle in isolation.
Candlestick patterns are chart formations created by the open, high, low, and close of price over a set period, used to gauge the balance of power between buyers and sellers. Each candle tells a short story. Stack a few together and you get a narrative about who is winning the fight for control.
A candle's body shows the range between the open and the close. The wicks (also called shadows) show the high and low reached during that period. A long body with small wicks means one side dominated the session. A small body with long wicks means the session was a tug-of-war that ended close to where it started.
This matters because price is driven by order flow, not just headlines. Candlestick patterns are shorthand for reading that order flow directly off the chart, which is why they've stayed useful across stocks, futures, forex, and crypto for decades.
Key Concept: A candlestick shows you how price got to its closing level, not just where it closed. The body reveals who won the session. The wicks reveal how hard the other side fought.
What Are the Top 5 Bullish Candlestick Patterns?
If you're going to commit a short list to memory, start with these five bullish formations:
- Hammer: A small body near the top of the candle with a long lower wick, appearing after a downtrend. Sellers pushed price down, but buyers forced it back up before the close.
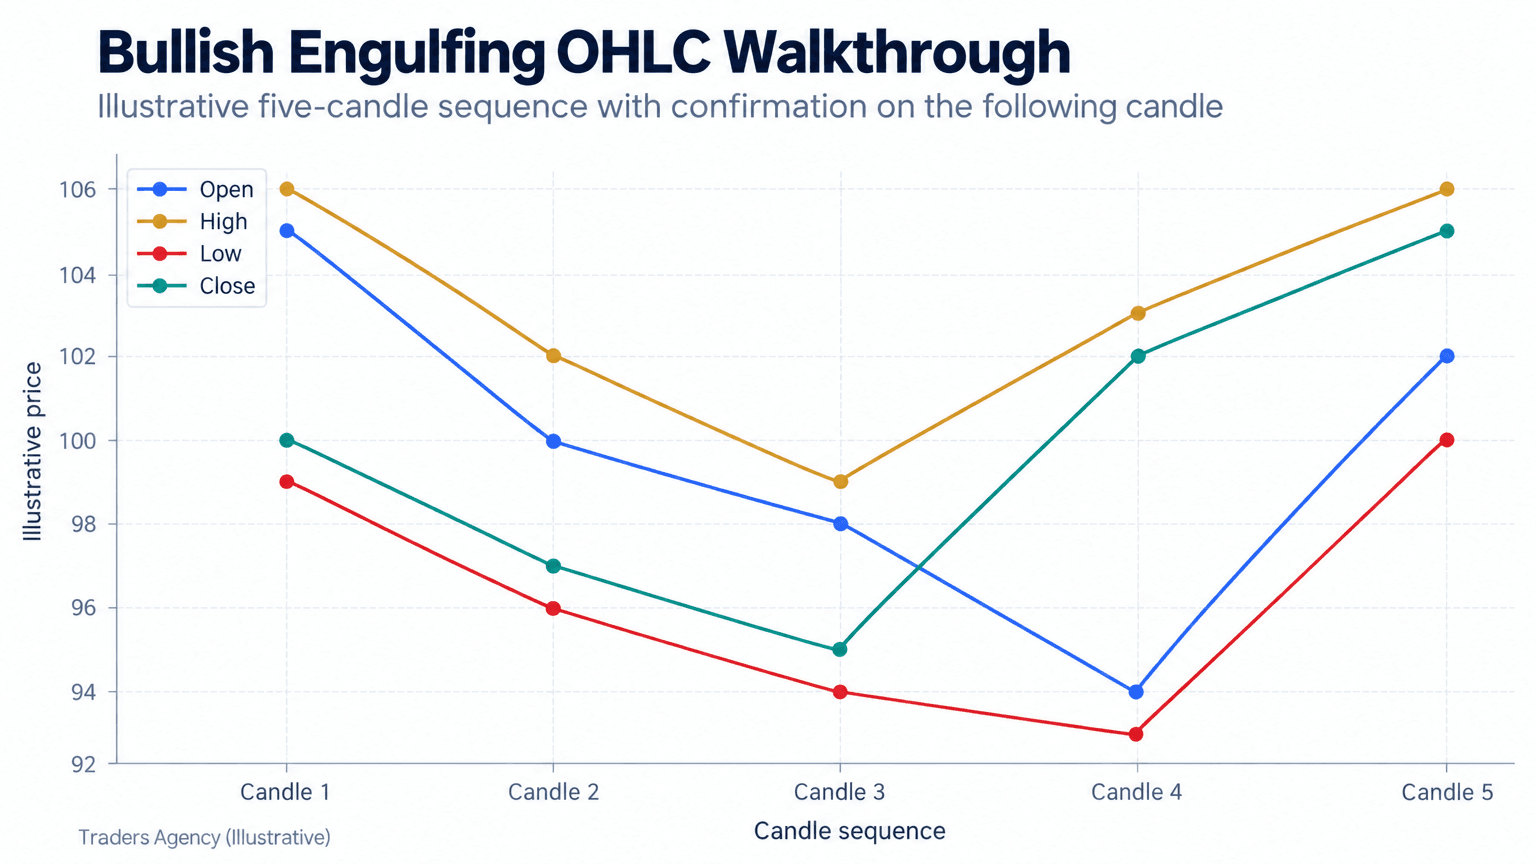
- Bullish Engulfing: A large green candle that completely engulfs the prior red candle's body, showing buyers overwhelming the previous session's selling.
- Morning Star: A three-candle sequence consisting of a long red candle, a small-bodied candle (indecision), then a strong green candle closing back above the midpoint of the first candle.
- Piercing Line: A red candle followed by a green candle that opens lower but closes above the midpoint of the prior candle's body.
- Three White Soldiers: Three consecutive green candles, each closing higher than the last with small wicks, showing sustained buying pressure across multiple sessions.
These patterns work best when they appear after a clear downtrend or at a known support level, not in the middle of sideways chop.
What Are the Most Common Bearish Candlestick Patterns?
Bearish candlestick patterns suggest sellers are taking control after a period of buying, and they typically appear near resistance or at the top of an uptrend. Learning these is just as important as the bullish side, because avoiding a bad long trade is worth just as much as catching a good one.
Here are the bearish formations our team watches for:
- Shooting Star: Small body near the bottom, long upper wick, appearing after an uptrend. Buyers pushed price up, then sellers slammed it back down.
- Bearish Engulfing: A large red candle that fully engulfs the prior green candle's body, signaling sellers have taken over.
- Evening Star: The bearish mirror of the morning star, a three-candle sequence marking a potential top.
- Dark Cloud Cover: A green candle followed by a red candle that opens above the prior close but closes below its midpoint.
- Hanging Man: The same shape as a hammer, but it appears after an uptrend, which flips the meaning from bullish to bearish.
Notice that shape alone doesn't tell you the signal. A hammer and a hanging man look nearly identical on the chart.
Key Concept: Context is what separates a real signal from noise. Where a pattern forms relative to the existing trend matters more than the shape itself.
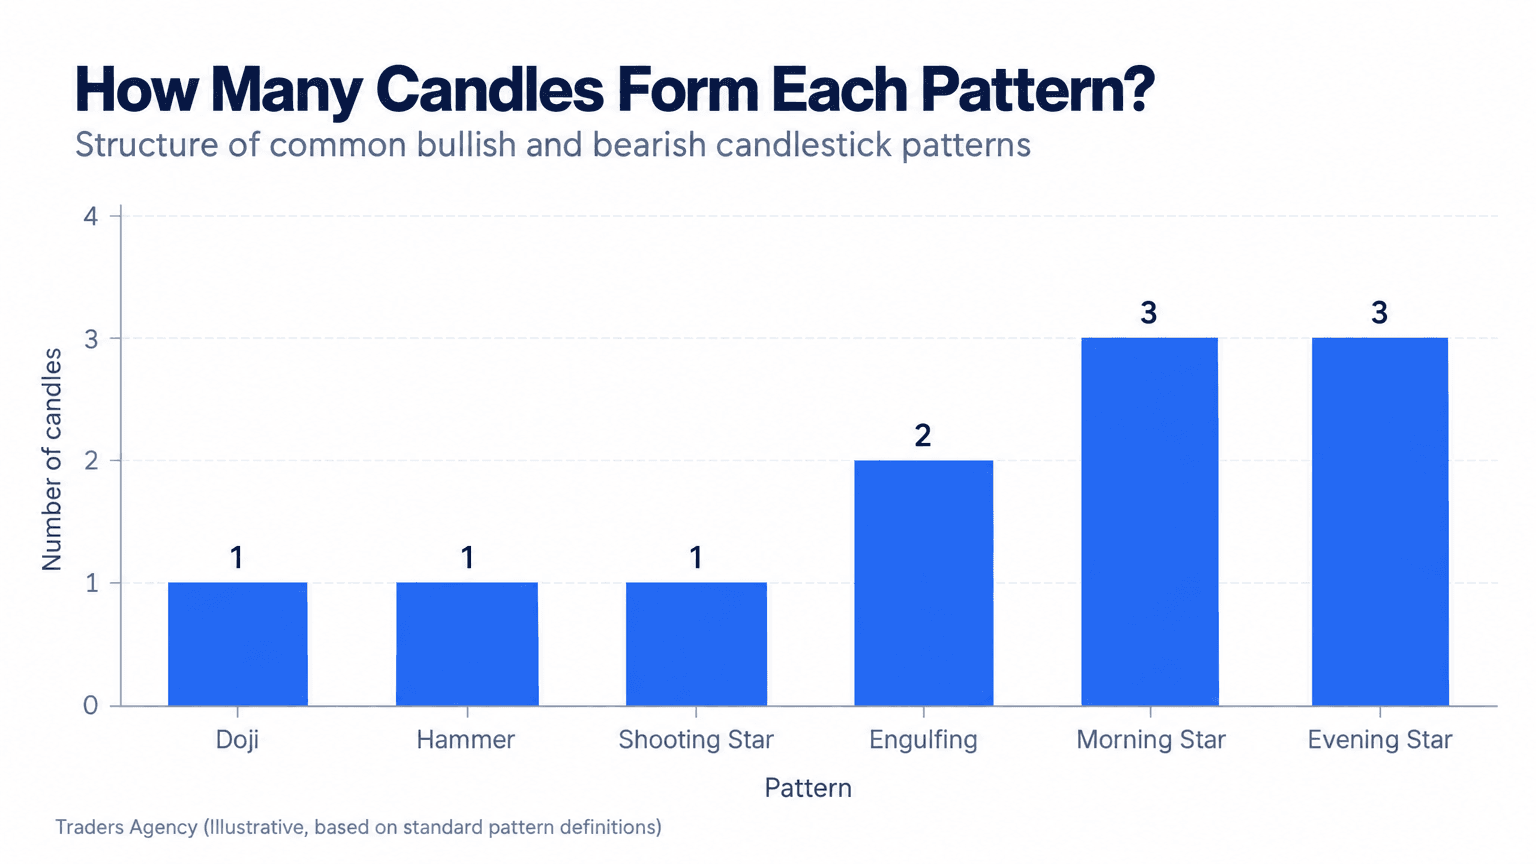
Single-Candle vs. Multi-Candle Patterns
Single-candle patterns like the doji and hammer give you a signal from just one bar. That makes them fast to spot but easier to fake out. Multi-candle patterns like engulfing setups (two candles) or morning and evening stars (three candles) take longer to form, which generally makes them more reliable but slower to trigger.
Step-by-Step: Reading a Single Candle Into a Confirmed Setup
Here's a walkthrough using a hypothetical stock trading around $48:
- Step 1: Spot the Decline. The stock drops over three sessions from $52 to $48, establishing the downtrend that gives a reversal pattern meaning.
- Step 2: Identify the Single-Candle Signal. A hammer forms with a low wick down to $46.50 before closing back at $48.20. On its own, this is a clue, not a trade.
- Step 3: Wait for Confirmation. The next session opens at $48.50 and closes at $51, a strong green candle that closes above the hammer's high. That is your two-candle agreement.
- Step 4: Define Risk Before Entry. Place the stop just beyond the signal candle's wick, below $46.50, and size the position so a failed signal costs you only a small slice of the account.
| Element | Level | What It Tells Us |
|---|---|---|
| Prior trend | $52 down to $48 | Downtrend in place, reversal pattern is relevant |
| Hammer low (wick) | $46.50 | Sellers pushed, buyers rejected the low |
| Hammer close | $48.20 | Buyers closed near the top of the range |
| Confirmation close | $51.00 | Follow-through above the hammer's high |
| Stop reference | Just below $46.50 | Signal is invalidated if price trades through the wick |
Want expert trading insights delivered daily?
Join thousands of traders who rely on Traders Agency for market analysis and trade ideas.
Join Traders AgencyHow Do You Confirm a Candlestick Pattern?
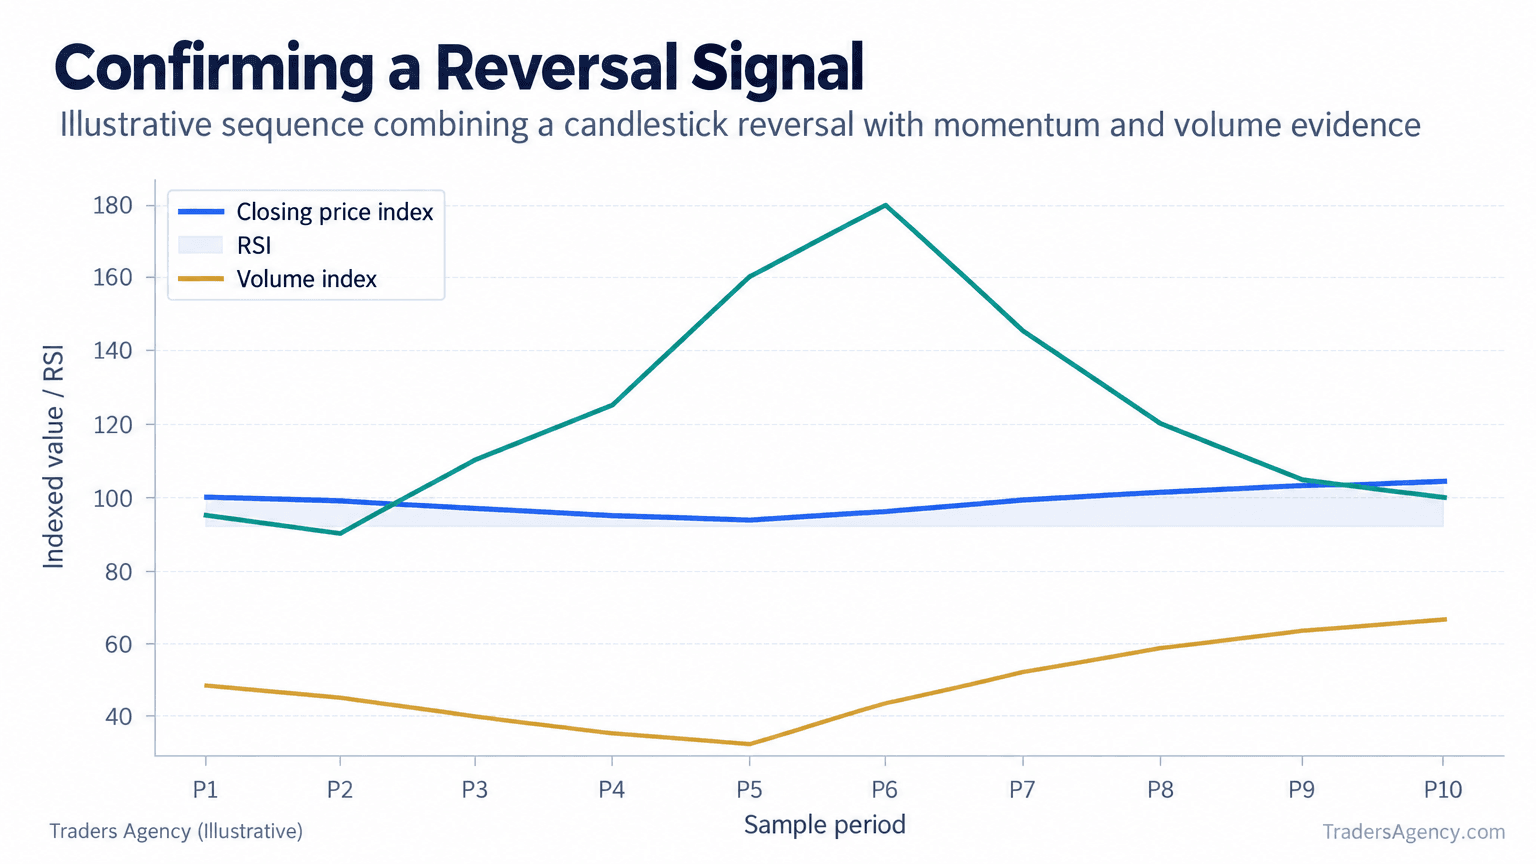
You confirm a candlestick pattern by waiting for the next candle (or two) to close in the direction the pattern suggested, ideally alongside support or resistance, a shift in volume, or a momentum reading like RSI moving out of overbought or oversold territory. Confirmation cuts down the number of false signals you act on.
Go back to our example: the hammer at $48 only became tradable once the following candle confirmed it by closing at $51. Had that next candle instead closed red and made a new low, the hammer signal would have failed, and acting on it alone would have put you in a losing trade.
We also like to see volume expand on the confirmation candle. A reversal candle on light volume is a weaker signal than the same shape backed by heavier participation, because real participation means more traders are standing behind the move.
What Is the Best Candlestick Pattern to Trade?
There's no single best candlestick pattern, but bullish engulfing and bearish engulfing are the strongest starting points for most traders. They require two candles of agreement rather than one, and they show a clear, visible shift in control.
That said, the "best" pattern always depends on context. An engulfing candle at a major support level on the daily chart carries far more weight than the same shape in the middle of a range on a 5-minute chart. We teach members to rank setups by where they occur, not just what they look like.
What Mistakes Do Beginners Make When Trading Candlestick Patterns?
The mistakes we see most often are trading the shape without considering the surrounding trend, skipping confirmation, and using patterns on timeframes too short to carry real signal.
- Ignoring the trend: A hammer inside a strong, healthy uptrend isn't a reversal signal. It's noise.
- No confirmation: Entering the moment a pattern forms, before the next candle closes, is one of the fastest ways to get stopped out.
- Wrong timeframe: Patterns on a 1-minute chart generate far more false signals than the same pattern on a daily or 4-hour chart. We generally favor the daily and 4-hour timeframes for higher-conviction signals.
- Trading in isolation: Relying on candlesticks alone, with no support, resistance, or volume context, strips away most of their value.
- Memorizing without practicing: Downloading a reference sheet and studying shapes is fine, but pattern recognition only sticks once you've marked them up on live charts.
Watch Out: A pattern with no confirmation candle is a hypothesis, not a trade. Entering early on a shape you like is the single most common way beginners turn a good pattern into a bad loss.
Combining Candlestick Patterns With Other Indicators
Candlestick patterns work best when paired with a second, independent signal such as RSI, a moving average, or a support and resistance zone. That combination filters out weaker setups and raises conviction on the trades you do take.
For example, a bullish engulfing pattern that forms right as RSI crosses back above 30 from oversold territory, at a prior support zone, is a far stronger setup than the same candle appearing with RSI sitting at 55 in no-man's land. We call that stacking confluence: price pattern, momentum, and structure all agreeing at once.
Our Pre-Entry Checklist
- Does the pattern appear at a meaningful support or resistance level?
- Did the next candle confirm the direction?
- Is volume supporting the move?
- Does a momentum indicator like RSI agree with the signal?
- Is the timeframe appropriate for the trade you're planning (swing vs. intraday)?
When Should You Use Candlestick Patterns, and When Should You Avoid Them?
Candlestick patterns are most useful at turning points: near established support, near resistance, or after an extended trend, and on timeframes of 4-hour or higher where noise is lower. They're least reliable in choppy, low-volume, sideways markets where every candle looks like a reversal that never follows through.
Risk management still matters even with a clean, confirmed signal. We recommend risking no more than 1% to 2% of account equity per trade, placing stops just beyond the wick of the signal candle, and sizing positions so a single false signal does no lasting damage.
Risk Warning: No candlestick pattern wins every time. Position sizing, not pattern selection, is what keeps a string of failed signals from ending your trading account.
Keeping a printed reference chart near your desk while you build pattern recognition is perfectly reasonable. Standard definitions published by exchanges, including educational material from CME Group, are useful for cross-checking a textbook definition. The goal, though, is to eventually recognize these setups on a live chart without looking anything up.
FAQ: Candlestick Patterns for Beginners
What is the best candlestick pattern to trade?
Engulfing patterns, both bullish and bearish, are among the most reliable for newer traders because they require two candles of agreement, which reduces false signals compared to single-candle patterns.
What are the top 20 candlestick patterns?
Most traders only need a core group of 8 to 10: the hammer, hanging man, doji, bullish and bearish engulfing, morning and evening stars, shooting star, piercing line, and dark cloud cover. Memorizing all twenty-plus named patterns adds complexity without adding edge.
What is the 3 candle rule?
The 3 candle rule refers to three-candle reversal patterns like the morning star and evening star, where the middle candle shows indecision and the third candle confirms the new direction.
What are the top 5 bullish candlestick patterns?
The hammer, bullish engulfing, morning star, piercing line, and three white soldiers are the five most commonly referenced bullish formations.
Do candlestick patterns work on all timeframes?
They form on any timeframe, but signals on 4-hour and daily charts tend to be more reliable than the same patterns on 1-minute or 5-minute charts.
Can I learn candlestick patterns for free?
Yes. Charting tools with candlestick views are standard at virtually every broker at no extra cost, and the fastest way to learn is marking up live charts daily rather than reading about shapes.
Want expert trading insights delivered daily?
Join thousands of traders who rely on Traders Agency for market analysis and trade ideas.
Join Traders AgencyDISCLAIMER: Traders Agency does not offer financial advice. The information provided is for educational purposes only and should not be considered financial advice. Traders Agency is not responsible for any financial losses or consequences resulting from the use of the information provided. Trading carries inherent risks and may not be suitable for all individuals. You are advised to conduct your own research and seek personalized advice before making any investment decisions, recognizing the potential risks and rewards involved.
See more from Traders Agency on Google
Make us a preferred source and our market analysis will appear more prominently in your Google Search, Top Stories, and AI results.
Add to Preferred Sources