

The volatility in gold just compressed to its tightest reading since August of 2025. The last time it coiled up this tight, it ran 60% over the next five months. This gold breakout 2025 setup is exactly the moment I've been waiting for all year.
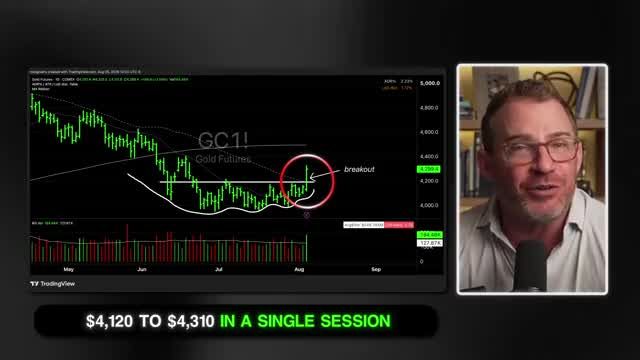
Wednesday morning, gold finally broke out. It shot from 4,100 to 4,300 in a single session, and I started buying immediately.
This setup is not just technical. Massive fundamental forces are driving the move, and the smart money is already positioned for what could be a historic run.
What Triggered Gold's Best Single-Session Move Since February?
Bottom Line: The gold breakout 2025 thesis rests on a rare convergence: maximum volatility compression, 289 tons of central bank accumulation, and the exhaustion of panic sellers near the $4,000 level. The two-month consolidation was not stagnation but a coiling of energy, and Wednesday's $200 single-session surge is the release. The next major leg higher is underway, and the floor built by institutional buyers makes the risk-reward unusually favorable for disciplined entries.
What triggered the explosive single-session move
Wednesday delivered gold's best single-session move since February, pushing the price from 4,100 to 4,300. The trigger was extreme volatility compression that finally released.
Central banks and institutional buyers have quietly absorbed the available supply. That set the stage for the gold breakout 2025 we just witnessed.
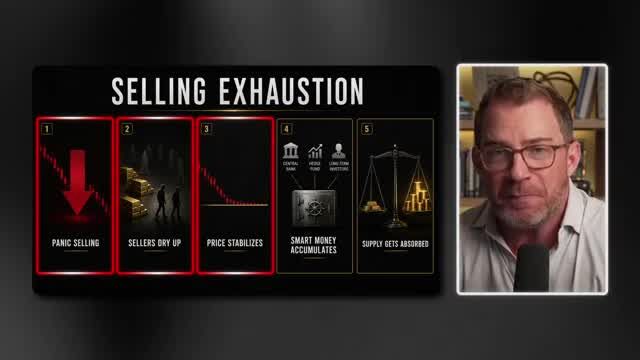
When an asset stops falling, that is confirmation the panic selling is done. Gold fell to 4,000 an ounce earlier this year, a key area I identified as a good buy point. Then it went nowhere for two months. Watching paint dry.
To most people, that looks like a dead market. It is actually a market where sellers are running out and buyers are stepping in.
Once gold falls 30%, everybody who wanted out has gotten out. The short sellers have made their money. The smart investors, hedge funds, and central banks begin accumulating metal. Supply gets absorbed, and you can spot it on the chart because the daily swings shrink. Each dip is smaller than the last, and each one is met with aggressive buying.
The Signal That Fired First
How volatility compression predicts the breakout
This compression is visible on the chart, and it is also measurable. A Bollinger band gives a reading of how calm or volatile an asset is. The wider the lines, the higher the volatility.
A few nights ago, the Bollinger band on gold printed its lowest reading since August of 2025.
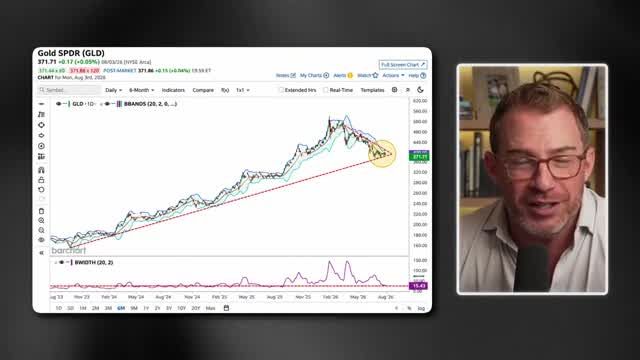
Volatility does not stay compressed forever. It eventually expands. It acts like a spring wound up tight, waiting to explode as it releases its energy. That explosion is what is happening right now, which is why I am treating this breakout as a major buying opportunity.
Why Did Central Banks Buy 289 Tons of Gold?
The biggest buyers are stacking at a record pace
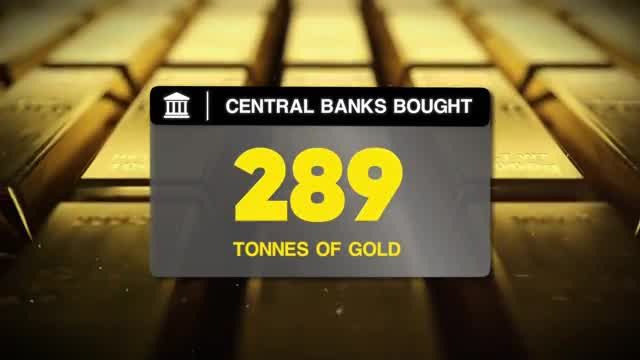
The biggest buyers of gold are central banks. They are the entities capable of actually moving the price. Between April and June, they bought 289 tons, the biggest second quarter the World Gold Council has ever recorded.
Countries across the globe are getting out of the dollar. They are selling US Treasuries and buying metal.
- Poland: Added 82 tons this year, bringing its total to 632 tons, an all-time record. Officials have publicly said they are going to 700.
- Uzbekistan: Added 41 tons to its reserves.
- Historical pace: Central banks bought over 1,000 tons a year in 2022, 2023, and 2024.
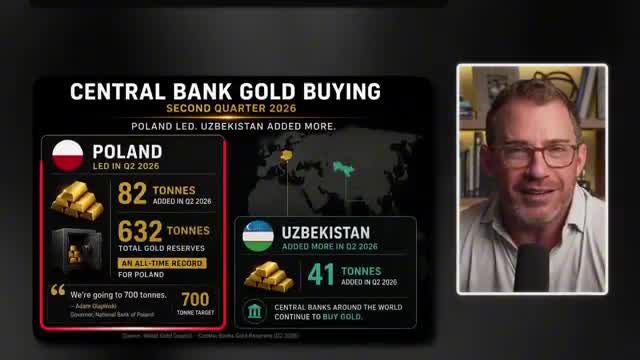
The World Gold Council recently revised the first quarter data, reclassifying a large chunk of the 244 tons out of central bank buying and into over-the-counter buying. That just means institutions bought it instead of governments. Either way, the smart money is accumulating.
They see the debt and the debasement of the currency. They know gold is the only safe haven. I expect 2026 to end up with even higher accumulation numbers.
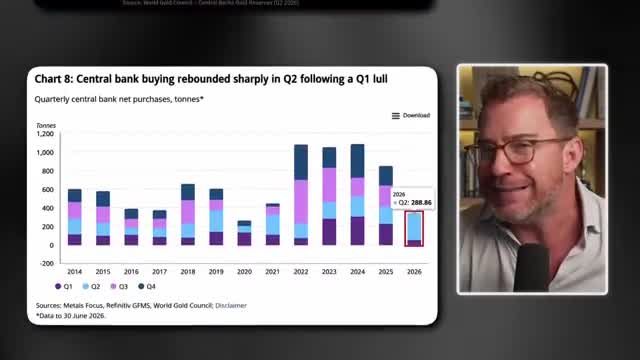
Data sourced from the World Gold Council.
China Shut Down Paper Gold
Why July 24th changed the game
On July 24th, China banned paper gold trading for its retail customers. When most people buy gold, no physical metal moves anywhere. A bank or exchange sells a contract saying you own an ounce, and the bar supposedly sits in a vault. Most buyers never ask for it. They do not want to store, insure, or guard the metal. They just want to sell the contract later for a profit.
Because sellers know buyers will never demand delivery, they can sell claims on the same ounce two, five, or ten times. This creates what I call phantom supply.
There could be ten paper claims floating around for every one real ounce. The market sees ten times more gold than actually exists, which means it takes ten times the buying pressure to move the price. Nobody knows the true ratio of paper claims to real bars in the vaults in London and New York.
Physical gold cannot be copied like a digital file. Authenticity in the financial markets is settled by physical delivery, and China put an end to the paper games.
The Shanghai Gold Exchange now settles in physical metal. When a trade clears, a real bar has to move from the seller's vault to the buyer's vault. You cannot sell ten claims on one bar anymore.
To support the shift, the gold vault at Hong Kong's international airport is being expanded from 150 tons of capacity to 1,000 tons. That is 2.2 million pounds of gold.
Get an entire year of live weekly mentoring sessions, my newsletter, indicators, bonus reports, tons more. Click the link and I'll see you in the next live session.
Join my Black Ops Trading ClubWho Built the Floor Under Gold Prices?
Institutional money quietly flowing back to gold
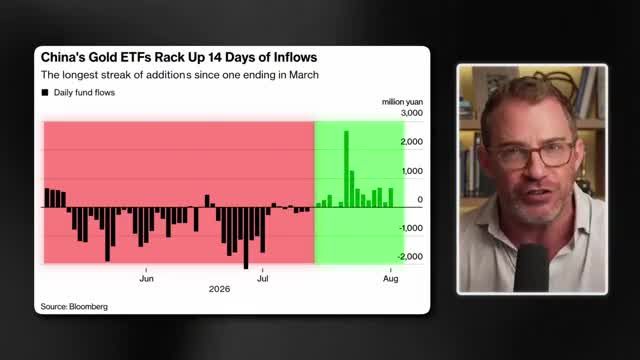
Chinese gold ETFs spent most of the summer bleeding money. Capital flowed out day after day for two straight months. Then, in the middle of July, the trend flipped completely.
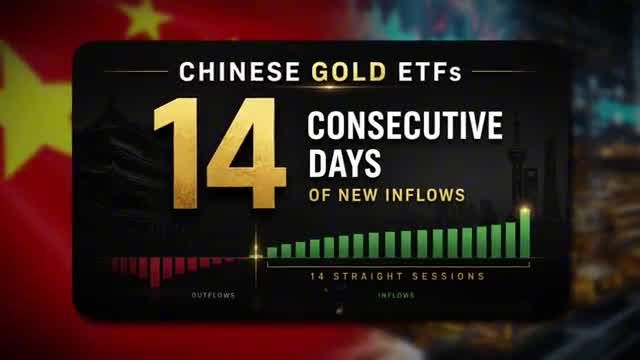
We saw 14 consecutive sessions of inflows, the longest streak since March, with one single day pulling in over two billion.
You have to understand why that money keeps finding its way back. Chinese property has been a disaster for years, and home prices are still falling. The currency is a joke, and strict capital controls make it incredibly hard to move money out of the country.
When a Chinese saver wants to protect their wealth, the list of options is short. Gold keeps coming up at the top of it. You have 1.4 billion Chinese citizens whose only gold option is physical metal.
China is done holding US Treasuries while America prints trillions every year. They are shoring up their reserves and making sure their citizens do the same.
Is Gold Headed to $10,000?
My target over the next two to three years
My target for gold is $10,000 to $12,000 an ounce over the next two to three years. The fundamental drivers are locked in, physical supply is tightening, and the technical setup is clean.
Gold skyrocketed in 2025, but the first half of 2026 was a massacre. It based out, consolidated, and formed a shallowing consolidation base. Now we have a clean breakout to the upside on above-average volume. Textbook price action, and it confirms the gold breakout 2025 thesis I laid out earlier.
I expect gold to be meaningfully higher by the end of this year, and I believe it will cross $6,000 in 2027.
How I'm Trading the Gold Breakout 2025
Exact entries for the second half rally
I still own physical gold. I still own miners in my retirement account. None of that has changed. But right now, we have a really nice swing trade entry. Here is exactly how I am playing it.
1. Micro Gold Futures (MGC)
I initially bought one standard gold contract (GC). One GC contract is 100 ounces of gold. At $4,300 an ounce, that is $430,000 worth of gold. I believe in gold, but I did not want to sling half a million dollars at a single swing trade.
Instead, I bought a micro gold contract (MGC). You can trade these at Interactive Brokers, TradeStation, or most major brokers. The micro is exactly 10 ounces. At current prices, that is $43,000 worth of gold instead of $430,000. Much more reasonable. You can trade these on margin, requiring only $5,000 to $10,000 to hold the position.
2. ETFs for Retirement Accounts
If you want an easy way to trade this in a retirement or brokerage account, there is GLD. It is the gold shares ETF, and it moves directly with the price of gold. You can buy it just like a stock in any IRA.
There is also GLDM, the mini shares version. Same custodian, no difference in structure, but the share price is lower and the expenses are lower. GLD was designed for institutions. GLDM was designed for everyday people. The smaller price lets you buy a more precise number of shares.
3. Define Your Risk and Stop Loss
The proper buy point for a precise entry was right through the highs at 4180. I jumped in slightly later when I got to the office. By trading the micro contract, I am risking about 4.5% to 5% of $40,000, which is roughly $2,000.
My stop loss sits beneath the swing low at 4060. My big line in the sand is down at the 3975 level. It consolidated there in November, bounced off it in March, and based there for a couple of months before pushing higher. It should not break below that level.
The Physical Market Takes Control
The era of paper gold suppressing the true price of the metal is ending. With China demanding physical delivery and central banks accumulating at a record pace, the phantom supply is losing its grip.
The technicals are perfectly aligned with the fundamentals. We just witnessed the tightest volatility compression since August of 2025, followed immediately by a high-volume gold breakout 2025. The smart money has built a massive floor underneath this market.
You do not need to risk massive amounts of capital to participate. Whether you use micro futures or standard ETFs, the key is to manage your risk and respect your stop loss.
The panic selling is over. The buyers have stepped in. The next major leg higher has officially begun.
Get an entire year of live weekly mentoring sessions, my newsletter, indicators, bonus reports, tons more. Click the link and I'll see you in the next live session.
Key Takeaways
- Gold volatility compressed to its tightest reading since August 2025, mirroring a setup that previously preceded a 60% rally over five months.
- Wednesday's breakout session pushed gold from $4,100 to $4,300 in a single day, the best single-session move since February.
- Gold's earlier pullback to $4,000 followed by two months of sideways action was the accumulation phase, with central banks and institutional buyers quietly absorbing supply.
- Central banks purchased 289 tons during the consolidation period, building a structural floor under the market.
- Suggested entry risk management: use micro futures or standard ETFs like GLD, IAU, or SGOL, with a defined stop loss rather than oversized position sizing.
DISCLAIMER: Traders Agency does not offer financial advice. The information provided is for educational purposes only and should not be considered financial advice. Traders Agency is not responsible for any financial losses or consequences resulting from the use of the information provided. Trading carries inherent risks and may not be suitable for all individuals. You are advised to conduct your own research and seek personalized advice before making any investment decisions, recognizing the potential risks and rewards involved.
See more from Traders Agency on Google
Make us a preferred source and our market analysis will appear more prominently in your Google Search, Top Stories, and AI results.
Add to Preferred Sources