
Dividend yield vs growth is the core tradeoff income investors face when building a portfolio: do you chase a higher current payout, or accept a smaller check today in exchange for payouts that climb every year? Both paths can build wealth, but they behave very differently over a 10 or 20 year holding period. By the end of this guide, you'll know how to calculate each metric, evaluate whether a payout is sustainable, and build a portfolio that matches your actual income timeline.
We teach this distinction to our members constantly because it's one of the most misunderstood concepts in income investing. A stock paying 6% today can easily underperform a stock paying 2% today once you run the math out far enough. That's not a trick, it's compounding, and it's the entire reason this comparison matters.
What Is the Difference Between Dividend Yield and Dividend Growth?
Bottom Line: Dividend yield and dividend growth solve different problems: yield suits investors who need income now, while growth compounds into a larger income stream over 10-20 years, often overtaking a higher starting yield. The practical answer isn't choosing one camp but matching the mix to your timeline, checking payout sustainability, and sizing positions so no single holding can derail the plan.
Dividend yield is the annual dividend per share divided by the current stock price, expressed as a percentage. Dividend growth is the rate at which a company increases that dividend payment year over year, regardless of what the current yield looks like.
A stock trading at $50 paying $2.50 per share annually has a 5% yield. That number tells you nothing about the future. A company could hold that $2.50 payout flat for a decade, or raise it 10% every year. Yield is a snapshot. Growth is a trajectory.
This is why yield vs dividend comparisons trip up newer investors. Two stocks can show identical yields today and deliver wildly different income five years from now, depending entirely on their growth rate. We calculate both numbers before adding anything to an income portfolio, never just one.
Key Concept: Yield tells you what a stock pays right now relative to its price. Growth tells you how fast that payment is likely to rise. A stock can carry a high yield with zero growth, or a modest yield with aggressive growth, and these are two completely separate characteristics of the same dividend.
Is Dividend Yield the Same as Dividend Growth?
No. Yield measures the payout relative to today's share price, while growth measures how fast that payout increases over time. You'll find both figures on most brokerage screeners, in company investor relations pages, and in quarterly filings with the SEC. We recommend checking at least five years of dividend history before assuming a growth rate will continue.
Dividend Growth Stocks vs. High Dividend Yield Stocks: Which Is Better?
High-yield stocks pay more cash right now. Dividend growth stocks pay less now but compound their payout faster, often overtaking the high-yield stock's income within 15 to 20 years.
Picture two companies. Stock A yields 6% today but only raises its dividend 2% annually, often because it's already stretched thin on cash flow. Stock B yields 2% today but raises its dividend 8% annually, reinvesting aggressively while still rewarding shareholders.
| Characteristic | Stock A (High Yield) | Stock B (Dividend Growth) |
|---|---|---|
| Starting Yield | 6% | 2% |
| Annual Dividend Growth | 2% | 8% |
| Initial Investment | $10,000 | $10,000 |
| Approximate Income Crossover | Year 20 | |
Run a $10,000 investment in each for 20 years. Stock A's income grows slowly and steadily. Stock B starts smaller, but the compounding math eventually flips the script entirely, which is the classic argument behind dividend yield vs growth stocks debates you'll see across online investing forums.
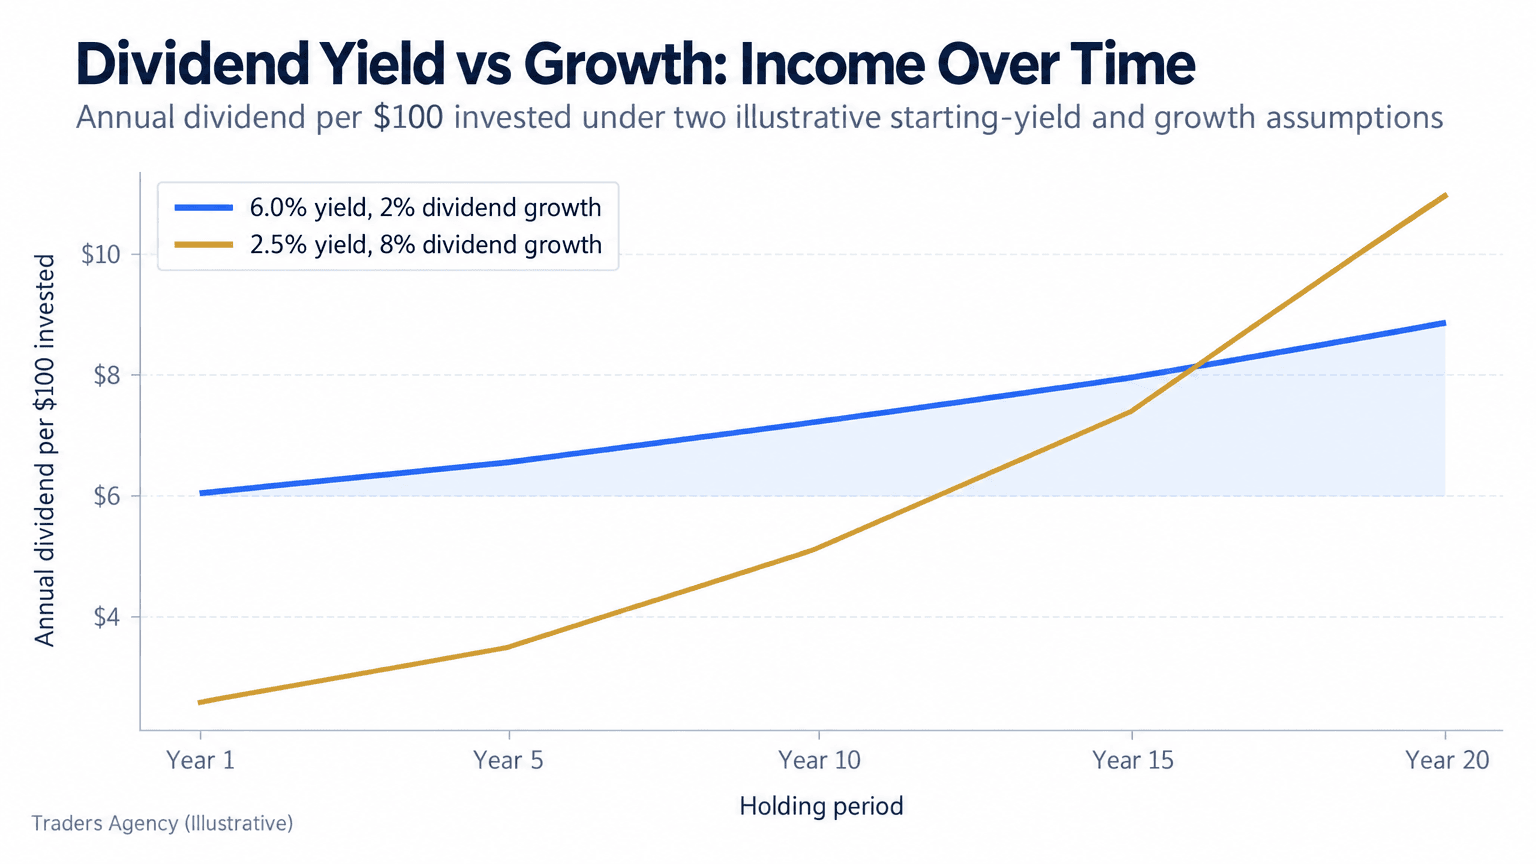
Notice the crossover point. Somewhere near year 20 in this illustration, Stock B's annual income payment passes Stock A's, and the gap widens every year after that. This is the single most important chart we show members when they ask which is better: dividend stocks or growth stocks.
Which Is Better for Long-Term Performance?
Neither approach is universally better. The right answer depends on your time horizon, your need for current income, and how many years you have left to let compounding work.
If you need cash flow now, high yield wins on paper. If you're investing for a goal 15+ years away, dividend growth usually wins on total return. Growth tends to pull ahead the longer you hold, and here's how we evaluate that tradeoff with members:
- Factor in reinvestment, not just the raw yield number: A 6% yield that never grows, left un-reinvested, produces a flat income stream forever. That's fine for retirees drawing cash, but it's a poor fit for anyone still accumulating.
- Compare total return, not just dividend income: Dividend growth companies often pair rising payouts with rising share prices, since the market rewards companies that can consistently increase cash returned to shareholders.
- Check the company's dividend history: Dividend Aristocrats have raised dividends for 25+ consecutive years. Dividend Kings have done it for 50+ years. Both lists are useful starting points when screening for growth-oriented holdings with proven discipline.
Want expert trading insights delivered daily?
Join thousands of traders who rely on Traders Agency for market analysis and trade ideas.
Join Traders AgencyThe Advantages of Dividend Growth Stocks
Dividend growth stocks tend to come from companies with lower payout ratios, stronger balance sheets, and more room to keep raising their dividend without straining cash flow. They also tend to hold up better during market stress.
How DRIP Compounding Accelerates Returns
A Dividend Reinvestment Plan (DRIP) automatically uses your dividend payment to buy more shares of the same stock, commission-free in most cases. Those new shares then generate their own dividends next quarter, which buy even more shares.
Over short periods this looks negligible. Over 20 or 30 years, it's one of the most powerful forces in building wealth.
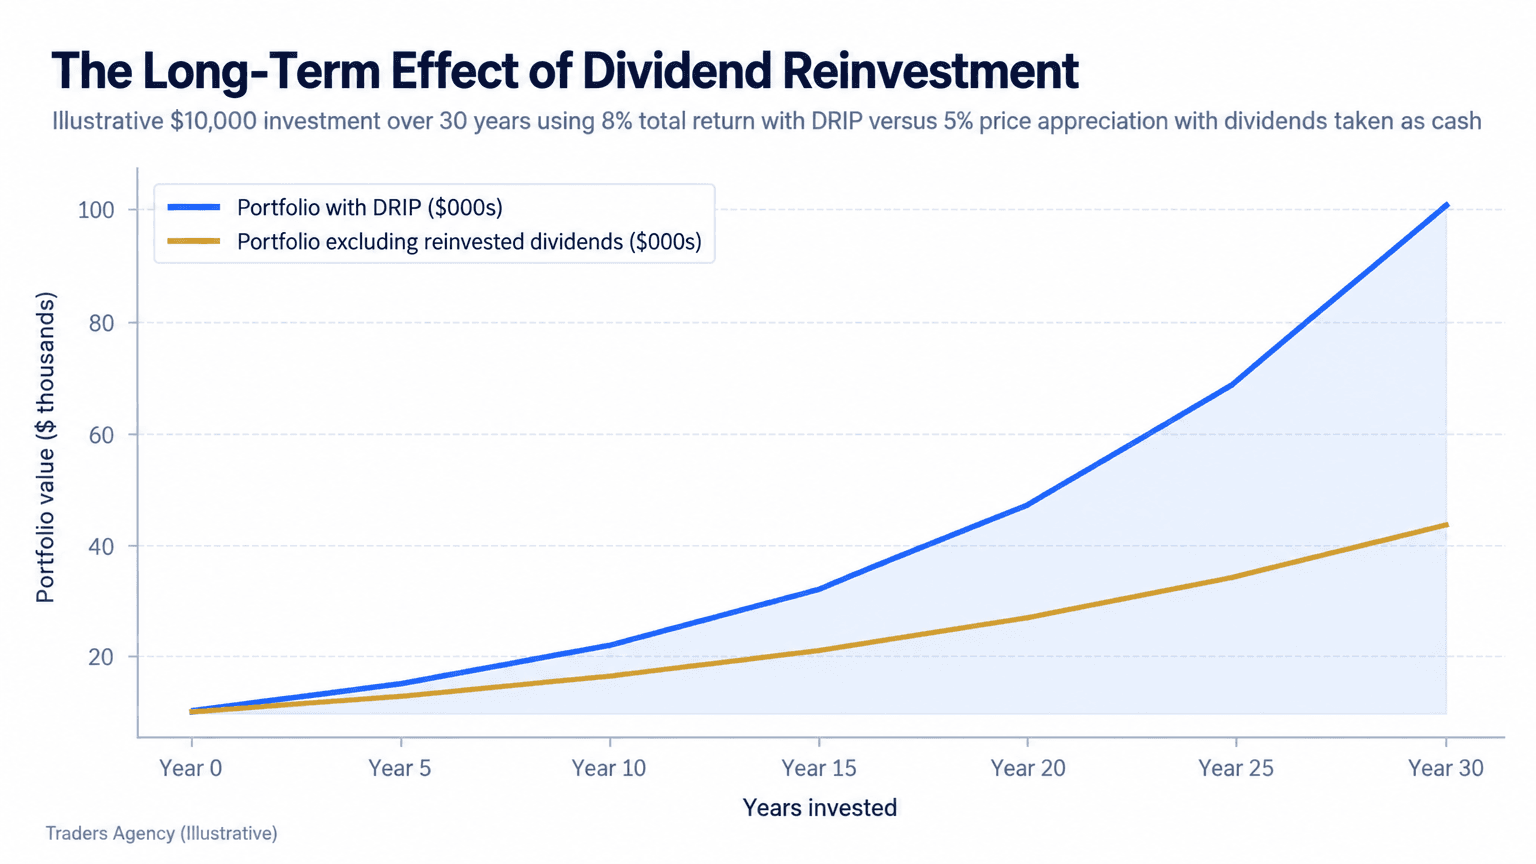
That gap between roughly $100,600 and $43,200 in this illustration is entirely attributable to reinvestment. Nothing else changed. This is why we tell members that turning off DRIP without a specific income need is usually leaving money on the table.
Tax Efficiency Matters Too
Qualified dividends are typically taxed at long-term capital gains rates (0%, 15%, or 20% depending on your bracket), which is more favorable than ordinary income tax rates applied to non-qualified dividends. Growth stocks, by contrast, only trigger capital gains tax when you actually sell.
If you're investing in a taxable account, this difference affects your real, after-tax return. We suggest checking whether your dividend-paying holdings qualify before assuming the yield you see is the yield you'll keep.
How Do You Know If a Dividend Payout Is Sustainable?
The payout ratio is the percentage of a company's earnings paid out as dividends, calculated as dividends per share divided by earnings per share. A high payout ratio isn't automatically bad, but it leaves less room for error if earnings decline.
What Is the 25% Dividend Rule?
It's a conservative guideline some investors use, suggesting a company should pay out no more than 25% of its earnings as dividends, leaving a wide cushion if earnings fall. It's not a regulatory standard, just a conservative screen some investors apply alongside sector payout norms.
A payout ratio above 80% in a cyclical industry is a warning sign. The same ratio in a stable utility or REIT might be completely normal, because the sectors operate under different cash flow structures.
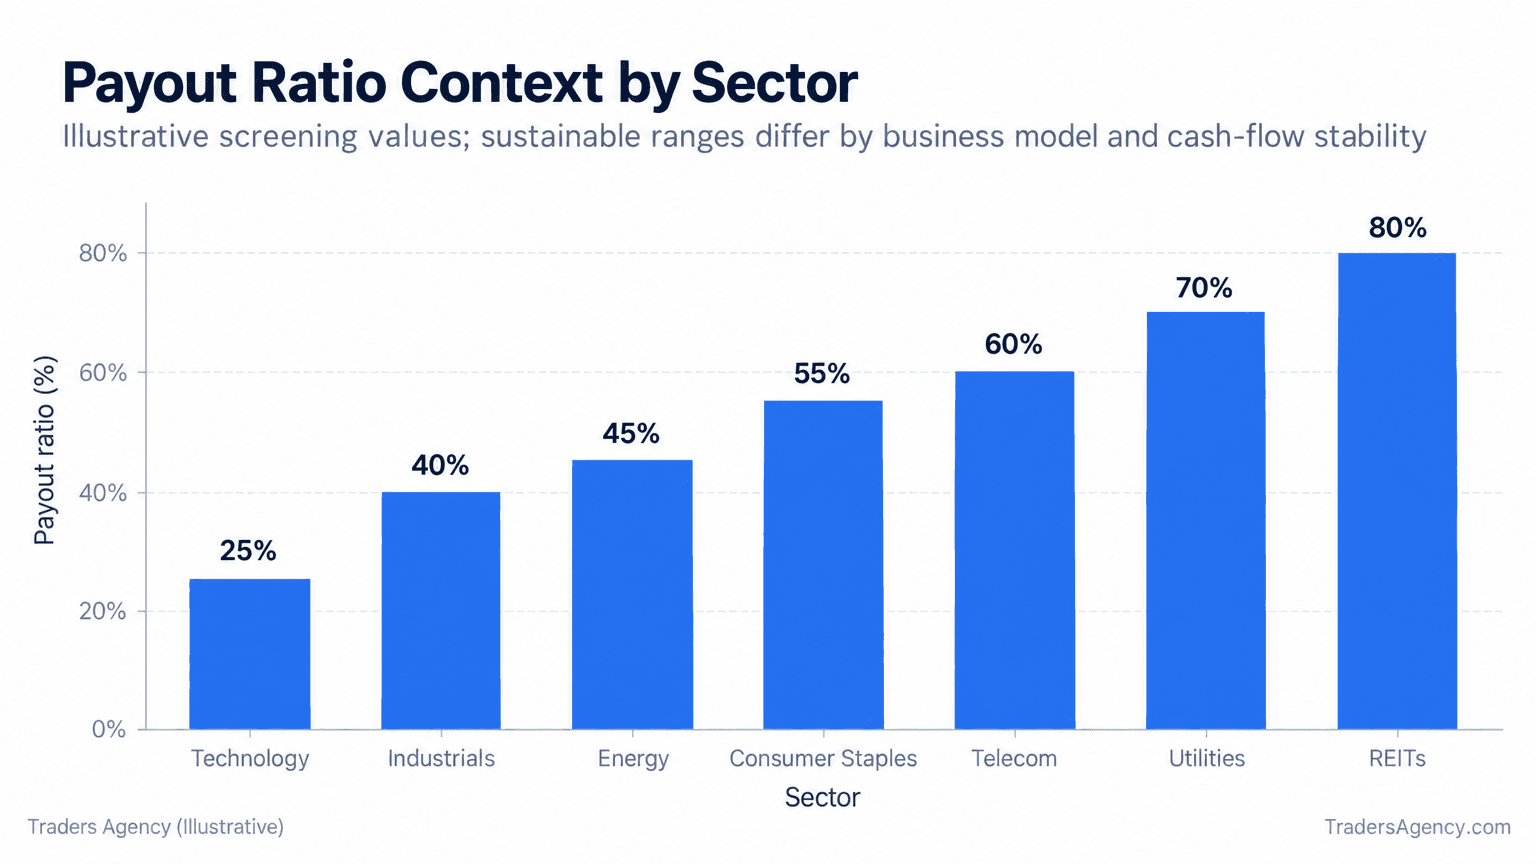
We check payout ratios against sector norms before flagging anything as risky. A tech company at 60% payout is a different story than a REIT at the same number, since REITs are legally required to distribute at least 90% of taxable income to shareholders.
Watch Out: A high payout ratio by itself doesn't tell the whole story. Always compare it against the sector average and check whether earnings are stable enough to support the commitment before assuming a dividend is safe.
What Does a 7% Dividend Yield Mean?
It usually signals either a beaten-down stock price, a mature company in a slow-growth industry, or in some cases, a payout the market doubts is sustainable. Generally, anything above 6-7% warrants a closer look at the payout ratio and debt load before assuming it's safe.
How Do You Build a Dividend Ladder for Steady Income?
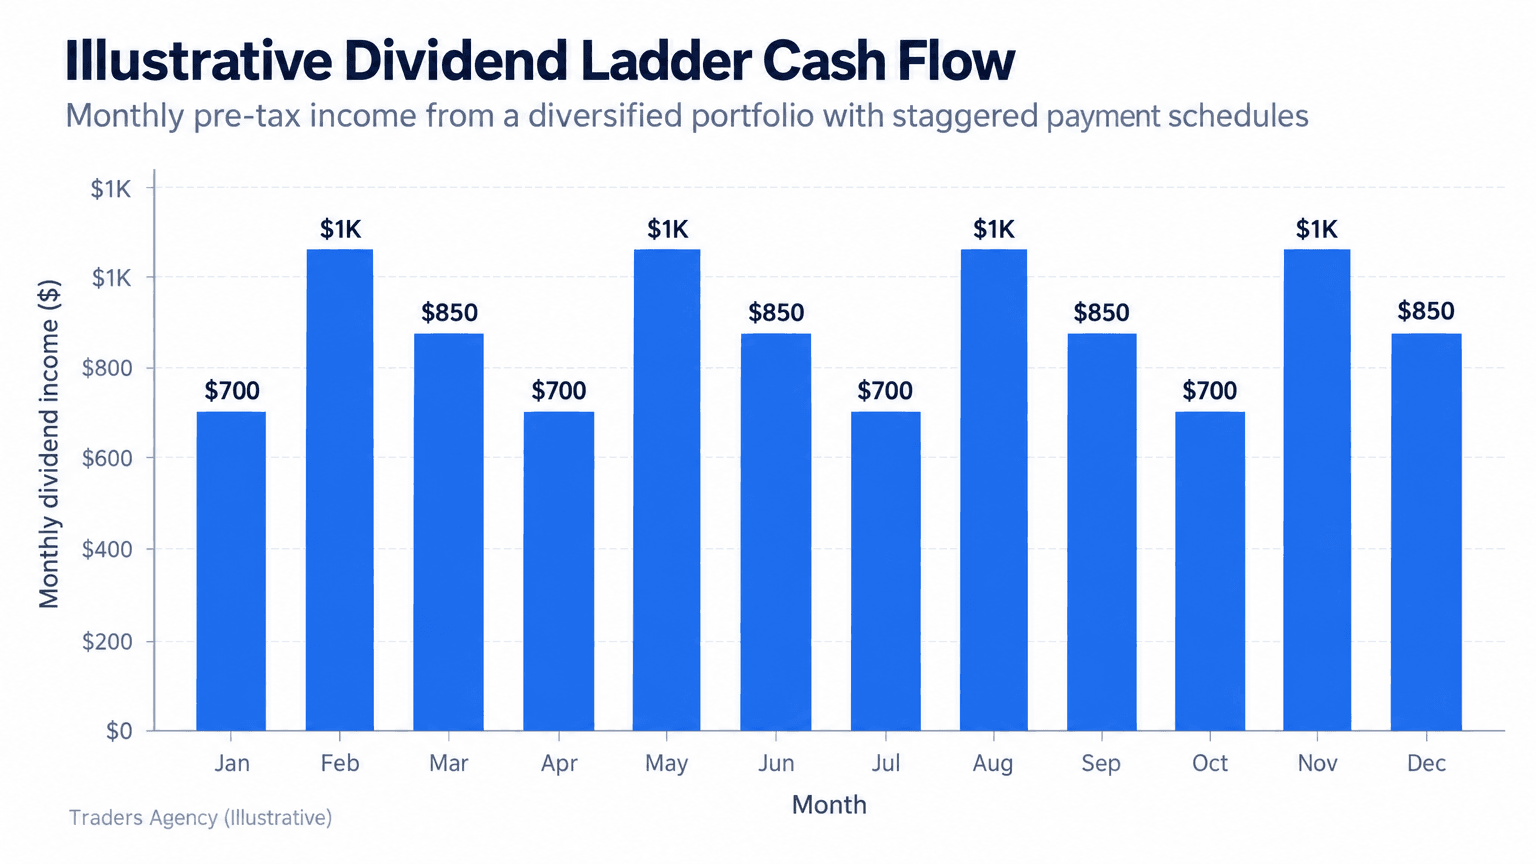
A dividend ladder staggers holdings by their payment months so that income arrives more evenly across the year instead of clustering in a few quarterly windows. This smooths cash flow for anyone relying on dividends to cover monthly expenses.
Most companies pay quarterly on a fixed schedule. By selecting holdings whose payment months don't all overlap, you can convert lumpy quarterly income into something closer to a monthly paycheck.
How Much Money Do I Need to Make $10,000 a Month in Dividends?
| Blended Yield | Approximate Capital Required | Relative Risk |
|---|---|---|
| 4% | $3,000,000 | Lower, more conservative |
| 7% | $1,700,000 | Higher, more payout-cut risk |
At a conservative blended yield of 4%, you'd need roughly $3 million invested to generate $10,000 a month. At a higher but riskier 7% yield, it drops to around $1.7 million, though that higher yield typically carries more payout-cut risk worth weighing against the sustainability checks covered above.
When Should You Choose High Yield Over Growth?
High yield makes sense when you need current income now, such as in retirement, and have a shorter time horizon where compounding has less runway to work.
If you're decades from needing the cash, dividend growth, or a blended growth-and-dividend ETF approach, usually serves accumulation goals better. Many of our members split the difference, holding growth-oriented names during accumulation years and shifting toward yield as retirement approaches.
Common Mistakes to Avoid:
- Chasing yield without checking the payout ratio or debt load
- Ignoring dividend history, since a single high-yield quarter can precede a cut
- Forgetting to reinvest when you don't need current income
- Holding only one sector, which concentrates payout-cut risk
- Overlooking tax treatment differences between qualified and non-qualified dividends
Position sizing matters here too. We generally suggest no single dividend holding should represent more than 5% of a portfolio, regardless of how attractive the yield looks.
Want expert trading insights delivered daily?
Join thousands of traders who rely on Traders Agency for market analysis and trade ideas.
Join Traders AgencyDISCLAIMER: Traders Agency does not offer financial advice. The information provided is for educational purposes only and should not be considered financial advice. Traders Agency is not responsible for any financial losses or consequences resulting from the use of the information provided. Trading carries inherent risks and may not be suitable for all individuals. You are advised to conduct your own research and seek personalized advice before making any investment decisions, recognizing the potential risks and rewards involved.
See more from Traders Agency on Google
Make us a preferred source and our market analysis will appear more prominently in your Google Search, Top Stories, and AI results.
Add to Preferred Sources