
The 10-year Treasury yield is surging to multi-month highs, hitting 4.707% as inflation fears sweep through the markets. The current 10 year treasury yield reflects a massive repricing in bond markets driven by a spike in energy costs and shifting expectations for Federal Reserve policy. This move demands attention today, because the implications ripple across every asset class you hold.
This is the highest level for the benchmark yield since January 15, 2025, the period just before the start of President Donald Trump's second term. For traders holding equities or fixed-income assets, the numbers tell a clear story of tightening financial conditions.
The Number: The 10-year Treasury yield jumped 5 basis points to 4.707%, its highest level since January 2025, as oil prices spike and inflation data runs hot.
Why Is the 10-Year Treasury Yield Rising?
The 10-year Treasury yield is climbing because a combination of surging oil prices, strong employment data, and hot inflation reports are forcing markets to price in higher interest rates.
The picture we're seeing points to two forces working together. Energy costs and falling jobless claims are pushing yields higher on one side, while hotter-than-expected April inflation data drives the move on the other. We're tracking both elements closely.
The Producer Price Index showed headline wholesale prices rose 6% on an annual basis in April. The Consumer Price Index report released on Tuesday also showed consumer price increases accelerated in April.
At the same time, the labor market remains tight. Jobless claims for the week ended July 18 came in at 187,000, well below the 212,000 claims economists were expecting.
U.S. Treasury Yield Chart and Energy Market Data
Our analysis shows a direct correlation between the recent energy market breakout and the sell-off in long-term bonds. Brent crude futures for July delivery gained 7% to trade above $101 a barrel, the highest price since before the U.S. and Iran reached a tentative peace deal last month.
U.S. West Texas Intermediate crude futures also advanced 6% to climb above $92 a barrel. Brent crude is now on pace for its third-largest monthly gain in the past 10 years. These energy spikes are mechanically transmitting into higher inflation expectations.
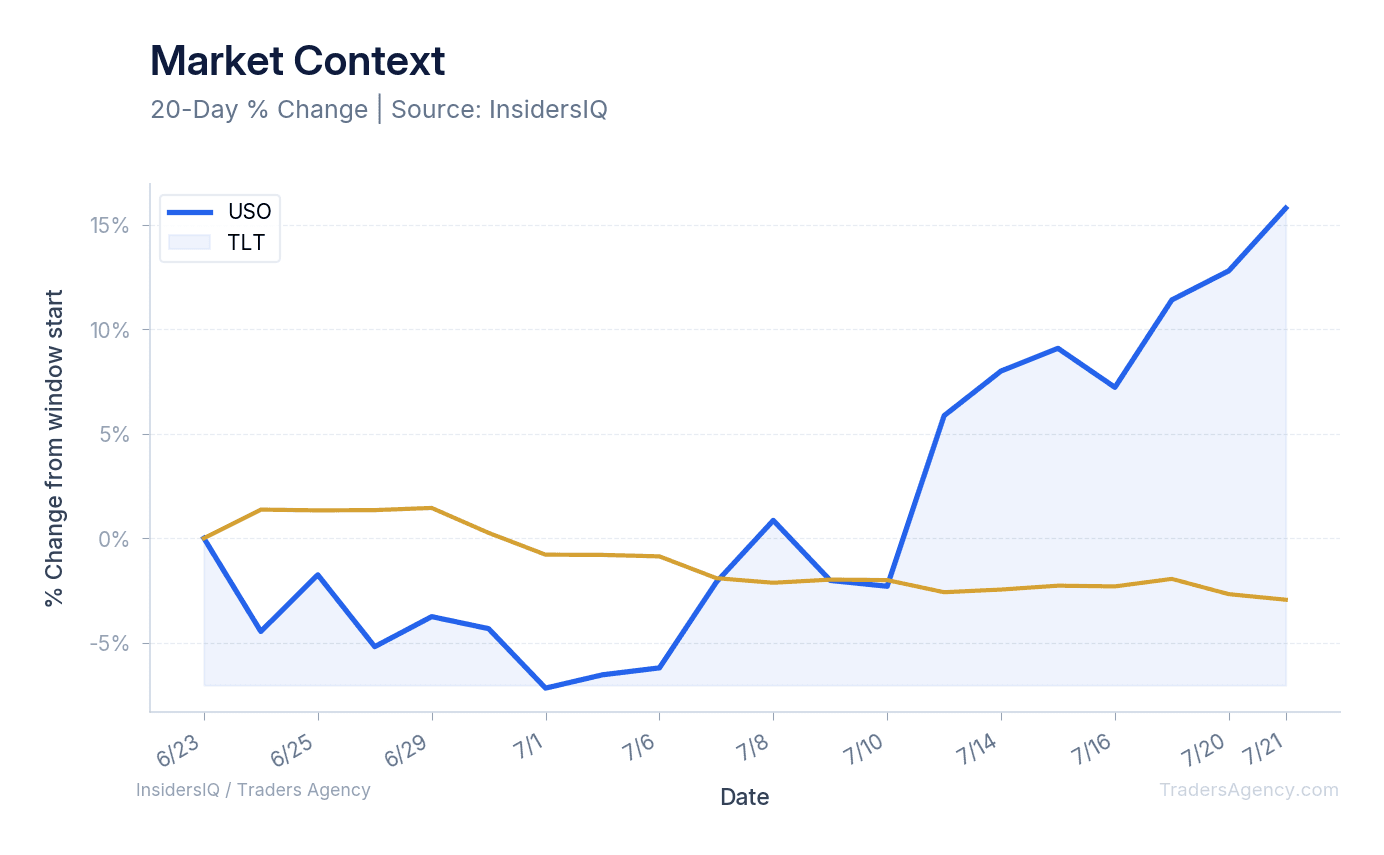
The chart above reflects the underlying assets driving these moves. Over the past 30 days, the United States Oil Fund (USO) shows a price change of +15.81%. In contrast, the iShares 20+ Year Treasury Bond ETF (TLT) shows a 30-day price change of -2.95%.
What Does This Mean for Traders?
For traders, rising yields mean tighter financial conditions and a direct impact on borrowing costs. The 10-year Treasury note serves as the benchmark for several consumer debt vehicles:
- Mortgage rates
- Auto loans
- Credit card debt
Consumer spending could face significant headwinds as these rates climb. Because bond yields and prices move in opposite directions, the 10-year Treasury price is falling sharply. All three major bond yields have moved up between 2% and 4% over the past five days.
Market sentiment remains slightly elevated despite the bond market volatility. The Fear & Greed Index sits at 68. Meanwhile, WallStreetBets sentiment registers at 0.03 with 2,748 mentions.
Want expert trading insights delivered daily?
Join thousands of traders who rely on Traders Agency for market analysis and trade ideas.
Join Traders AgencyHow Will This Affect the Broader Market?
This yield spike will likely pressure equities and force a repricing across all asset classes. The 30-year Treasury yield traded at a 10-month high, rising more than 3 basis points to 5.185%. Crossing the 5% psychological level can begin to exert downward pressure on stocks.
The short end of the curve is also reacting aggressively. The 2-year Treasury yield, which closely tracks short-term Federal Reserve interest rate policy, rose 6 basis points to 4.364%. The 5-year yield rose slightly to 4.14%.
Some market participants view these levels as standard for the current environment, arguing that bond yields of 4.25% to 4.75% are normal and that U.S. bonds are still a safe haven. We think that view underestimates how quickly conditions are shifting.
Why Are Fed Rate Hike Odds Rising Again?
The data we're watching suggests a major shift in monetary policy expectations. As inflation fears heighten, fed funds futures traders are rapidly repricing the probability of Federal Reserve action.
Rate Bet Repricing: Markets are now pricing in an 82% chance of a rate hike at the September meeting, up from just 52% one week ago. The probability of a December hike jumped to 36% from 16%.
Global Yields and Secondary Factors
The bond market sell-off is not contained to the United States. Government bond yields also moved higher across Asia and Europe on Thursday.
The yield on the U.K. 10-year government bond rose 7 basis points, climbing above 5.1%. This followed news that new Prime Minister Andy Burnham cut property taxes on hospitality venues by 20%.
That tax cut will cost roughly £100 million (about $134 million) and aims to protect pubs, clubs, and music venues from higher costs. The policy shift contributed directly to investor unease in European debt markets.
What Should Traders Watch as Treasury Yields Climb?
Our research team is monitoring several specific data points to gauge the next leg of this move. Keep a close eye on these developing factors.
1. The S&P Global Flash U.S. Purchasing Managers Index
This report is due Friday and measures the economic health of American manufacturing and services sectors. A hot reading here could push the 10-year Treasury yield even higher.
2. Geopolitical Energy Pressures
Brent crude is on pace for its third-largest monthly gain in the past 10 years. Reports of Houthi rebel attacks on tankers off the Red Sea coast of Saudi Arabia are keeping a floor under oil prices. Renewed U.S. threats to escalate strikes against Iran are also driving energy markets higher.
3. Key Yield Levels
We're watching the 4.5% level on the 10-year yield and the 5% level on the 30-year yield. These are major thresholds that dictate broader equity market stability.
The Bottom Line
The 10-year Treasury yield is signaling a major shift in inflation expectations and borrowing costs. With energy prices surging and the labor market showing resilience, the Federal Reserve faces mounting pressure to maintain or increase interest rates. We're positioning for continued volatility in both the bond and equity markets as these macroeconomic forces collide.
Want expert trading insights delivered daily?
Join thousands of traders who rely on Traders Agency for market analysis and trade ideas.
Join Traders AgencyKey Takeaways
- The 10-year Treasury yield hit 4.707%, its highest level since January 15, 2025, marking a 5 basis point jump driven by inflation and energy cost pressures.
- Producer Price Index data showed headline wholesale prices rose 6% annually in April, one of the core catalysts pushing yields to multi-month highs.
- Falling jobless claims and strong employment data are compounding the inflation pressure, reducing the likelihood of near-term Federal Reserve rate cuts.
- Traders should watch 4.5% on the 10-year yield and 5% on the 30-year yield as the key thresholds that historically signal broader equity market instability.
- Rising yields are tightening financial conditions across asset classes, meaning both equity and fixed-income portfolios face increased volatility in the near term.
DISCLAIMER: Traders Agency does not offer financial advice. The information provided is for educational purposes only and should not be considered financial advice. Traders Agency is not responsible for any financial losses or consequences resulting from the use of the information provided. Trading carries inherent risks and may not be suitable for all individuals. You are advised to conduct your own research and seek personalized advice before making any investment decisions, recognizing the potential risks and rewards involved.
See more from Traders Agency on Google
Make us a preferred source and our market analysis will appear more prominently in your Google Search, Top Stories, and AI results.
Add to Preferred Sources