
The 30-year Treasury yield is surging past 5.1%, hitting its highest level in nearly a year as messy inflation data sends shockwaves through bond markets. Our team is tracking a major shift in the rate environment, and here's what traders need to know right now.
The Number: The 30-year Treasury yield hit 5.129%, jumping nearly 12 basis points on Friday. This is the highest reading since May 22, 2025, and it puts the long bond dangerously close to the peak levels we saw in October 2023.
Where Are Treasury Yields Right Now?
The entire yield curve is moving aggressively higher. The 10-year Treasury note, the main benchmark for U.S. borrowing, surged nearly 14 basis points to hit 4.597%. This makes the move highly significant for overall market liquidity and corporate financing.
On the short end, the 2-year Treasury note climbed more than 9 basis points to 4.086%. This duration tends to react in line with short-term Fed rate decisions. For context, one basis point equals 0.01%, and bond yields move inversely to their underlying prices. The entire curve is signaling a highly restrictive environment.
What's Driving the Surge in Long-Term Yields?
The spike in the 30-year Treasury yield follows a week of messy inflation data that continues to muddy interest rate expectations. The consumer price index inflation rate came in at 3.8%, its highest since May 2023, while producer prices, which measure wholesale costs and signal pipeline inflation pressures, came in at a 6% annual rate, the highest since late 2022.
Import costs rose by 1.9% for the month of April, and on a 12-month basis, import prices are up 4.2%. That annual increase was the most since October 2022.
Export costs are painting a similar picture. An 8.8% surge in export costs marked the peak since September of that year. These wholesale price pressures signal that inflation remains a serious problem for the broader economy.
The Energy Market Connection
The conflict in the Middle East continues to drive up energy prices, prompting importers to hike their costs. Energy prices jumped again after President Donald Trump left China with little to show from a meeting with his Chinese counterpart, Xi Jinping.
West Texas Intermediate (WTI) crude, the U.S. benchmark, rose to $104.39, up $3.22 a barrel. Brent crude, the global yardstick, hit $108.30, up $2.58 a barrel.
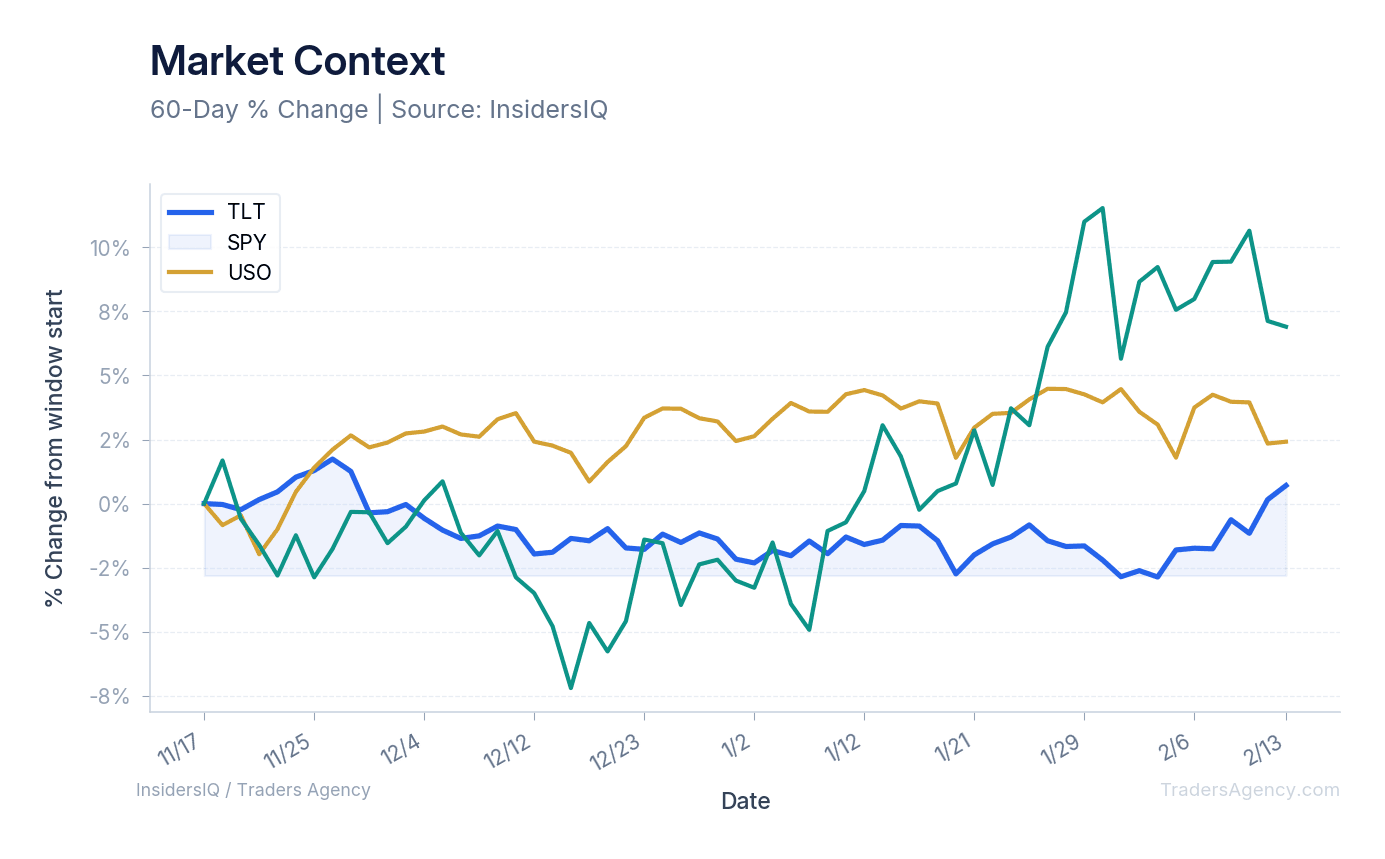
The data we're tracking confirms this sustained upward pressure in the energy sector. Over the last 180 days, the United States Oil Fund (USO) shows a price change of +6.90%. This energy spike directly feeds into the messy inflation data pushing bond yields higher.
Want expert trading insights delivered daily?
Join thousands of traders who rely on Traders Agency for market analysis and trade ideas.
Join Traders AgencyWhat Inflation Environment Is Kevin Warsh Inheriting?
New Federal Reserve Chair Kevin Warsh, confirmed by the Senate on Wednesday, steps into an increasingly complicated inflation picture. He must balance rising consumer prices and import costs against political pressure, as President Donald Trump continues to push for interest rate cuts, even as data on consumer prices and imports shows prices ticking higher.
As Peter Boockvar, chief investment officer of One Point BFG Wealth Partners, wrote in a morning note: "Long end rates are now in control of monetary policy." He added, "I wish Kevin Warsh the best ... but he will still be subject to his surrounding macro circumstances." The combination of a 3.8% consumer price index and a 6% producer price index severely limits options for the rate cuts the President is demanding.
What Does a 5% Treasury Yield Mean for Markets?
Fiscal Pressure: The U.S. government spent $97 billion on interest costs alone in April, making debt financing the second-highest federal expenditure right behind Social Security.
A 5% yield on the 30-year bond signals severe fiscal challenges and creates heavy competition for equity investments. When risk-free government bonds offer returns this high, the incentive to chase riskier assets diminishes significantly.
Despite these headwinds, broader equities have maintained positive momentum. The SPDR S&P 500 ETF Trust (SPY) shows a 180-day price change of +2.42%. Overall market sentiment data shows the Fear & Greed index sitting at 68.
Long-term bonds, however, are feeling the weight of these yields. The iShares 20+ Year Treasury Bond ETF (TLT) has managed only a +0.71% price change over the last 180 days. Retail trader attention is heavily focused on this environment, with WallStreetBets sentiment at 0.03 across 2,748 recent mentions.
The U.S. government recorded a budget surplus of $215 billion for April. While typical for the month as tax collections come in, this figure was 17% below the same month in 2025, highlighting ongoing deficit concerns.
Global Bond Market Reactions
Spiking yields are not confined to the United States. As Boockvar noted, "inflation is still a problem ... debts and deficits matter (particularly in the UK) and sovereign bonds that are heavily owned by foreigners are now a source of funds."
Our team is tracking simultaneous selloffs across major international bond markets:
- 10-year German bund: Yielding 3.127%, jumping alongside U.S. Treasurys
- Japanese government bonds: Up 7 basis points to hit 2.69%
- UK gilts: Reached 4.56%, climbing more than 8 basis points at the 10-year level
This synchronized global bond selloff tells us the inflation problem extends well beyond U.S. borders.
What Should Traders Watch Next in the Bond Market?
We believe traders must closely monitor specific levels and data points as the market digests this new yield environment under Chair Warsh.
1. The 5.129% Level on the 30-Year Bond
Watch whether the long bond breaks past its recent high of 5.129%. A push higher would bring yields back to the absolute peaks seen in October 2023, a level that triggered significant equity market volatility last time around.
2. Energy Market Resistance
With WTI crude at $104.39 and Brent crude at $108.30, energy costs are a primary driver of the 1.9% April import price hike. We're watching these oil benchmarks closely for any signs of cooling.
3. The 4.597% Level on the 10-Year Note
As the main benchmark for U.S. borrowing, the 10-year note's surge of nearly 14 basis points to 4.597% directly impacts corporate and consumer debt costs across the economy.
Key ETFs to Monitor: Watch TLT for long-term bond price stability, SPY to see if equities can maintain their +2.42% 180-day trend, and USO as it reacts to the +6.90% 180-day momentum in energy.
The Bottom Line
Our research team sees a bond market that is taking control of monetary policy expectations. The combination of a 3.8% consumer price index, a 6% producer price index, and surging energy costs creates a highly restrictive environment that no Fed chair can simply talk away.
We're actively watching how the 30-year Treasury yield behaves near these multi-year highs. With federal interest costs hitting $97 billion in April alone, the math for aggressive rate cuts simply does not align with the current inflation data. Traders need to position accordingly.
Want expert trading insights delivered daily?
Join thousands of traders who rely on Traders Agency for market analysis and trade ideas.
Join Traders AgencyKey Takeaways
- The 30-year Treasury yield hit 5.129% on Friday, jumping nearly 12 basis points to its highest level since May 22, 2025, and approaching the October 2023 peak.
- The 10-year Treasury note surged nearly 14 basis points to 4.597%, a move that directly tightens corporate financing conditions and overall market liquidity.
- Consumer price index inflation came in at 3.8%, its highest since May 2023, while producer prices hit a 6% annual rate, creating a dual inflation signal that complicates any Fed pivot.
- Federal interest costs hit $97 billion in April alone, meaning the fiscal math actively works against aggressive rate cuts regardless of what the Fed signals.
- The 2-year Treasury note climbed more than 9 basis points to 4.086%, confirming that short-term rate cut expectations are being repriced across the entire curve, not just the long end.
DISCLAIMER: Traders Agency does not offer financial advice. The information provided is for educational purposes only and should not be considered financial advice. Traders Agency is not responsible for any financial losses or consequences resulting from the use of the information provided. Trading carries inherent risks and may not be suitable for all individuals. You are advised to conduct your own research and seek personalized advice before making any investment decisions, recognizing the potential risks and rewards involved.
See more from Traders Agency on Google
Make us a preferred source and our market analysis will appear more prominently in your Google Search, Top Stories, and AI results.
Add to Preferred Sources