
A TradingView chart setup is the process of configuring your charting workspace, indicators, drawing tools, and alerts so you analyze price action the same way every single time you open the platform. Get this right and your analysis becomes repeatable. Get it wrong and you end up with a cluttered screen, missed signals, and inconsistent decisions. By the end of this guide, you'll know exactly how to build, save, and reuse a clean chart setup that works for stocks, crypto, or pairs like XAUUSD.
If you've opened TradingView for the first time and felt a little overwhelmed, you're in good company. There are toolbars on every side, a search bar, and a blank chart staring back at you. Maybe you watched a tutorial video that moved too fast, or you're not sure whether you need the free version or a paid plan just to follow along.
That's exactly what we're solving here. Our team will walk you through the entire process: creating your account, adding the indicators that matter, drawing basic trend lines, saving your layout so you never rebuild it from scratch, and setting alerts so you're not glued to the screen all day.
What Is TradingView, and Why Should Beginners Start Here?
Bottom Line: A solid TradingView chart setup is built once and reused every time, with the same indicators, drawing tools, and alerts loading automatically across desktop and mobile. The real payoff isn't the setup itself but what it frees you to focus on: reading price action and managing risk instead of rebuilding your workspace or second-guessing your analysis.
TradingView is a web-based charting platform that lets traders analyze price movement across stocks, forex, crypto, and commodities using real-time and historical data. It has become the most widely used charting tool among retail traders because it runs in any browser, requires no installation, and offers a genuinely useful free tier.
Unlike older desktop charting software, TradingView lives in your browser or a lightweight app, so you can pull up a live chart from a laptop, tablet, or phone without losing your saved settings. That consistency is a big part of why we point beginners here first: you build your setup once, and it follows you everywhere.
TradingView also maintains its own help center and community scripts library, which is a reliable reference if you ever want to double-check how a specific indicator calculates its values.
Here's why this matters for a beginner specifically:
- No installation required. You can start charting within two minutes of landing on the site.
- Shared language with other traders. Most trading communities and tutorials use TradingView, so what you learn transfers directly.
- It scales with you. The free plan is genuinely usable, and paid tiers unlock more room to grow without forcing you to switch platforms later.
Key Concept: A chart setup is not about having the most indicators. It's about having the same indicators, drawings, and timeframes in front of you every session so your read on price stays consistent.
Do You Need a Free or Paid TradingView Plan?
1. Creating Your Account
Head to the TradingView website and sign up with an email address, or connect an existing Google or Apple account. There's no download required to get started since the platform runs in your browser, though desktop and mobile apps are both available if you prefer a dedicated window.
Once your account exists, you log into your chart dashboard from any device, and your saved charts, indicators, and alerts sync automatically.
2. Free vs. Paid: What Actually Changes
The free plan is where we tell every beginner to start. Here's the practical breakdown:
| Plan | What You Get |
|---|---|
| Free | One saved chart layout, a limited number of indicators per chart (typically capped around 2), delayed data on some exchanges, and a smaller number of active alerts |
| Essential | More indicators per chart, multiple saved layouts, reduced ad presence |
| Plus / Premium | Higher indicator limits, more alerts, extended data history, and multiple chart windows open at once |
Our honest take: stick with the free tier for at least your first month. You don't need five indicators stacked on one chart to learn the fundamentals, and paying before you know what you actually use is one of the most common early mistakes we see.
How Do You Add Indicators Like RSI and MACD?
You add indicators on TradingView by clicking the "Indicators" button at the top of the chart, searching for the tool by name (like RSI or MACD), and selecting it from the dropdown to apply it directly to your chart. From there you can adjust its settings or remove it just as easily.
Step 1: Start With a Moving Average
Before adding oscillators, get comfortable with a moving average, which smooths price into a single line by averaging closing prices over a set number of periods (commonly 20). Click "Indicators," search "Moving Average," and apply it with the default 20-period setting.
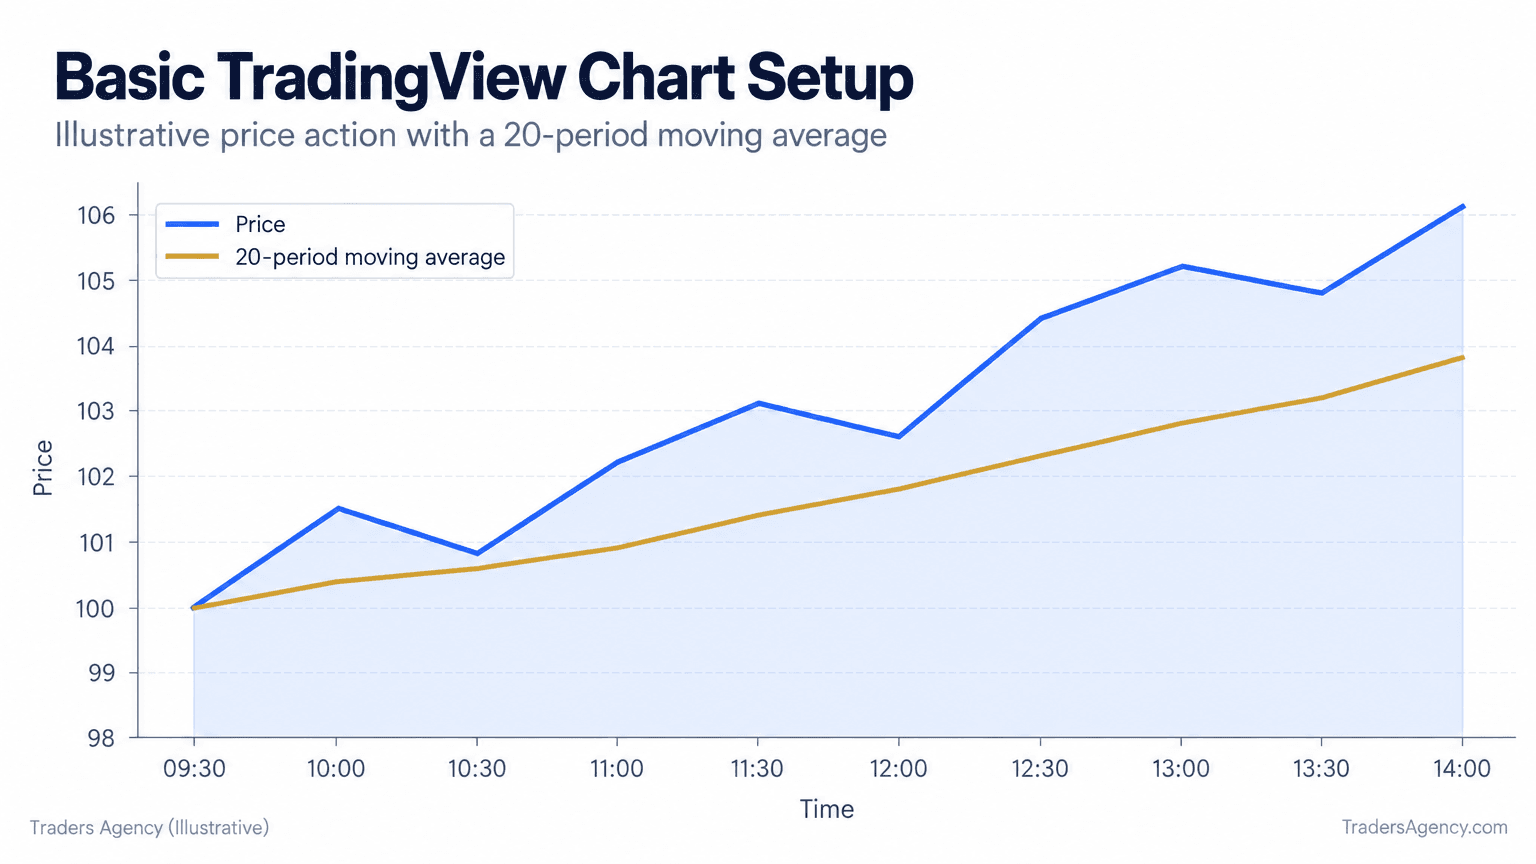
Notice how the smoother line filters out the small wiggles in price and shows you the general direction. When price sits above the moving average, that's a sign of upward momentum. When it sits below, momentum is leaning down.
Step 2: Add RSI (Relative Strength Index)
RSI measures how fast and how far price has moved recently on a scale of 0 to 100. Readings above 70 are generally considered overbought, and readings below 30 are considered oversold.
Search "RSI" in the indicators menu and apply it with default settings (a 14-period lookback). It will appear as a separate panel below your main price chart.
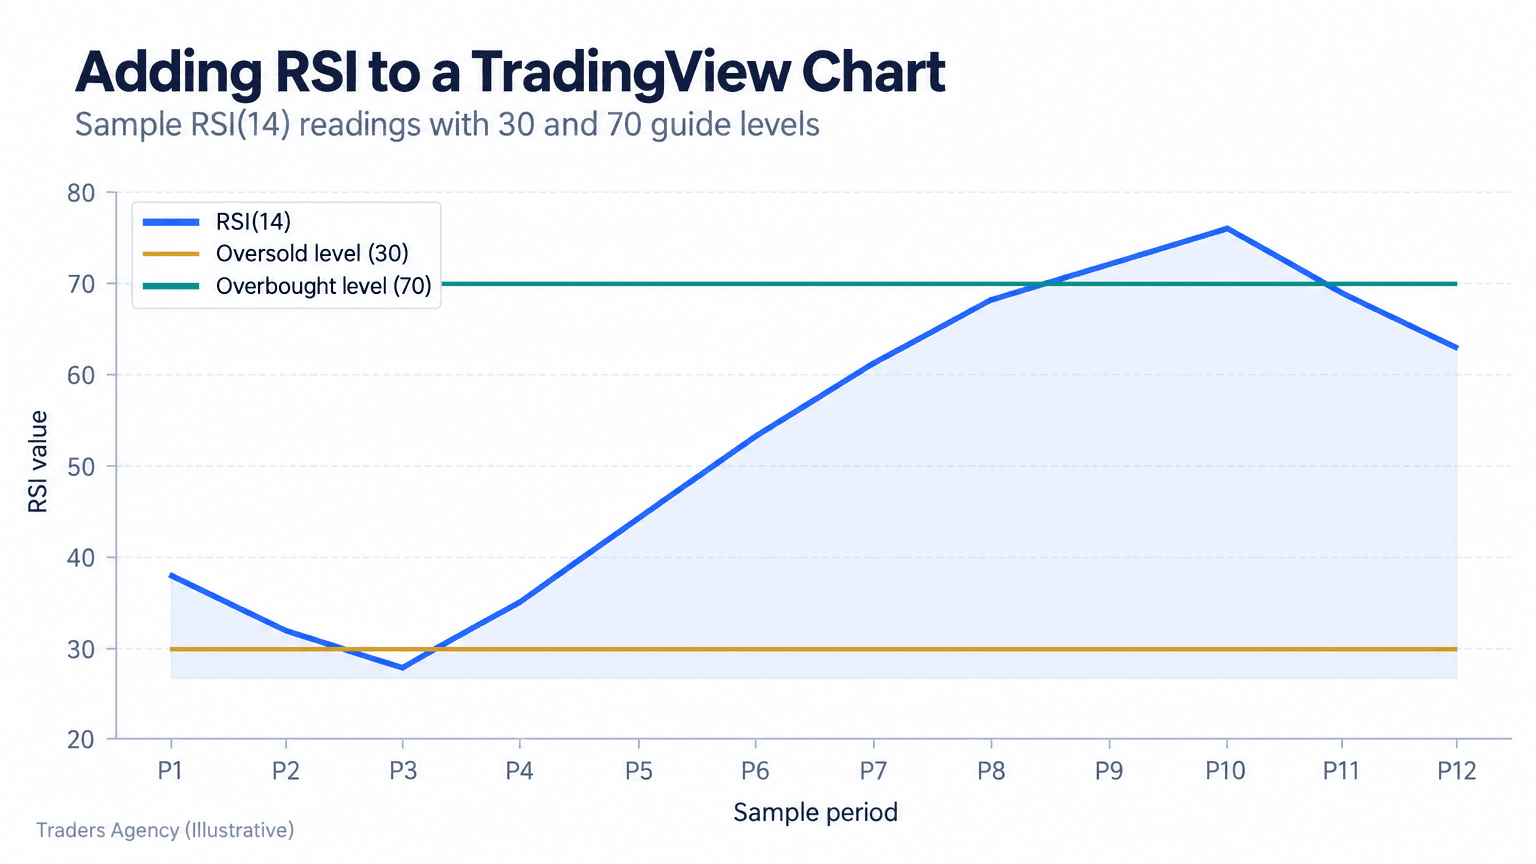
In the chart above, RSI rises from 28 (oversold) up through 76 (overbought). We teach beginners to treat these crossings as early warning signs that a move is stretched, not as a standalone buy or sell signal.
Step 3: Add MACD
MACD (Moving Average Convergence Divergence) tracks the relationship between two moving averages and plots a signal line alongside a histogram to show momentum shifts. Search "MACD" and apply it the same way you did with RSI. It will sit in its own panel too.
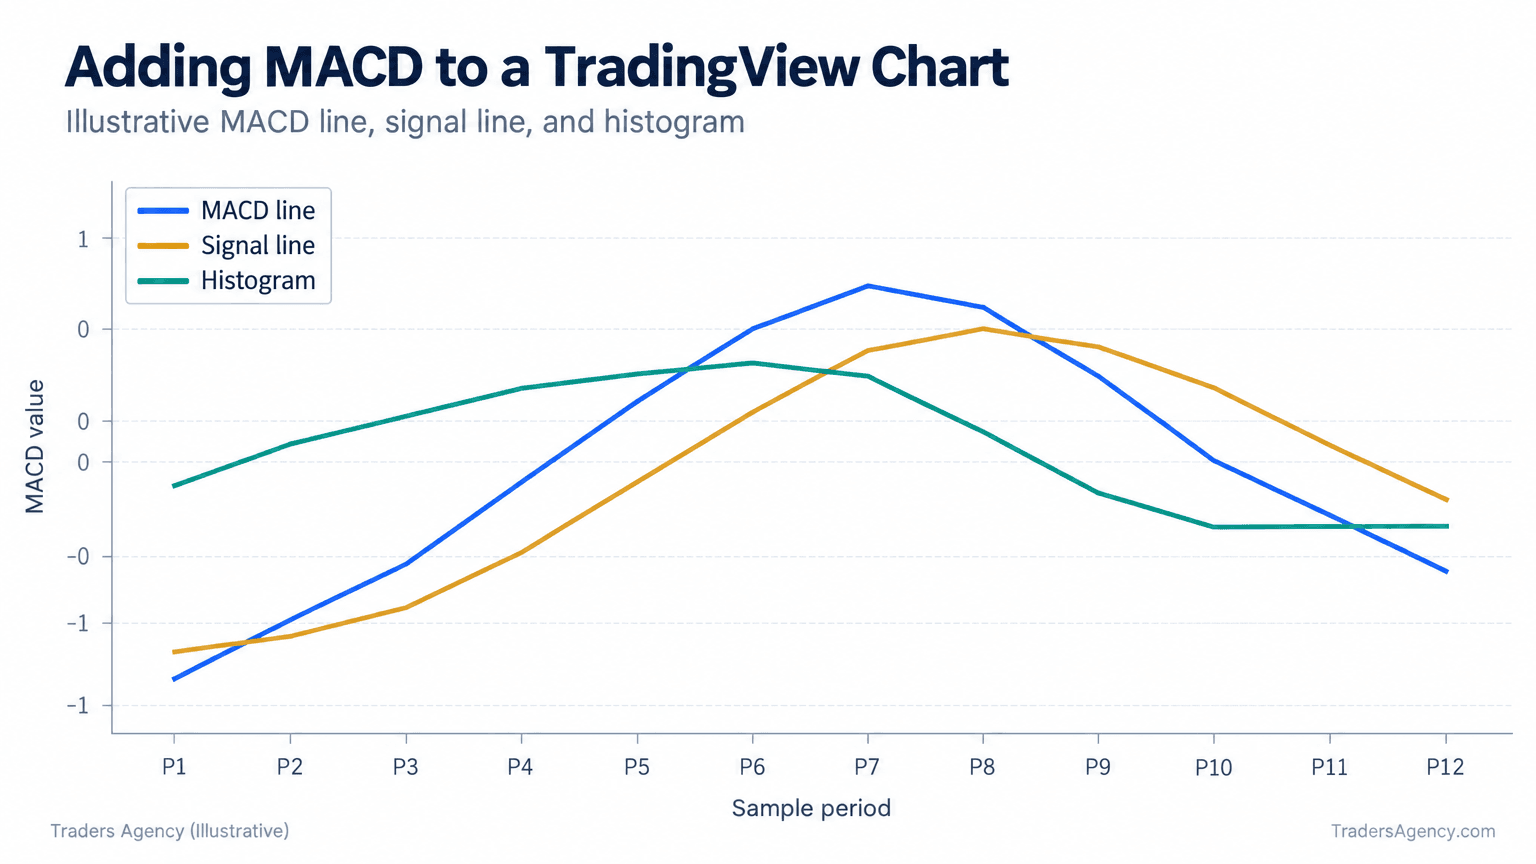
When the MACD line crosses above its signal line, momentum is shifting positive. When it crosses below, momentum is shifting negative. On the free plan, remember you're limited to roughly two visible indicators at once, so most beginners run a moving average plus one oscillator (RSI or MACD) rather than stacking all three permanently.
Want expert trading insights delivered daily?
Join thousands of traders who rely on Traders Agency for market analysis and trade ideas.
Join Traders AgencyUsing Drawing Tools for Trend Lines and Support/Resistance
The drawing toolbar sits on the left side of your chart and includes trend lines, horizontal rays, and rectangles that let you mark price levels manually. These tools turn a blank chart into a visual map of where price has reacted in the past.
- Draw a trend line. Click the trend line tool, click once on a swing low (or swing high), and drag to a second point that connects with price action. A properly drawn trend line should touch at least two or three points where price reversed or paused, not just one.
- Mark support and resistance. Use the horizontal line tool to mark levels where price has repeatedly bounced (support) or stalled (resistance). On a gold (XAUUSD) chart, for example, you might notice price reversing again and again near a round number like $2,650. That's worth marking as horizontal support.
- Clean up as you go. Right-click any drawing and select "Remove" to keep your chart readable. A cluttered chart makes it far harder to spot the signals that actually matter.
Watch Out: The most common drawing-tool mistake is never deleting anything. Dozens of stale trend lines from three months ago will actively work against your analysis. If a level no longer matters, remove it.
How Do You Save and Reuse Your Chart Layout?
You save a chart layout on TradingView by clicking the layout name at the top of the screen, giving it a title, and saving it so your indicators, drawings, and settings reload automatically the next time you open that chart. This one habit is what separates a reusable setup from one you rebuild every single session.
Steps to Save Your Layout
- Build the chart exactly how you want it: moving average, RSI, drawings, and timeframe all in place.
- Click the layout name in the top toolbar (it usually defaults to something like "Untitled").
- Rename it descriptively, for example "Gold Swing Setup" or "Daily RSI Watch."
- Click save, then confirm the layout appears in your saved layouts list.
- Test it. Switch to a different chart, then reload your saved layout to make sure everything returns.
Troubleshooting: Layout Not Saving
If your layout isn't sticking, check these three things first:
- You're not logged in. Layouts only save when you're signed into your account, not browsing anonymously.
- You hit the free-tier limit. The free plan allows a single saved layout, so saving a second one may overwrite the first.
- Browser cache issues. Clearing your cache or trying a different browser resolves this in most cases.
How Do You Create Alerts on TradingView?
An alert on TradingView is a notification that triggers automatically when price hits a level or condition you set, so you don't have to watch the chart constantly. Right-click anywhere on the chart and select "Add Alert" to open the alert builder.
From there, you'll choose three things:
| Setting | What You're Choosing |
|---|---|
| Condition | The specific price level or indicator value that triggers the alert |
| Frequency | Whether it fires once or every time the condition is met |
| Notification | Pop-up, email, or mobile app notification |
As a practical example, you could set an alert on gold to trigger if price crosses above $2,700, then walk away from your live chart knowing you'll be notified the moment it happens. That's how part-time traders stay in the game without living in front of a screen.
What Are Common TradingView Chart Setup Mistakes?
We see the same handful of errors from nearly every beginner, so let's address them directly.
- Stacking too many indicators. Three or four oscillators all saying slightly different things creates confusion, not clarity.
- Forgetting to save before closing the tab. Always confirm the save before you navigate away.
- Using the wrong timeframe for the strategy. A 1-minute chart tells a completely different story than a daily chart. Match the timeframe to how you actually trade.
- Never removing old drawings. Outdated trend lines clutter your read on current price.
- Skipping alerts entirely. Without them, you'll stare at charts far longer than necessary and still miss the move.
When to Use This Full Setup, and When to Simplify
The complete setup we've built here (moving average, one oscillator, trend lines, a saved layout, and alerts) works best for swing traders and part-time traders who check charts a few times a day rather than every minute. It's less useful for someone scalping a 1-minute chart who needs a lighter, faster-loading workspace.
If you're brand new, start with just the moving average and one oscillator before adding drawing tools. Adding everything at once is how beginners get overwhelmed and abandon the platform in week one.
Risk Warning: Your chart setup is a tool for analysis, not a substitute for position sizing and stop-loss discipline. Even the cleanest chart in the world won't protect you from an oversized position or from ignoring your own exit rules.
Frequently Asked Questions
What is TradingView, and why should beginners use it?
TradingView is a browser-based charting platform used by retail traders to analyze price across markets like stocks, forex, and crypto. Beginners favor it because it requires no installation and offers a genuinely functional free plan.
How do you set up a TradingView chart for beginners?
Create a free account, search for your asset, apply a moving average and one oscillator like RSI, add basic trend lines, then save the layout so it reloads automatically next time.
Is TradingView free to use?
Yes. The free plan includes one saved layout and a limited number of indicators. Paid tiers (Essential, Plus, Premium) unlock more indicators, layouts, and alerts.
How do you add indicators like RSI and MACD?
Click the "Indicators" button above the chart, search for RSI or MACD by name, and select it from the results. Both apply to a separate panel below your price chart.
How do you save a chart layout?
Click the layout name in the top toolbar, rename it, and save it while logged into your account so your indicators and drawings reload automatically each time you return.
Do I need to log in on every device?
Yes. Logging in syncs your saved layouts, alerts, and indicators across devices, so your chart setup looks identical whether you're on desktop or mobile.
Our education team publishes new strategy guides and market analysis every week. Build the setup once, then spend your energy on the part that actually matters: reading price and managing risk.
Want expert trading insights delivered daily?
Join thousands of traders who rely on Traders Agency for market analysis and trade ideas.
Join Traders AgencyDISCLAIMER: Traders Agency does not offer financial advice. The information provided is for educational purposes only and should not be considered financial advice. Traders Agency is not responsible for any financial losses or consequences resulting from the use of the information provided. Trading carries inherent risks and may not be suitable for all individuals. You are advised to conduct your own research and seek personalized advice before making any investment decisions, recognizing the potential risks and rewards involved.
See more from Traders Agency on Google
Make us a preferred source and our market analysis will appear more prominently in your Google Search, Top Stories, and AI results.
Add to Preferred Sources