
You pull up an options chain for the first time and see hundreds of strikes, expirations, and prices staring back at you. Calls, puts, spreads, straddles: it's a lot. Most new traders freeze right here, pick a random call because "the stock looks like it'll go up," and lose money without ever understanding why. We're going to fix that with a simple decision framework you can run every single time.
Choosing an options strategy comes down to four things: your directional bias, your volatility outlook, your risk tolerance, and how much capital you have to work with. Get those four answers right, and the strategy almost picks itself.
By the end of this guide, you'll have a repeatable process you can use whenever you're staring at a chart wondering what trade to place. We'll walk through real strike prices, real premiums, and real payoff scenarios so none of this stays theoretical.
What Is Options Strategy Selection?
Bottom Line: Picking an options strategy is a matter of matching direction, volatility outlook, risk tolerance, and capital to the right structure, not guessing which trade
Options strategy selection is the process of matching a specific options structure (a single call, a spread, a straddle, and so on) to your market view and your personal risk limits. It is not about finding "the best" strategy. It is about finding the right strategy for the trade in front of you.
Every options strategy is a tool built for a specific job. A hammer doesn't work on a screw, and a bullish call spread doesn't work when you expect a stock to go nowhere.
Learning how to choose options strategy setups as a beginner starts with accepting that no single structure wins in every market. Traders hunting for a shortcut usually walk away disappointed, because the honest answer is that strategy selection is a repeatable process, not a secret.
Key Concept: Strategy selection means matching the structure to the market condition. Direction, expected size of the move, and defined risk come first. The strike prices come last.
How Do You Choose the Right Options Strategy?
You choose the right options strategy by answering three questions in order: what direction do you think the stock is headed, how big a move do you expect, and how much are you willing to lose if you're wrong.
Those three answers narrow hundreds of possible trades down to one or two reasonable choices. Think of it like a filter:
- Direction removes half the board immediately.
- Volatility outlook removes most of what's left.
- Risk tolerance picks the final trade.
Capital matters here too. A trader with $2,000 in their account cannot run the same strategy as a trader with $50,000, even with an identical market view. We cover sizing specifics further down.
Start Simple: Matching Strategy to Market Outlook
1. Bullish Outlook: Defined-Risk Call Spreads
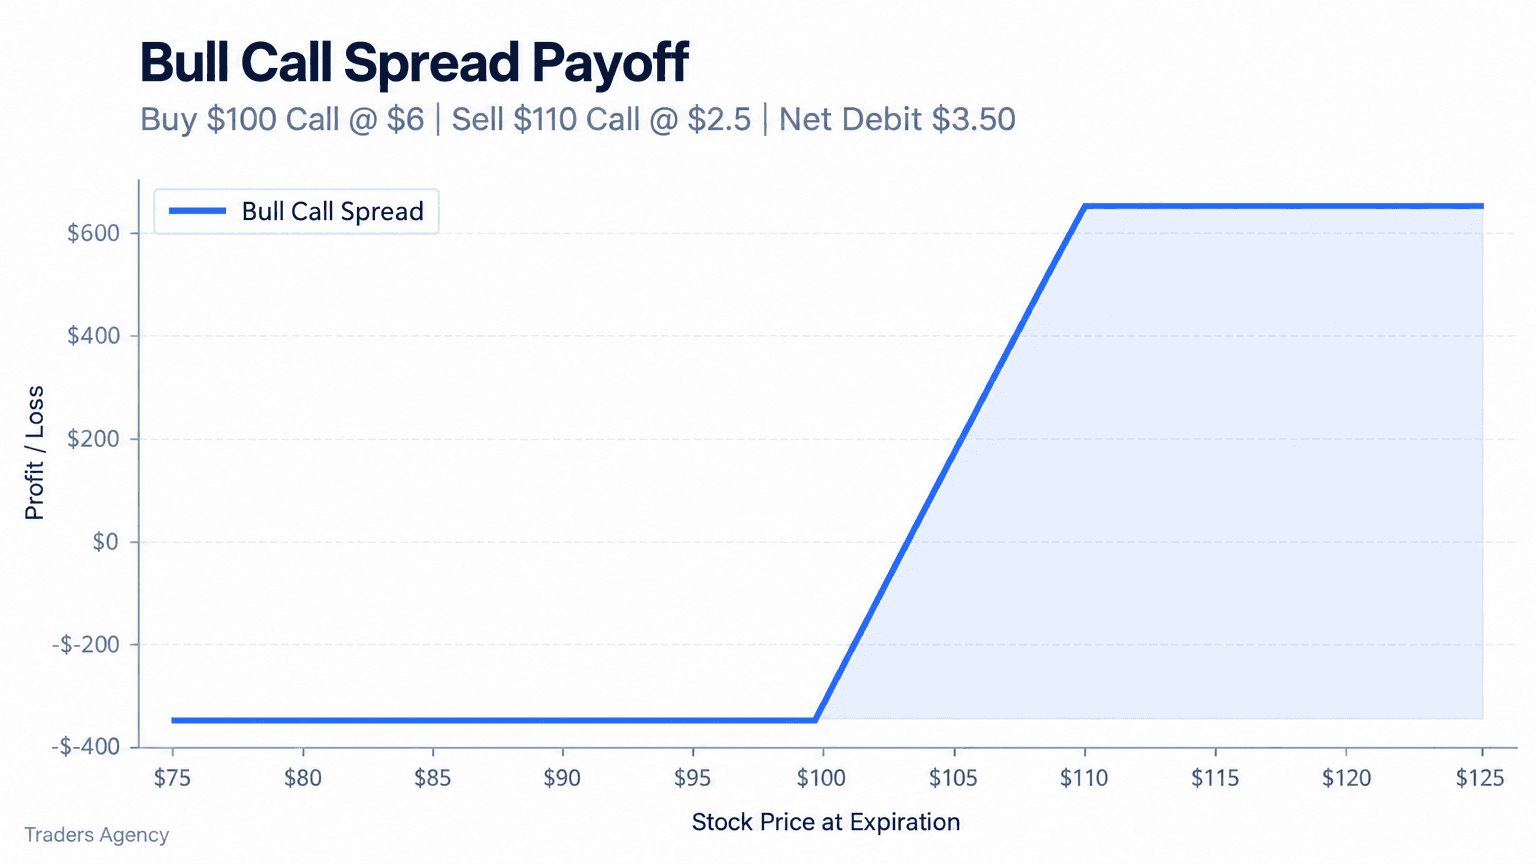
If you believe a stock will rise but don't want to risk a large sum, a bull call spread is often the cleanest beginner tool. You buy a call at a lower strike and sell a call at a higher strike, same expiration.
Say a stock trades at $102. You buy the $100 call for $5.50 and sell the $110 call for $1.50. Your net cost (the debit) is $4.00 per share, or $400 per contract.
| Parameter | Value |
|---|---|
| Stock Price | $102 |
| Long Call | $100 strike, paid $5.50 |
| Short Call | $110 strike, sold for $1.50 |
| Net Debit | $400 per contract |
| Max Loss | $400 if the stock finishes at or below $100 |
| Max Gain | $600 if the stock finishes at or above $110 |
| Breakeven | $104 ($100 strike plus the $4 debit) |
This is a defined-risk trade from the moment you open it. You know your worst case before you click the button.
2. Neutral Outlook: Range-Bound Income Strategies
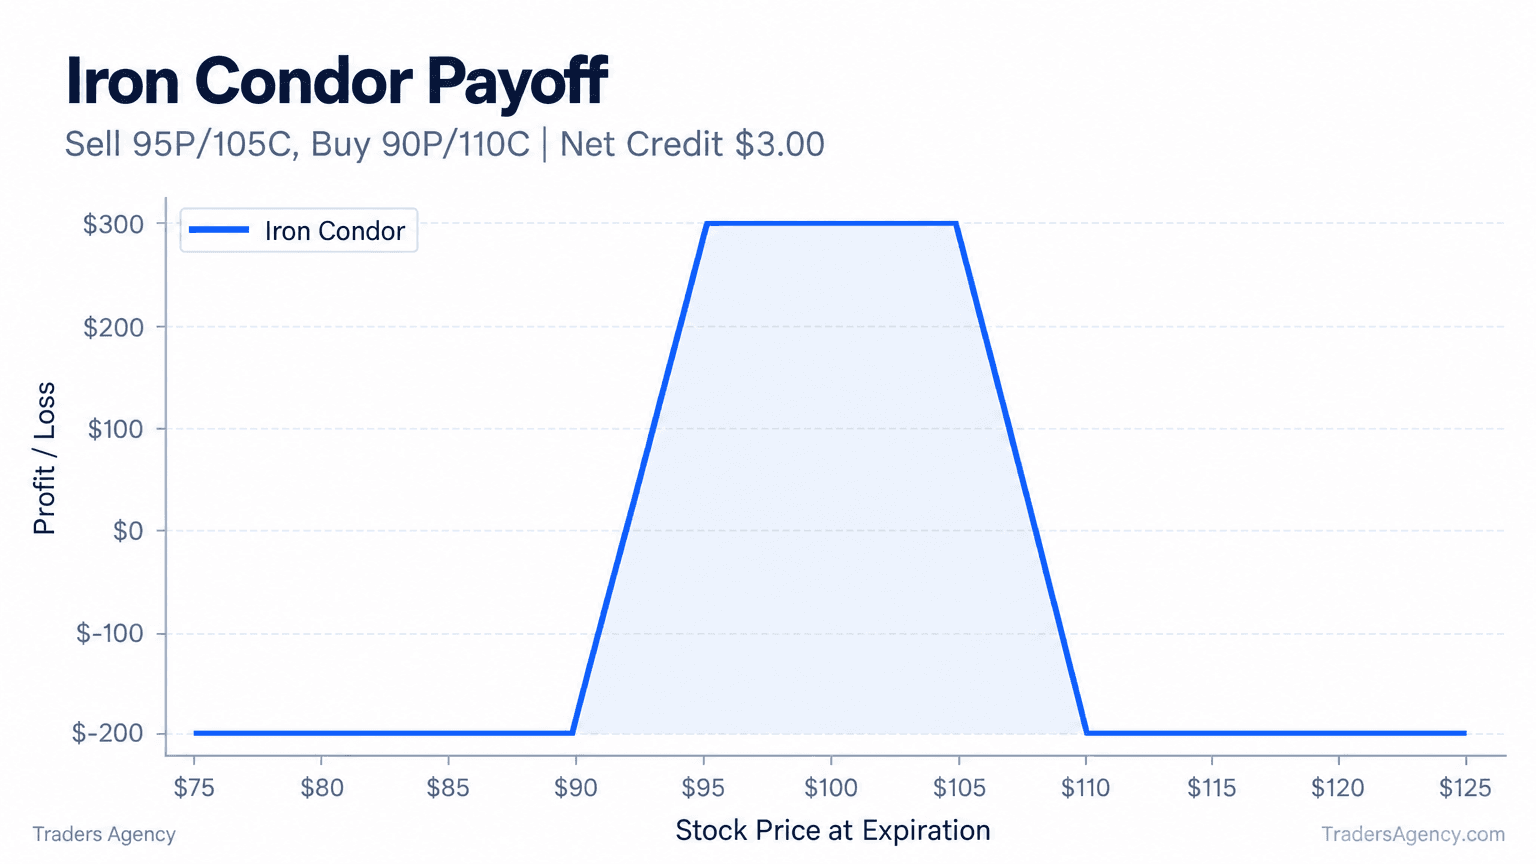
When you think a stock will stay between two levels rather than make a big move, directional strategies stop making sense. This is where an iron condor comes in: selling a call spread above the price and a put spread below it, collecting premium from both sides.
Imagine a stock sitting at $100. You sell the $105 call and buy the $110 call, then sell the $95 put and buy the $90 put, collecting $150 in total premium. As long as the stock stays between $95 and $105 through expiration, you keep the full credit.
| Scenario | Stock Price at Expiration | Profit/Loss |
|---|---|---|
| Max Profit | Between $95 and $105 | +$150 |
| Lower Breakeven | $93.50 | $0 |
| Upper Breakeven | $106.50 | $0 |
| Max Loss | Below $90 or above $110 | -$350 |
Want expert trading insights delivered daily?
Join thousands of traders who rely on Traders Agency for market analysis and trade ideas.
Join Traders AgencyKey Characteristics of Call and Put Options
Before any strategy makes sense, you need to understand the two raw building blocks: calls and puts.
A call option gives you the right (not the obligation) to buy 100 shares at a fixed strike price before expiration. A put option gives you the right to sell 100 shares at a fixed strike price. That's the whole mechanism sitting underneath every multi-leg strategy you'll ever trade. Contract specifications for listed U.S. options are published by the exchanges, including Cboe, if you want to see the raw mechanics.
Here are three simple examples side by side:
| Position | Cost | Needs the Stock To... | Max Loss |
|---|---|---|---|
| Buy a $50 call | $3.00 ($300) | Rise above $53 | $300 |
| Buy a $50 put | $2.50 ($250) | Fall below $47.50 | $250 |
| Sell a covered call | Collect premium | Stay flat or rise modestly | Shares fall to zero, offset by premium |
If you sketch the payoff shapes, a long call looks like a hockey stick angled upward with a flat floor below the breakeven. A long put is the mirror image, gaining as the stock falls.
Why This Matters for Strategy Selection
Every spread, condor, and straddle is just calls and puts combined in different ratios and strikes. Once you understand the two base shapes, multi-leg strategies become simple addition.
How Do the Greeks Affect Your Strategy Choice?
The Greeks (delta, theta, and vega) tell you how sensitive an options position is to price movement, time, and volatility. We teach traders to let the Greeks influence which strategy they pick, not just how they manage it afterward.
- Delta measures how much an option's price moves relative to a $1 move in the stock. A 0.50 delta call behaves roughly like owning 50 shares. Higher-delta options give you more directional exposure per dollar risked; lower-delta options are cheaper but need a bigger move to pay off.
- Theta measures time decay, the value an option loses each day simply from the clock ticking. Option buyers fight theta. Option sellers (like in the iron condor above) collect it. If you expect a slow, grinding market, selling premium puts theta to work for you instead of against you.
- Vega measures sensitivity to changes in implied volatility. When you expect a big volatility event such as earnings, a strategy that benefits from rising volatility (buying options) makes more sense than one that gets hurt by it (selling options).
Volatility Outlook: Straddles and Strangles
If you expect a large move but aren't sure which direction, a long straddle (buying a call and a put at the same strike) or a long strangle (buying a call and put at different, wider strikes) lets you profit either way, as long as the move is big enough to clear both breakevens.
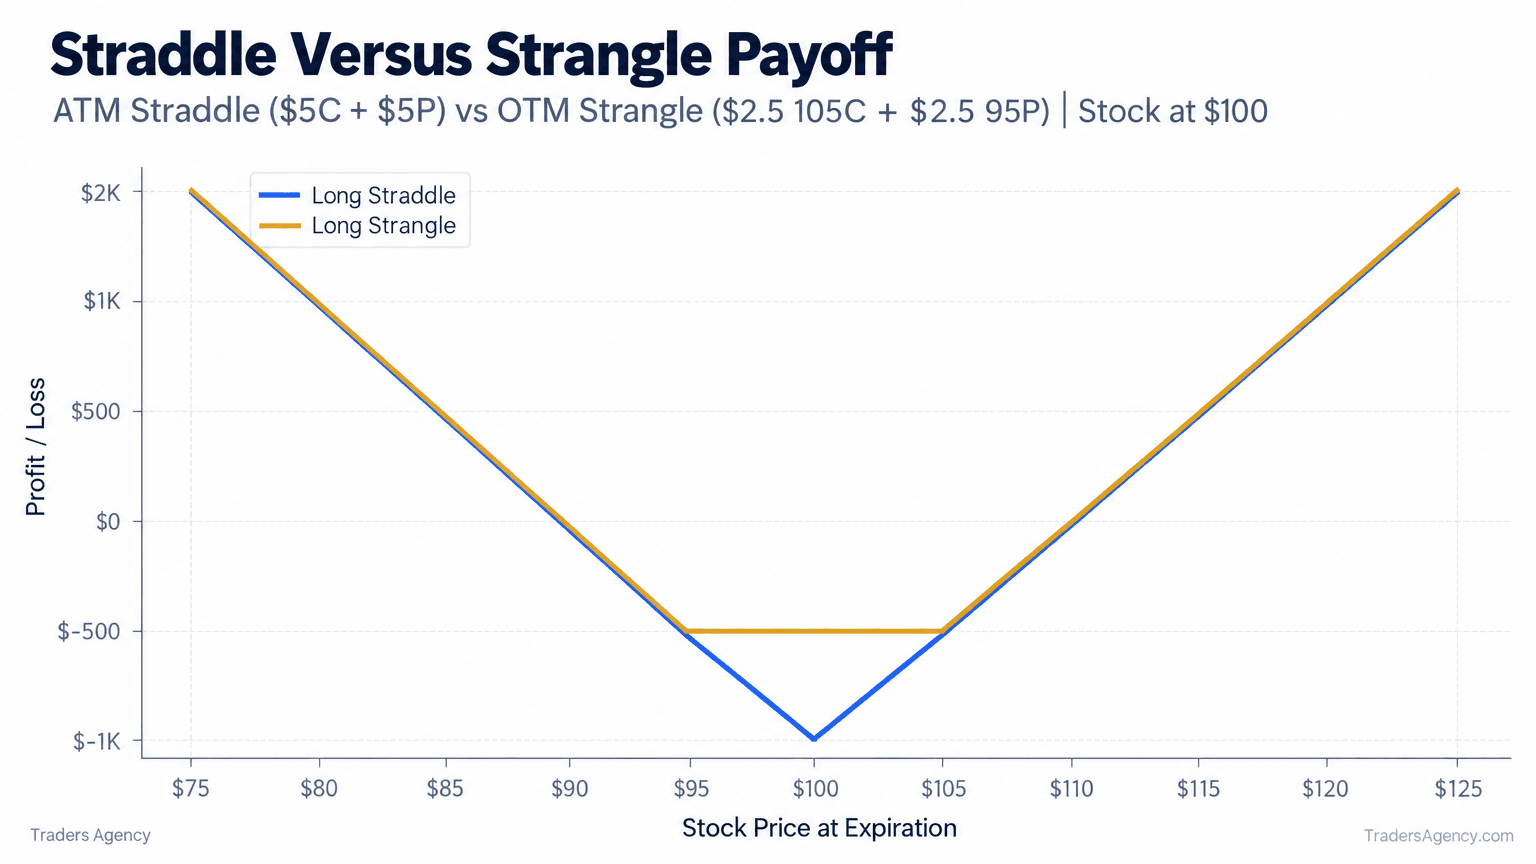
Straddles cost more but have a closer breakeven. Strangles cost less but need a larger move to turn a profit.
Watch Out: There is no such thing as a zero-risk options strategy. Both straddles and strangles can lose 100% of the premium paid if the stock simply sits still through expiration.
Risk Management Considerations Before You Trade
Position Sizing and Capital
A rule we teach every new trader: risk no more than 1% to 2% of total account capital on a single options trade. On a $10,000 account, that means keeping max loss on any one trade in the $100 to $200 range.
This is also where defined-risk structures like spreads beat naked options for beginners. You know your maximum loss the moment you enter, instead of hoping you can exit in time.
Protecting an Existing Position
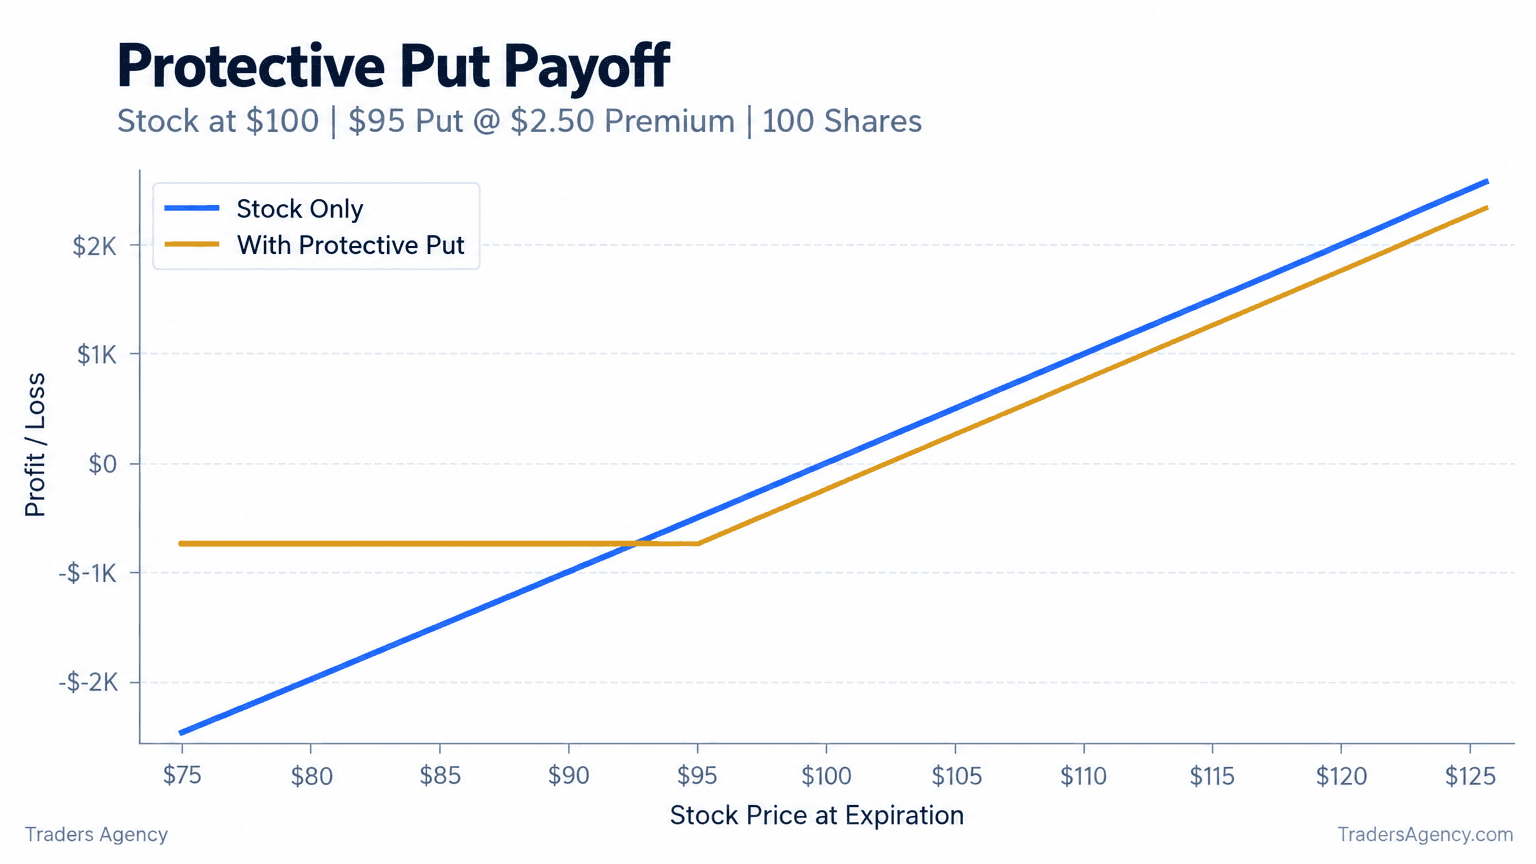
If you already own shares and want downside protection without selling, a protective put does the job. Buying a $95 put on a stock you own at $100 caps your downside at roughly the put's strike, minus the premium paid, while leaving your upside open.
Why Do So Many Options Traders Lose Money?
Most options traders lose money because they buy options with no defined risk plan, hold through time decay, and size positions far too large relative to their account. No downloadable "best strategy" cheat sheet fixes that. The fix is process and discipline.
The traders who survive tend to do three things consistently:
- They define max loss before entering.
- They size positions small relative to total capital.
- They match the strategy to the actual market condition instead of their emotions.
The wheel strategy, which combines selling cash-secured puts and covered calls on stock you're genuinely willing to own, is popular partly because it forces this kind of discipline through repeated, smaller trades rather than one large directional bet.
A Step-by-Step Decision Framework
When you're not sure which way to go, run through this checklist every time:
- Step 1: Identify your directional bias. Bullish, bearish, or neutral on the underlying stock.
- Step 2: Estimate your volatility outlook. Do you expect a big move, a small move, or sideways chop?
- Step 3: Set your maximum acceptable loss in dollars, not percentages, before you open the chain.
- Step 4: Match the combination to a strategy family. Directional spreads for a clear bias, condors or credit spreads for neutral views, straddles or strangles for volatility bets.
- Step 5: Check your capital against the trade's requirements, including margin for any short options.
- Step 6: Confirm the expiration date gives your thesis enough time to play out.
- Step 7: Place the trade only after all six prior steps check out.
Remember This: If any one of the first six steps fails, the answer is no trade. Sitting out is a position too, and it costs you nothing.
Putting It All Together
Strategy selection isn't about memorizing every possible combination of calls and puts. It's about building the habit of asking direction, volatility, and risk tolerance questions before you ever look at a strike price.
Start with the simplest structure that matches your view: a single call or put for a strong, quick directional idea, a spread when you want defined risk, and premium-selling strategies like the wheel or an iron condor when you expect a market to stay range-bound. Practice each one on paper until the payoff shapes feel obvious, then scale into real size slowly.
Our education team publishes new strategy guides and market analysis every week.
Want expert trading insights delivered daily?
Join thousands of traders who rely on Traders Agency for market analysis and trade ideas.
Join Traders AgencyDISCLAIMER: Traders Agency does not offer financial advice. The information provided is for educational purposes only and should not be considered financial advice. Traders Agency is not responsible for any financial losses or consequences resulting from the use of the information provided. Trading carries inherent risks and may not be suitable for all individuals. You are advised to conduct your own research and seek personalized advice before making any investment decisions, recognizing the potential risks and rewards involved.
See more from Traders Agency on Google
Make us a preferred source and our market analysis will appear more prominently in your Google Search, Top Stories, and AI results.
Add to Preferred Sources