Stocks are hitting fresh records while rates sit at multiyear highs, and our team has been tracking this divergence closely. The relationship between bond yields and equities has turned negative again, and the data is telling a story that every trader needs to hear right now. Here's what the numbers are showing us and what we think comes next.
How Long Can Stocks Defy Rising Bond Yields?
The honest answer: it depends on sector rotation and how long market sentiment holds up. Our analysis shows that while the broader market is grinding higher, the negative correlation between bond yields and equities could eventually weigh on rate-sensitive sectors if yields stay elevated at these levels.
Right now, SPY has posted a 60-day price change of +2.34%. That kind of positive price action, with interest rates sitting at these levels, challenges the traditional playbook. The broader market is absorbing a higher cost of capital without breaking its upward trend, and that tells us something about the strength of the underlying bid.
The Divergence: Over the past 60 days, SPY is up +2.34% while TLT (long-term bonds) has dropped -4.21%. Stocks and bonds are moving in opposite directions, and the financial sector is a major reason why.
Which Tickers Signal When This Trend Shifts?
Our research team is focusing on specific tickers to measure this dynamic in real time. TLT, which tracks long-term Treasury bonds, shows a 60-day price change of -4.21%. Since bond prices move inversely to yields, this drop is a direct reflection of the rising rate environment we're seeing across the curve.
While TLT falls, equities keep pushing higher. This creates an unusual environment for anyone watching the broader credit picture. Borrowing costs across the economy are elevated, yet the equity market continues to absorb the pressure. The bond yield and equity relationship has clearly inverted once again, and we think traders need to pay close attention to how long this can hold.
What Happens to Stocks When Rates Hit Multiyear Highs?
Historically, stocks tend to face headwinds when interest rates reach these levels because borrowing costs rise across the economy. But the current cycle is showing us that the impact is not uniform. Specific sectors, particularly financials, can actually benefit from a higher-rate environment. And that's exactly what we're seeing play out right now.
XLF has surged with a 60-day price change of +8.14%. That kind of outperformance in the financial sector explains a significant portion of the broader market's resilience. Financials have been a strong performer, and as long as that continues, the broader market may have room to hold these levels.
Sector Leader: XLF (Financial Select Sector SPDR) is up +8.14% over 60 days, massively outperforming the broader SPY at +2.34%. This sector is a key driver of market strength right now.
Want expert trading insights delivered daily?
Join thousands of traders who rely on Traders Agency for market analysis and trade ideas.
Join Traders AgencyMarket Sentiment and Where Capital Is Flowing
The numbers tell a clear story about positioning. We're monitoring market sentiment closely, and the indicators show sustained bullishness across the board. The Fear & Greed index currently sits at 68, reflecting a strong appetite for risk among market participants.
Retail traders are also heavily engaged. WallStreetBets sentiment registers at 0.03, with 2,748 recent mentions across the forum. This retail participation adds another layer of momentum, and it helps explain how stocks have been able to sustain these record levels even as the rate environment tightens.
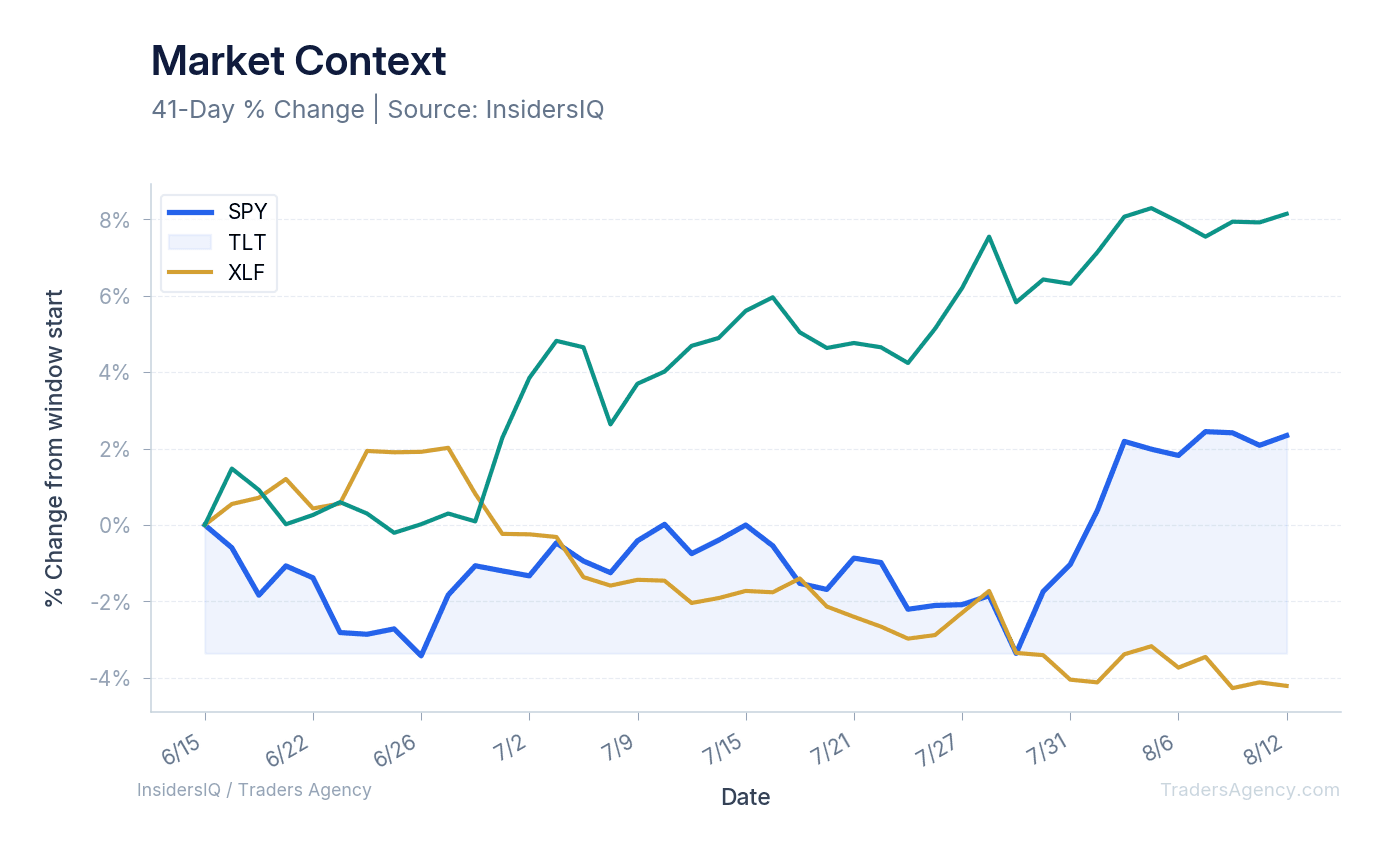
The chart above highlights the normalized price performance of SPY, TLT, and XLF over the last 60 days. The divergence between the financial sector and long-term bonds is stark, and it provides a clear visual of the dynamics we've been describing.
What Should Traders Watch as Bond Yields Stay Elevated?
Our team is focused on a few key areas as this market dynamic plays out. The competition for capital between yields and stocks will likely dictate the next major move, and we want to be positioned ahead of it.
Here are the primary signals we're tracking:
- TLT Price Action: With TLT down -4.21%, we're watching for any signs of a bottom in long-term bonds. A reversal here could signal a shift in the broader rate environment and change the calculus for equities.
- Financial Sector Strength: XLF is up +8.14%, and its continued performance is a key factor in whether the broader market can maintain current levels. If financials begin to sell off, the broader market could follow.
- Broader Market Support: SPY is holding a +2.34% gain over the last 60 days. We're monitoring this closely to see if the broader market can sustain its upward trajectory or if the weight of higher rates eventually catches up.
Traders should also keep an eye on broader borrowing cost indicators, including interest rates today on 30-year fixed and 15-year mortgage rates. When borrowing costs stay elevated for extended periods, the effects can show up in consumer-facing sectors, and that's a risk we're watching carefully.
The Bottom Line
The negative relationship between bond yields and equities is real, and it's playing out in the data right now. But stocks defying rising bond yields is also a reality at this moment, driven largely by massive strength in the financial sector. This divergence won't last forever. When it breaks, the move could be significant in either direction.
Our team is staying focused on XLF and TLT as the two tickers most likely to signal when this trend shifts. If financials lose momentum or bonds find a floor, the broader market equation changes fast. We'll be watching, and we'll keep you updated.
Want expert trading insights delivered daily?
Join thousands of traders who rely on Traders Agency for market analysis and trade ideas.
Join Traders AgencyKey Takeaways
- SPY posted a +2.34% gain over the past 60 days while TLT dropped -4.21% over the same period, a clear divergence between equities and long-term bonds.
- Bond prices and yields move inversely, so TLT's decline confirms that long-term yields are sitting at elevated levels even as stocks grind higher.
- The financial sector (XLF) is cited as a major driver of stocks holding up against rising yields, since banks and financials can benefit from a higher rate environment.
- The article flags that rate-sensitive sectors could eventually face pressure if yields stay elevated, though the timing depends on how long market sentiment holds.
- XLF and TLT are identified as the two tickers most likely to signal a shift: if financials lose momentum or bonds find a floor, the broader market dynamic could change quickly.
DISCLAIMER: Traders Agency does not offer financial advice. The information provided is for educational purposes only and should not be considered financial advice. Traders Agency is not responsible for any financial losses or consequences resulting from the use of the information provided. Trading carries inherent risks and may not be suitable for all individuals. You are advised to conduct your own research and seek personalized advice before making any investment decisions, recognizing the potential risks and rewards involved.
See more from Traders Agency on Google
Make us a preferred source and our market analysis will appear more prominently in your Google Search, Top Stories, and AI results.
Add to Preferred Sources