
The bond market is sending a notable signal this morning. U.S. Treasury yields dipped on Thursday as traders processed the July consumer inflation print and turned their attention to the upcoming producer price index release. Our research team is watching these movements closely because they carry potential implications for trading strategies across equities and fixed income.
What Happens to Treasury Yields When Inflation Data Drops?
When inflation data is released, Treasury yields typically adjust based on shifting expectations for Federal Reserve rate policy. If inflation cools, yields often drop as traders price in a lower probability of further tightening. Conversely, hot inflation prints usually drive yields higher as the market recalibrates.
Our analysis shows a clear reaction in the bond market right now. We're tracking several specific moves across the yield curve:
- The yield on the 10-year U.S. Treasury note fell 2 basis points to 4.672%
- The 2-year Treasury note yield dropped more than 2 basis points to 4.178%
- The longer-dated 30-year Treasury bond yield fell less than 1 basis point to 5.238%
Key Move: The 2-year Treasury yield, the most rate-sensitive part of the curve, dropped more than 2 basis points to 4.178%, reflecting shifts in short-term rate expectations.
What Does the Wholesale Inflation Data Show?
The July reading of the U.S. producer price index measures what wholesalers pay for raw goods and materials. Economists expect an increase of 0.2% from the prior month. This report follows an in-line reading on the consumer price index, where CPI for July increased by 0.1% month over month.
We're monitoring these exact figures because they shape the broader trend for interest rates that U.S. markets will face. The tame CPI print and the anticipated PPI reading coincide with the current yield compression.
How Do Treasury Yields Affect the Stock Market?
Treasury yields affect the stock market by altering the cost of capital and changing the relative attractiveness of equities compared to risk-free bonds. When yields fall, borrowing becomes cheaper for companies, which often boosts stock prices. Higher yields typically pressure stock valuations downward.
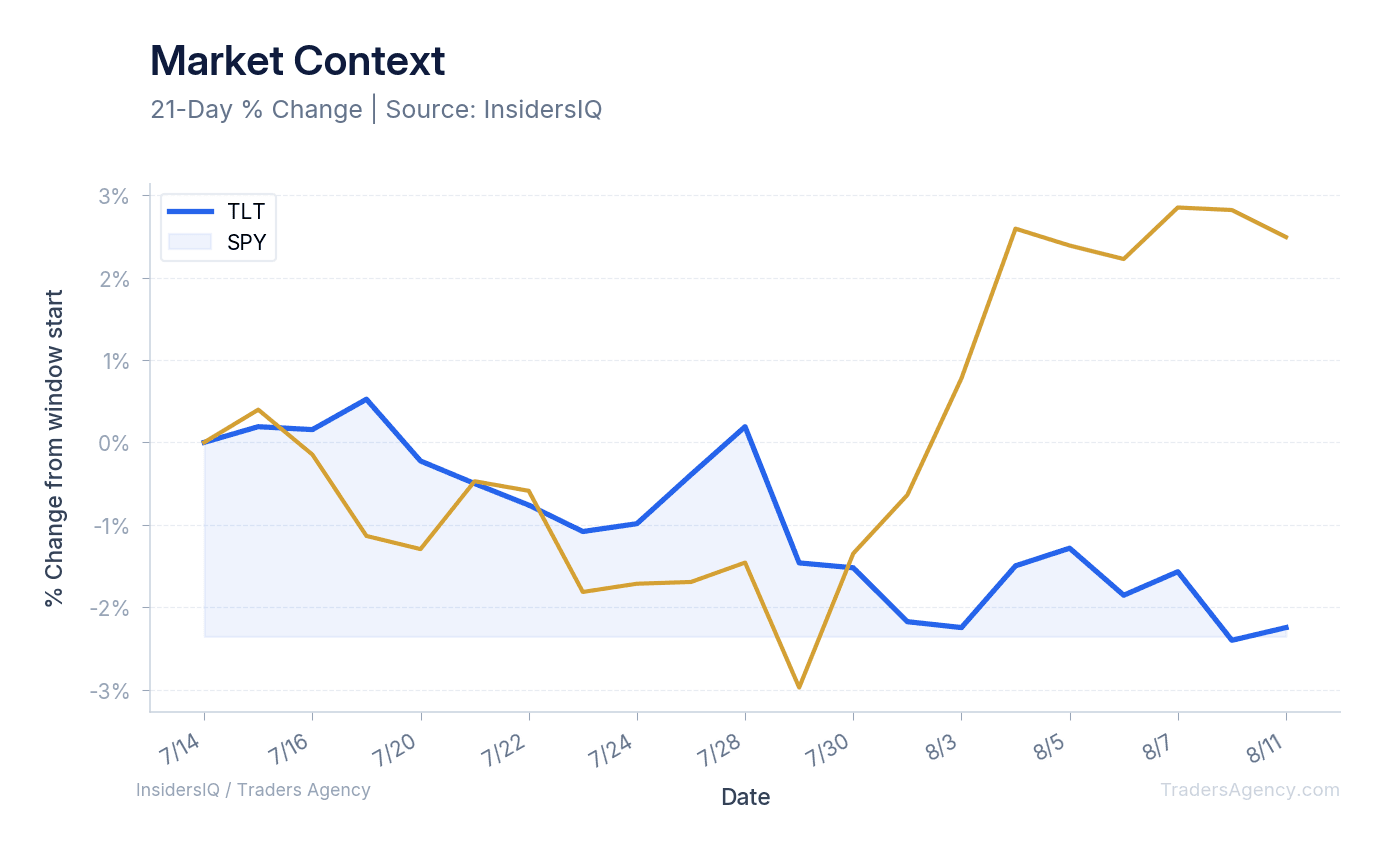
The data we're tracking confirms this inverse relationship. Over the last 30 days, the TLT exchange-traded fund tracking long-term Treasuries shows a price change of -2.25%. In contrast, the broader market represented by the SPY exchange-traded fund gained +2.49%. Market sentiment currently sits at a Fear & Greed index reading of 68, with WallStreetBets sentiment at 0.03 across 2,748 mentions.
Want expert trading insights delivered daily?
Join thousands of traders who rely on Traders Agency for market analysis and trade ideas.
Join Traders AgencyWhen Might the Fed Lower Interest Rates?
The exact timing for a rate cut depends on continued evidence of cooling inflation across multiple reports. Traders recently pared back bets on a September rate hike, but central bank officials would likely want to see the August CPI and PPI before deciding whether to hike at the September meeting.
Our read on the situation: Goldman Sachs wrote in a note Thursday that most FOMC voters would likely view the expected July inflation numbers as acceptable, and would want to see the August CPI and PPI before deciding whether to hike at the September meeting. Separately, Deutsche Bank's Jim Reid noted that two consecutive relatively encouraging core inflation reports, combined with weaker employment data, could leave less pressure on the Fed to act immediately in September.
What Key Signals Should Traders Watch Right Now?
Our team believes the current setup demands strict attention to upcoming economic releases. Here are the primary factors we're tracking:
- The 8:30 a.m. ET PPI Release: The exact print relative to the 0.2% expected wholesale inflation increase will set the immediate tone for bond markets.
- Short-Term Yield Action: The 4.178% level on the 2-year Treasury note serves as an important barometer for short-term rate expectations.
- August Inflation Prints: The upcoming August CPI and PPI reports could play a significant role in shaping the September policy decision.
Level to Watch: The 10-year yield at 4.672% is our baseline for broader borrowing costs. A decisive break below this level on a soft PPI print could signal a more sustained shift in rate expectations.
The Bottom Line
The recent dip in Treasury yields highlights a market heavily focused on the upcoming wholesale inflation data. We're watching the 4.672% level on the 10-year note as a reference point for broader borrowing costs. Traders should prepare for potential volatility as the market digests the producer price index and adjusts expectations for the September Fed meeting. One data point won't settle the rate debate on its own, but it could move markets in the short term.
Want expert trading insights delivered daily?
Join thousands of traders who rely on Traders Agency for market analysis and trade ideas.
Join Traders AgencyKey Takeaways
- The 10-year Treasury yield fell 2 basis points to 4.672% and the 2-year yield dropped more than 2 basis points to 4.178% as traders shifted focus from the July CPI print to the upcoming PPI release.
- The 2-year Treasury note is the most rate-sensitive part of the curve, making its move to 4.178% a key signal for short-term rate expectations.
- Economists expect the July producer price index to show a 0.2% month-over-month increase.
- The article flags 4.672% on the 10-year note as a reference level to watch: a soft PPI print could push yields through that level and signal a more sustained shift in rate expectations.
- Traders should prepare for potential short-term volatility around the PPI release, particularly heading into the September Fed meeting, though the article notes one data point will not settle the broader rate debate.
DISCLAIMER: Traders Agency does not offer financial advice. The information provided is for educational purposes only and should not be considered financial advice. Traders Agency is not responsible for any financial losses or consequences resulting from the use of the information provided. Trading carries inherent risks and may not be suitable for all individuals. You are advised to conduct your own research and seek personalized advice before making any investment decisions, recognizing the potential risks and rewards involved.
See more from Traders Agency on Google
Make us a preferred source and our market analysis will appear more prominently in your Google Search, Top Stories, and AI results.
Add to Preferred Sources