The stock market today is flashing red, and our research team is tracking a collision of forces that demands immediate attention. A scorching May CPI print just landed alongside escalating US-Iran military strikes, and the result is a broad sell-off across all three major indices. The tech sell-off that started Tuesday is deepening. Here's what we're seeing and what it means for your positions right now.
What Is the US Stock Market Doing Today?
We're watching a broad, sustained sell-off across every major index. The Nasdaq Composite (^IXIC) is leading the decline with a 0.7% drop. The S&P 500 (^GSPC) and the Dow Jones Industrial Average (^DJI) are both down roughly 0.5%. The Fear & Greed index sits at 68, a reading we find concerning given the weight of today's news.
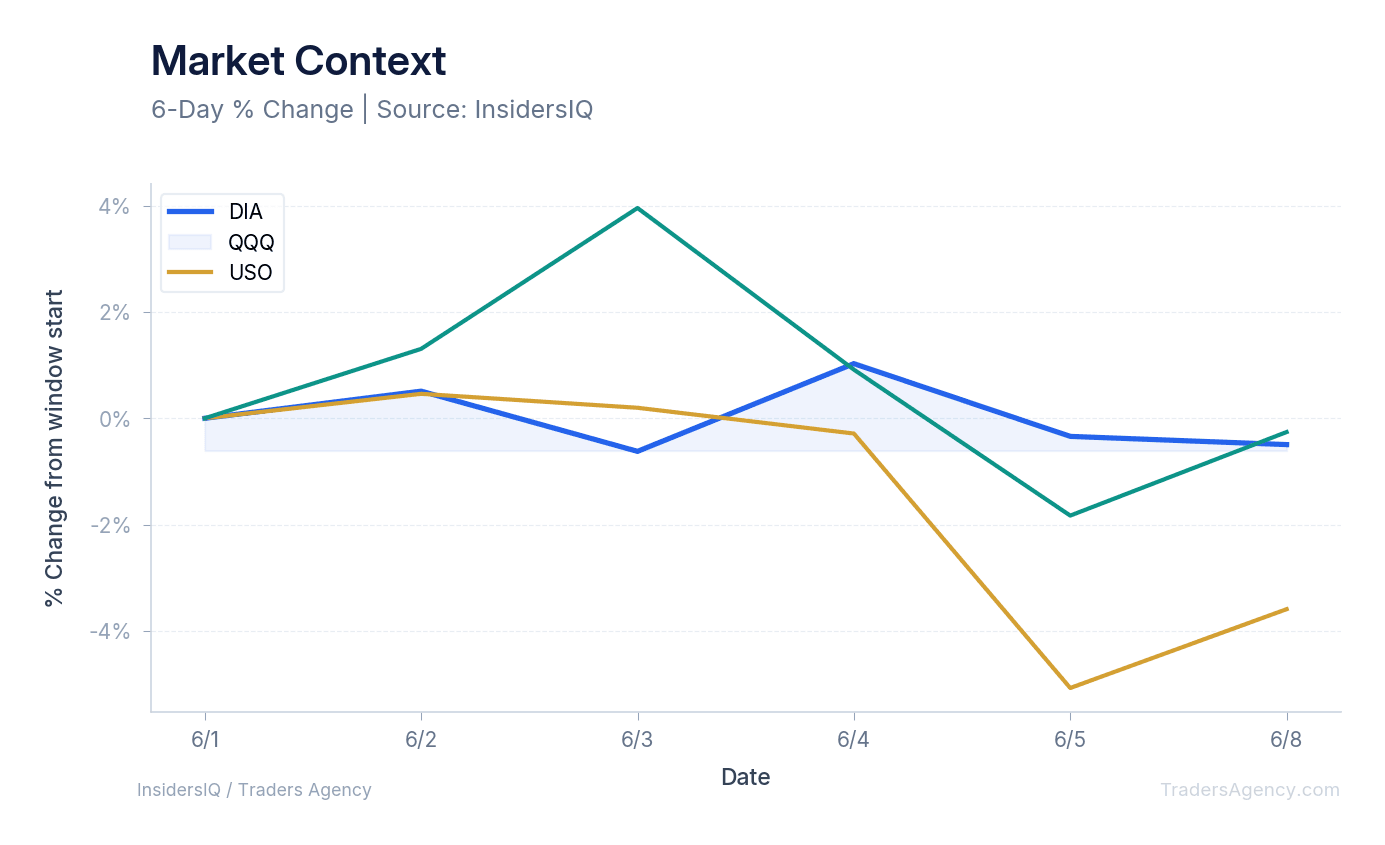
Key Level: The Dow Jones Industrial Average dropped to 50,710.85, shedding 161.26 points (-0.32%) as of 10:12 AM EDT. The QQQ has now fallen -3.59% over the past 10 trading days, signaling a sustained rotation out of tech.
The DIA shows a 10-day price change of -0.49%, confirming a slow bleed in blue-chip names over the past two weeks. But the real story is in the tech-heavy QQQ. That -3.59% 10-day decline is not a one-session blip. It reflects aggressive, sustained selling as the rotation out of the AI trade continues.
How Will the May CPI Report Affect Interest Rates?
The May CPI report came in at a 4.2% annual rise in consumer prices, the fastest rate since May 2023. The number was in line with expectations; however, the hot reading may boost bets that the Federal Reserve will hike interest rates this year.
Energy prices remained the biggest driver of inflation, and that's where the geopolitical situation becomes directly relevant. The protracted war with Iran continues to affect energy costs, which feeds back into the CPI calculation.
Our team believes this 4.2% reading changes the interest rate outlook. The possibility of higher rates puts pressure on growth stock valuations, which helps explain the selling we're seeing in tech today. If you're holding interest-rate-sensitive assets, prepare for increased volatility in the sessions ahead.
Hitting the highest inflation level in three years challenges the assumption that inflation is fully contained.
Geopolitical Tensions and the Energy Sector
The situation between the US and Iran escalated, with the two sides trading strikes overnight after the downing of an Apache helicopter. President Trump said on Wednesday that Iran has "taken too long" to negotiate and would have to "pay the price." These comments cast doubt on the odds for peace talks.
Oil prices gained after Trump's post to social media.
However, the USO still shows a 10-day price change of -0.26%. That slight decline over the broader window suggests the energy market was trending lower before today's developments. We're watching this sector closely given the ongoing military tensions.
The intersection of geopolitics and inflation creates a difficult environment for equities. Higher oil prices feed directly into CPI data, which in turn affects the Fed's policy stance and pressures the broader stock market. Traders need to understand this chain reaction because it's driving price action across multiple asset classes right now.
Want expert trading insights delivered daily?
Join thousands of traders who rely on Traders Agency for market analysis and trade ideas.
Join Traders AgencyWhy Is the Tech Sell-Off Getting Worse?
Tech stocks are set for another bruising session. Tuesday's aggressive sell-off has spilled over into Wednesday trading, and the rotation out of the AI trade continues as concerns around OpenAI (OPAI.PVT) and Anthropic's (ANTH.PVT) mega-IPOs build.
The Nasdaq's 0.7% drop today confirms this sector-wide weakness. Combined with the -3.59% 10-day decline in the QQQ, we're looking at a sustained rotation out of the AI trade.
What Does the Fear and Greed Index Say About Market Sentiment Right Now?
The current sentiment metrics reveal a complex psychological environment. The Fear & Greed index at 68 tells us a meaningful level of greed remains in the market despite today's aggressive sell-off. Our team views this elevated reading as a potential warning sign.
Sentiment Disconnect: The Nasdaq Composite is down 0.7% today and QQQ has shed -3.59% over 10 days, yet the Fear & Greed index still reads 68. When sentiment stays elevated during a sell-off, it often signals that traders have not fully priced in the new risks.
Retail participation data supports this cautious outlook. WallStreetBets sentiment is registering a flat 0.03 with total mentions at 2,748 for the session. This low sentiment score combined with moderate mention volume suggests retail traders are uncertain given conflicting signals. They're watching the Dow slide to 50,710.85 but are hesitant to aggressively short the market.
We believe this hesitation creates a dangerous setup if the tech rotation accelerates further. The 4.2% CPI print may take several days to fully digest.
What Should Traders Watch After Today's CPI Report?
Our team is monitoring several specific events that will dictate market direction through the end of the week. The current volatility demands strict attention to these upcoming developments.
1. Oracle Earnings Report
All eyes are on Oracle (ORCL), which releases results after the close today. Oracle counts OpenAI as a customer for its cloud services. Details of its cloud business are in focus given the fluctuations in the AI trade. Any weakness there could trigger further selling across the tech sector.
2. The SpaceX Public Offering
The main event of the week lands on Friday. The expected IPO of Elon Musk's SpaceX (SPCX) is set to hit the market. Its debut is expected to mark the largest public offering in history. A successful debut could inject optimism back into growth equities. A weak reception could accelerate the current market slide.
3. Key Market Signals
Traders should monitor these specific data points as the week progresses:
- DIA price action to gauge blue-chip stability after the -0.49% 10-day drop
- QQQ volume trends to determine if the -3.59% 10-day decline accelerates
- USO intraday movements following the US-Iran military strikes
- Updates on the OpenAI (OPAI.PVT) and Anthropic (ANTH.PVT) IPO timelines
- Changes in the Fear & Greed index from its current reading of 68
The Bottom Line
The combination of a 4.2% CPI reading and escalating US-Iran tensions has shifted market momentum. Our team is actively tracking the rotation out of tech and preparing for significant volatility around the Oracle earnings and the SpaceX IPO. Traders need to manage risk tightly as the Federal Reserve digests this hot inflation data and geopolitical risks multiply across the energy sector. The data is clear: this is not a day to be complacent.
Want expert trading insights delivered daily?
Join thousands of traders who rely on Traders Agency for market analysis and trade ideas.
Join Traders AgencyKey Takeaways
- May CPI came in at 4.2% annually, the fastest pace since May 2023, reinforcing expectations that the Fed has little room to cut rates in the near term.
- The Nasdaq is leading the sell-off with a 0.7% decline, while the S&P 500 and Dow are each down roughly 0.5% as of mid-morning trading.
- The QQQ has fallen 3.59% over the past 10 trading days, confirming this is a sustained rotation out of tech and AI-related names, not a single-session reaction.
- The Fear and Greed Index sits at 68, a level the research team flags as concerning given the simultaneous pressure from hot inflation data and escalating US-Iran military strikes.
- Traders should watch Oracle earnings and the SpaceX IPO as near-term volatility catalysts, alongside any shift in the Fear and Greed Index from its current reading.
DISCLAIMER: Traders Agency does not offer financial advice. The information provided is for educational purposes only and should not be considered financial advice. Traders Agency is not responsible for any financial losses or consequences resulting from the use of the information provided. Trading carries inherent risks and may not be suitable for all individuals. You are advised to conduct your own research and seek personalized advice before making any investment decisions, recognizing the potential risks and rewards involved.
See more from Traders Agency on Google
Make us a preferred source and our market analysis will appear more prominently in your Google Search, Top Stories, and AI results.
Add to Preferred Sources