

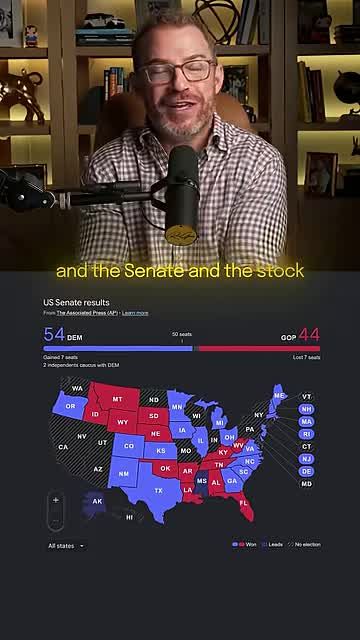
Democrats swept the election, taking full control of the House and the Senate, and the stock market responded by surging. That reaction confuses a lot of people who assume Wall Street only does well under one political party. It doesn't work that way, and the data backs that up. It's also the starting point for any honest stock market rally forecast right now.
Underneath the election headline, a bigger story is unfolding. AI stocks are getting hammered while everything outside of AI is ripping higher. Money is rotating fast, and if you can see where it's going, you can get ahead of it.
This isn't a hunch. It's pattern recognition built on charts, sector rotation, and nearly seventy-five years of market history.
Why Is Gridlock Bullish for Stocks?
Bottom Line: Gridlock, not any single party, is what historically pushes stocks higher, and that split-government setup is now in place. Underneath that, money is rotating out of AI stocks and into healthcare and banks, a shift worth tracking for any stock market rally forecast.
The market just got exactly what it wanted
Most people assume Wall Street wants Republicans in charge. That's not actually true. What the market wants is gridlock. When government is split, stocks historically perform at their best. That's precisely the setup we have now, with Democrats controlling both chambers.
Gridlock has historically been a strong backdrop for equities. The market didn't wait around to confirm this. It surged the moment the results came in.
Why Are AI Stocks Getting Crushed?
And the money isn't disappearing. It's moving.
The real story right now isn't the election. It's the split between AI stocks and everything else. Stack the Goldman Sachs AI basket against the S&P 500 with AI names stripped out, and the divergence is impossible to miss.
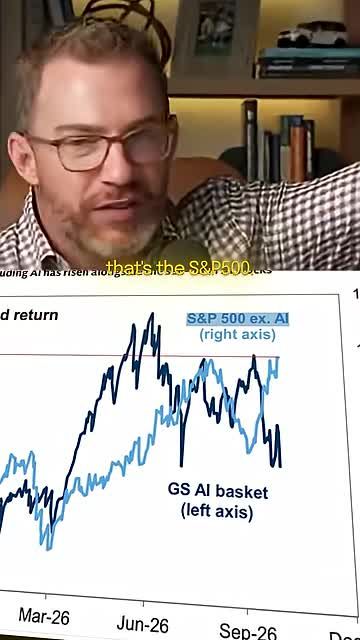
Go back to June, when the broader market started chopping sideways. The AI basket has done basically nothing for five months. It went wildly volatile, sold off, clawed some of it back, then took another big hit in September.
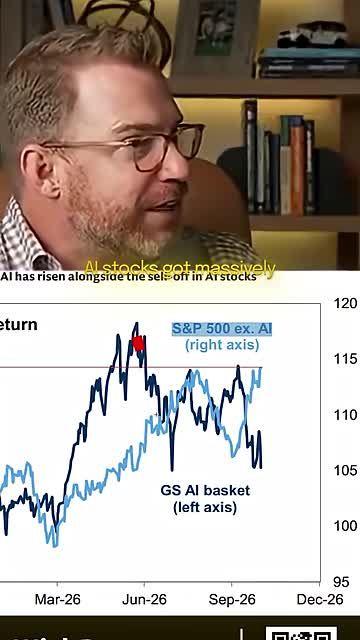
Non-AI stocks did the opposite over that same stretch. They surged higher.
Broadcom, a big name in the AI trade, is down 33 percent. That's not a dip. That's a major leader in the theme getting cut by a third while capital pours out and lands somewhere else.
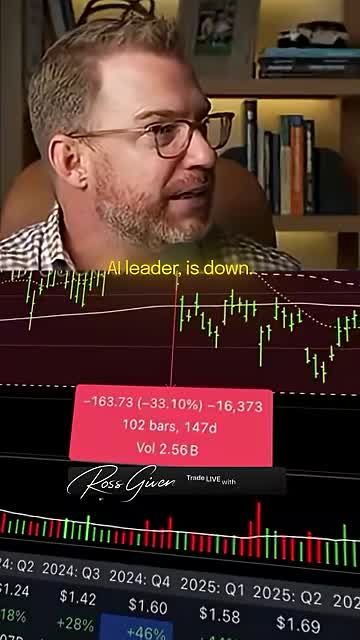
So where's it going? A lot of it is landing in healthcare and banks.
Healthcare and Banks Take the Lead
Healthcare tends to perform well in midterm election years, and that seasonal pattern is lining up with the rotation out of AI right now. The sector produced a perfect breakout pattern over the last couple of months, and the trades that came out of it were identified early because this pattern is recognizable, not a guess.
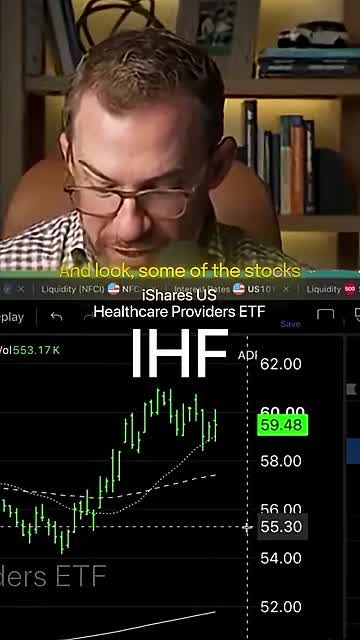
- Stryker: Black Ops members bought this name roughly three weeks ago, right as the breakout started forming.
- Hinge: Flagged a couple of months ago, well ahead of the current move.
- Healthcare broadly: A clean breakout pattern developed over the past two months.
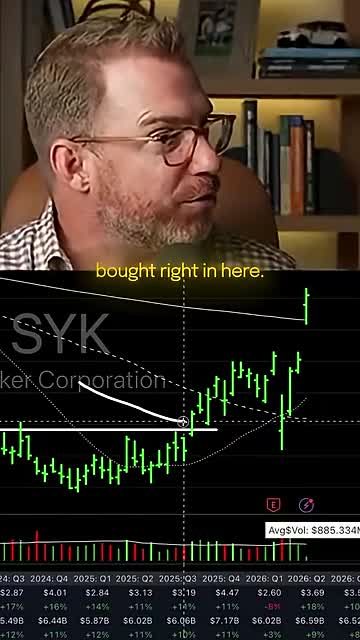
When AI stocks started chopping and then dumping, healthcare and banks picked up the slack, and that group is sitting up near highs.
Get an entire year of live weekly mentoring sessions, my newsletter, indicators, bonus reports, tons more. Click the link and I'll see you in the next live session.
Join my Black Ops Trading ClubAre Interest Rates Finally Rolling Over?
The interest rate run everyone's worried about is rolling over
The 10-year interest rate, the thing that's worried investors, is now rolling over instead of running higher. That shift is a key piece of the current stock market rally forecast.
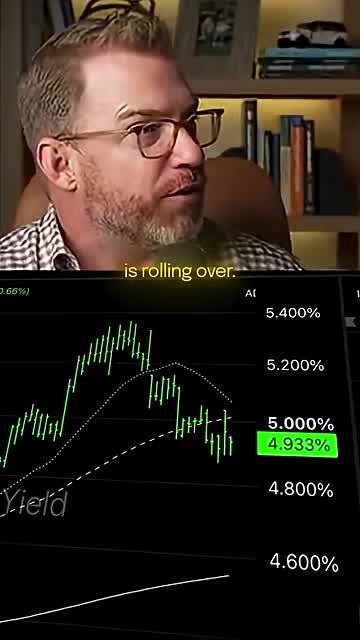
A gridlocked government, a rotation into healthcare and banks, and a 10-year rate that's rolling over: three separate tailwinds landing at the same time.
Stock Market Rally Forecast: Bull Market for the Next 12 Months?
Everything lines up the same way looking out over the next twelve months: a gridlocked government, sector rotation into healthcare and banks, and a 10-year rate that's rolling over. There's a historical stat that backs this up directly.
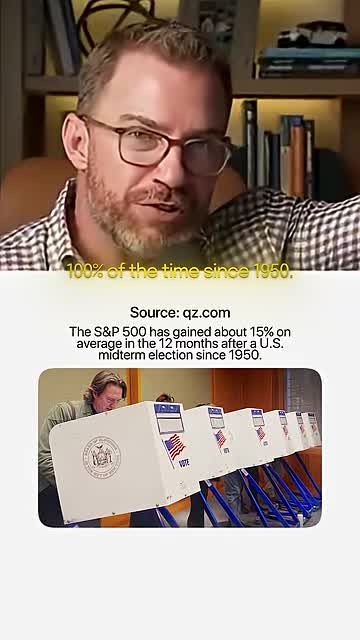
That's not a small sample size. That's decades of data pointing the same direction, and combined with the current setup, the next twelve months are shaping up to be very fruitful for stocks.
Positioning for What's Ahead
The setup right now is about as clean as it gets. A gridlocked government historically produces strong market conditions. AI stocks are getting hit while healthcare and banks surge. The 10-year rate is rolling over. And the historical base rate for the next twelve months since 1950 is perfect: 100 percent positive. That's the foundation of this stock market rally forecast.
None of this means every stock moves up in a straight line. Broadcom is still down 33 percent, and the AI trade has been genuinely rough for five months. But the rotation into healthcare, banks, and non-AI names is where the strength is showing up, and that's where the opportunity sits for the next leg of this move.
Watch where capital is rotating away from AI names. Pay attention to sectors with seasonal tailwinds, like healthcare in midterm years. And keep an eye on the 10-year rate as your signal for whether rate pressure keeps easing.
Frequently Asked Questions
Is a stock market rally coming?
A newly gridlocked government, a sector rotation out of AI stocks into healthcare and banks, and a 10-year rate that's rolling over all point toward a continued rally.
Will the next 12 months be a bull or bear market?
The current setup favors a bull market. Gridlock in Washington, strength in healthcare and banks, a 10-year rate rolling over, and a 100 percent positive track record for the 12 months following today's date since 1950 all support a bullish stock market rally forecast.
Should I pull my money out of the stock market?
Nothing here suggests pulling money out. AI stocks have been volatile, with Broadcom down 33 percent, but non-AI stocks are surging, with healthcare and banks sitting up near highs as capital rotates into those sectors.
What does a gridlocked government mean for stocks?
Historically, the stock market has performed best when government is split rather than controlled entirely by one party. With Democrats now controlling both the House and Senate, that gridlock condition is in place.
Get an entire year of live weekly mentoring sessions, my newsletter, indicators, bonus reports, tons more. Click the link and I'll see you in the next live session.
DISCLAIMER: Traders Agency does not offer financial advice. The information provided is for educational purposes only and should not be considered financial advice. Traders Agency is not responsible for any financial losses or consequences resulting from the use of the information provided. Trading carries inherent risks and may not be suitable for all individuals. You are advised to conduct your own research and seek personalized advice before making any investment decisions, recognizing the potential risks and rewards involved.
See more from Traders Agency on Google
Make us a preferred source and our market analysis will appear more prominently in your Google Search, Top Stories, and AI results.
Add to Preferred Sources