

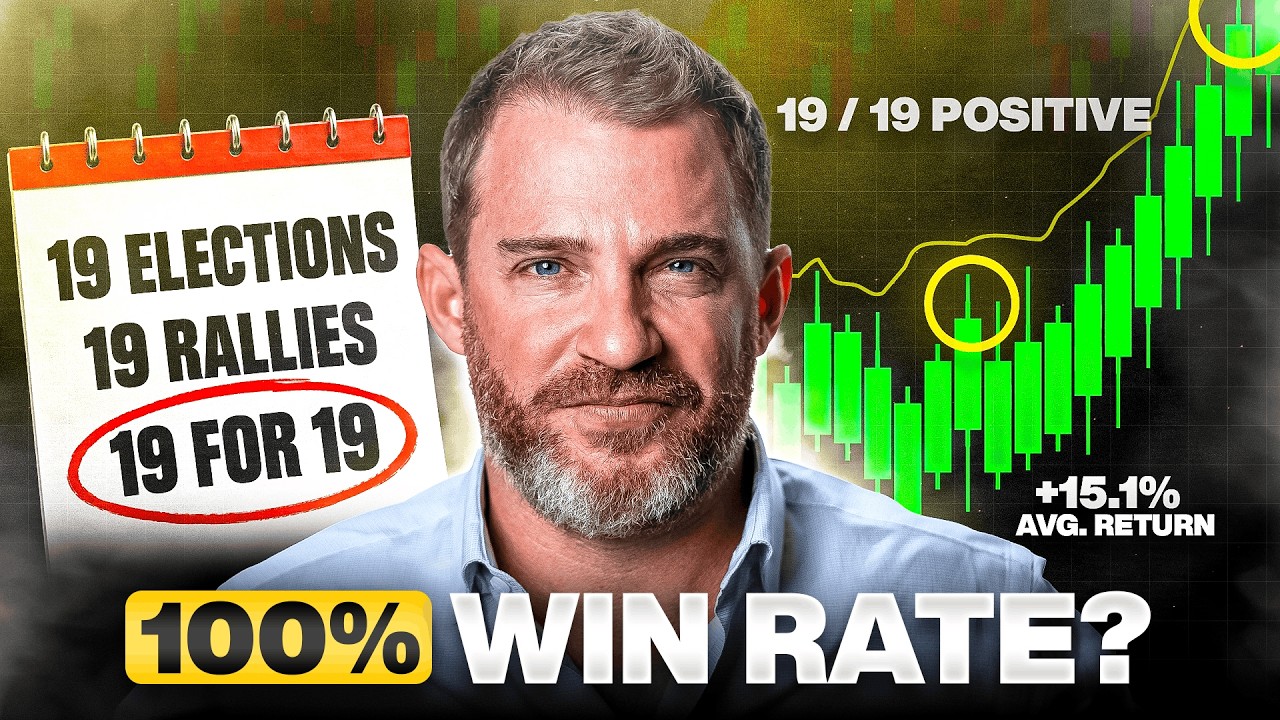
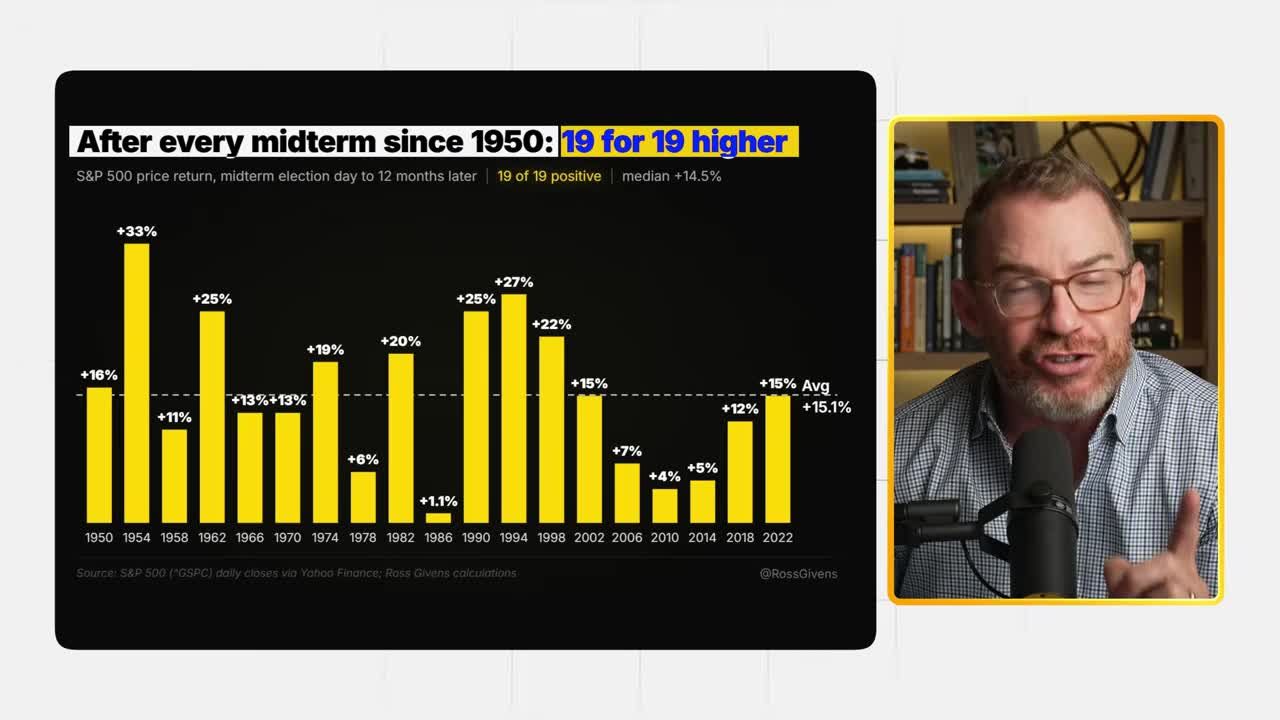
The stock market after midterms has a record most people have never heard of. Since 1950, there have been 19 midterm elections. Twelve months after every single one of them, the S&P 500 was higher. Not most of the time. Every time.
The average gain across those 19 windows comes out to roughly 15%. It didn't matter which party held the White House, which party controlled Congress, or whether the backdrop was war, recession, inflation, or an oil shock. The market went up anyway.
With Americans heading to the polls on November 3rd, here's why this happens, what the full data set says, and why the fourth quarter of 2026 might matter more than anything that happens on election night itself.
What Has the Stock Market Done After Every Midterm Election Since 1950?
The record holds up against every kind of chaos
I measured this from midterm election day (this year, November 3rd) to one year later, across all 19 midterms since 1950. Even the worst year in that stretch was a win.
Consider 1962, the year of the Cuban Missile Crisis: the market was up 25% the following year. Or 1974, in the middle of a brutal bear market with Watergate unfolding: up 19% the next year. The world looked terrifying in a lot of these years. The market didn't care.
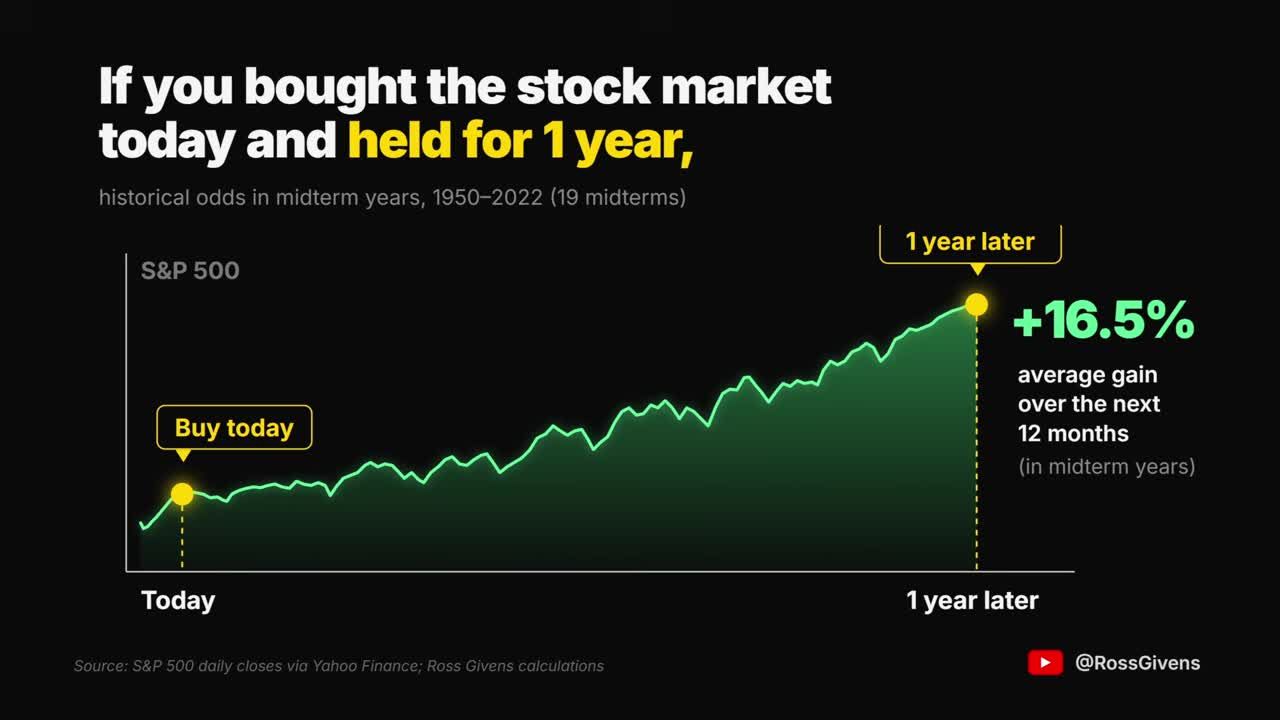
That means if you bought the stock market on the last day of October and held for a year, historically, that window has averaged roughly a 16.5% return over the following 12 months, though past patterns are not a guarantee of future returns.
This isn't speculation. It's pattern recognition.
Why Does Uncertainty Drive Stock Gains After Midterms?
Midterms move markets mainly by removing a question mark. For months before the vote, nobody knows who controls Congress, what happens to taxes, spending, health care, or regulation. Wall Street hates not knowing the rules of the game.
That uncertainty keeps money on the sidelines. Stocks chop around, volatility picks up, and every campaign ad tells voters the other side is about to wreck everything. Investors respond by waiting instead of buying.
Then the votes get counted. Whether you love the outcome or hate it, the uncertainty disappears. Wall Street now knows the rules for the next two years, and the cash that was sitting on the sidelines comes back into the market. That's the core mechanism behind the whole pattern, and it's the biggest reason the fourth quarter of a midterm year behaves so differently from the rest of the cycle.
The Weakest Year, The Strongest Quarter
Election years overall tend to be good for stocks, but the midterm year itself is actually the weakest year of the four-year presidential cycle. Running the S&P back to 1950, midterm years finished positive only 11 of 19 times, or 58%.
The back half of those same years tells a completely different story.
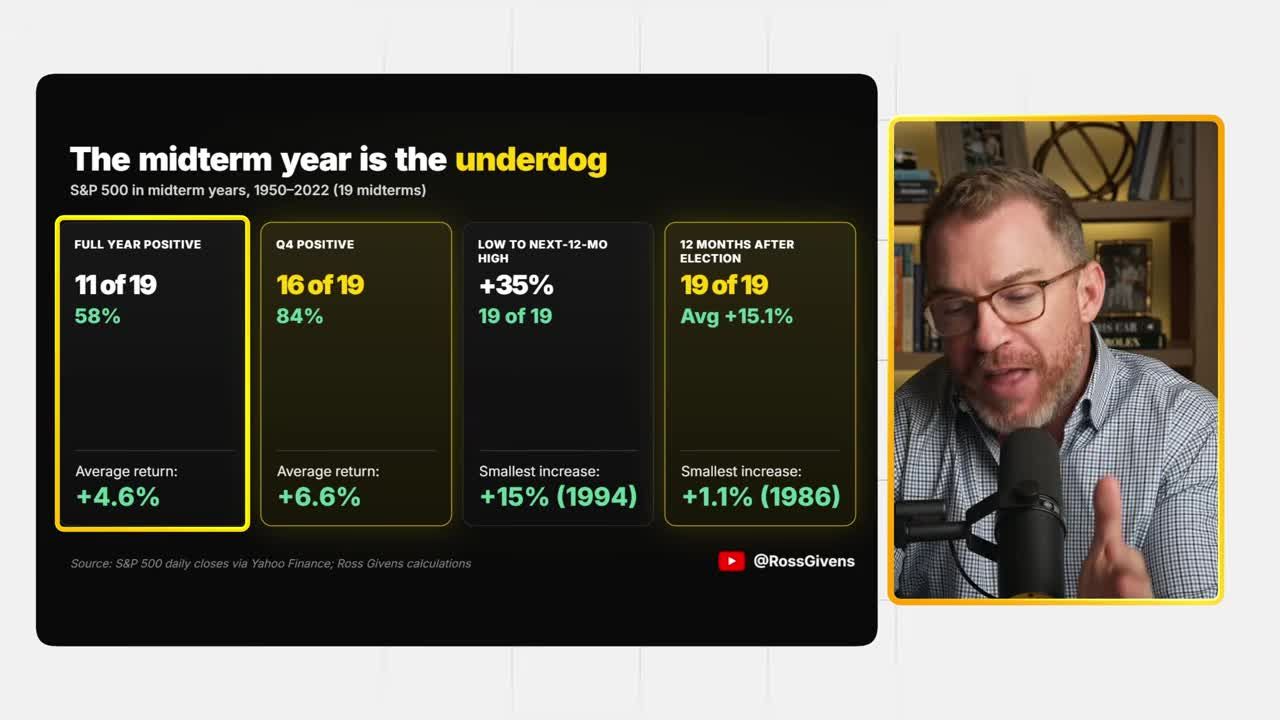
Since 1950, the S&P has averaged a 6.6% gain from the end of September to the end of December in midterm years, the exact three-month stretch we're sitting in right now. That's the best fourth quarter of the entire four-year cycle. Other years in the cycle average somewhere between 2.5% and 3.5% over the same stretch.
That midterm Q4 window has been positive 16 of 19 times, a win rate of roughly 86%.
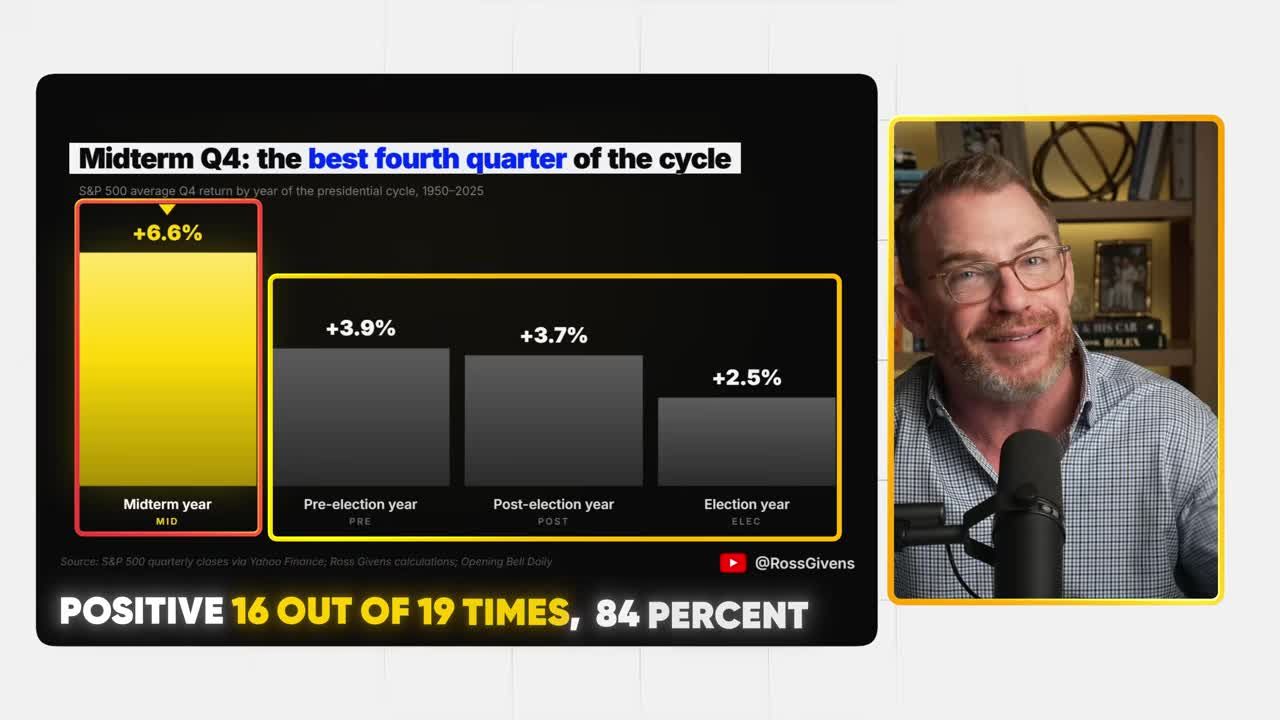
The reason comes back to that same uncertainty-to-clarity shift. Investors get nervous before the vote and relieved after it, and that relief shows up directly in the numbers.
Do Midterm-Year Market Lows Happen Before or After Election Day?
Midterm-year lows tend to arrive before the election, not after, and the rallies that follow are both large and consistent.
Measuring from the lowest close of each midterm year to the highest point over the following 12 months, the average rally comes out to about 35%. Every one of the 19 midterm years saw a gain of at least 15% from that low. The smallest bounce came in 1994, and the biggest came in 1954, when the market soared 48%.
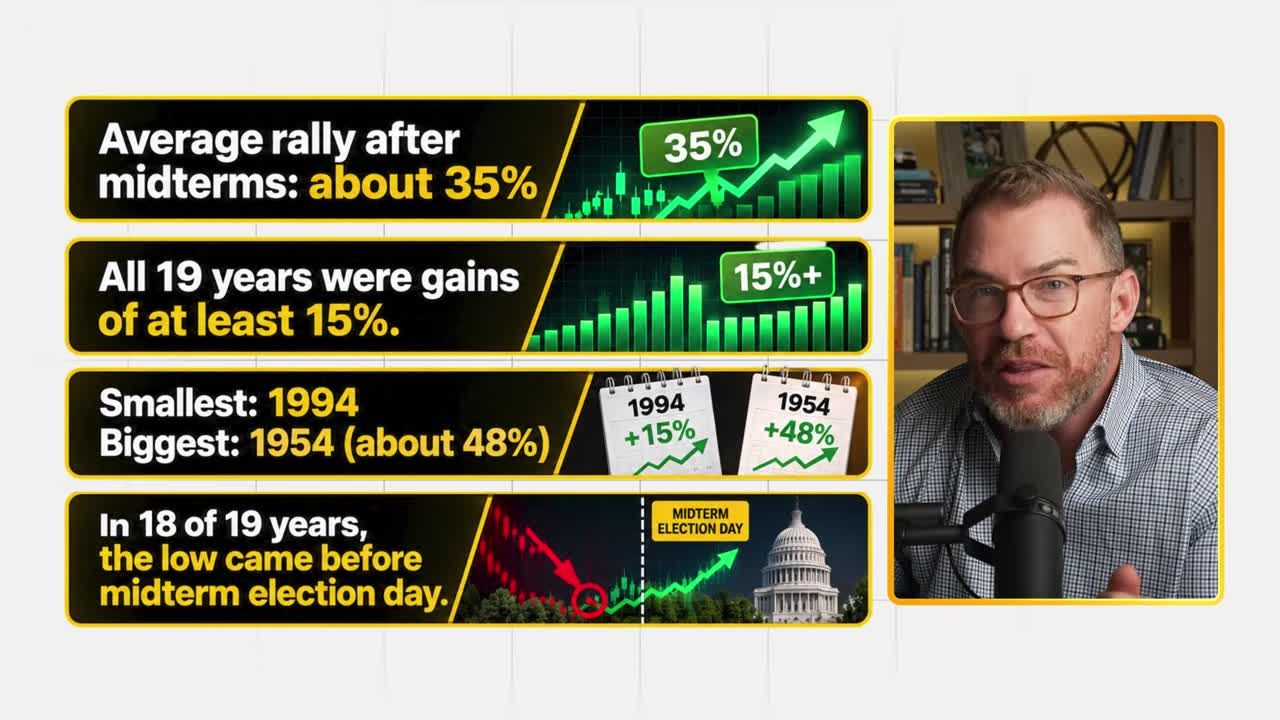
In 18 of those 19 years, the low came before midterm election day. By the time most people start paying attention to the election, the bottom has usually already been put in.
There's something almost ironic about that. The moment everyone feels the most nervous has historically been the best time to be buying, and it keeps repeating: 9/11, 2009, COVID, the rate hikes of 2022, the tariffs in March of 2025. Every time things looked their worst, that period tended to mark the low.
The Five-Day Sweet Spot
A firm called Season X studies market seasonality closely, and their research looked at the stretch from five trading days before a midterm election to two days after. Going back to 1934, the S&P rose in 22 of those 23 windows.
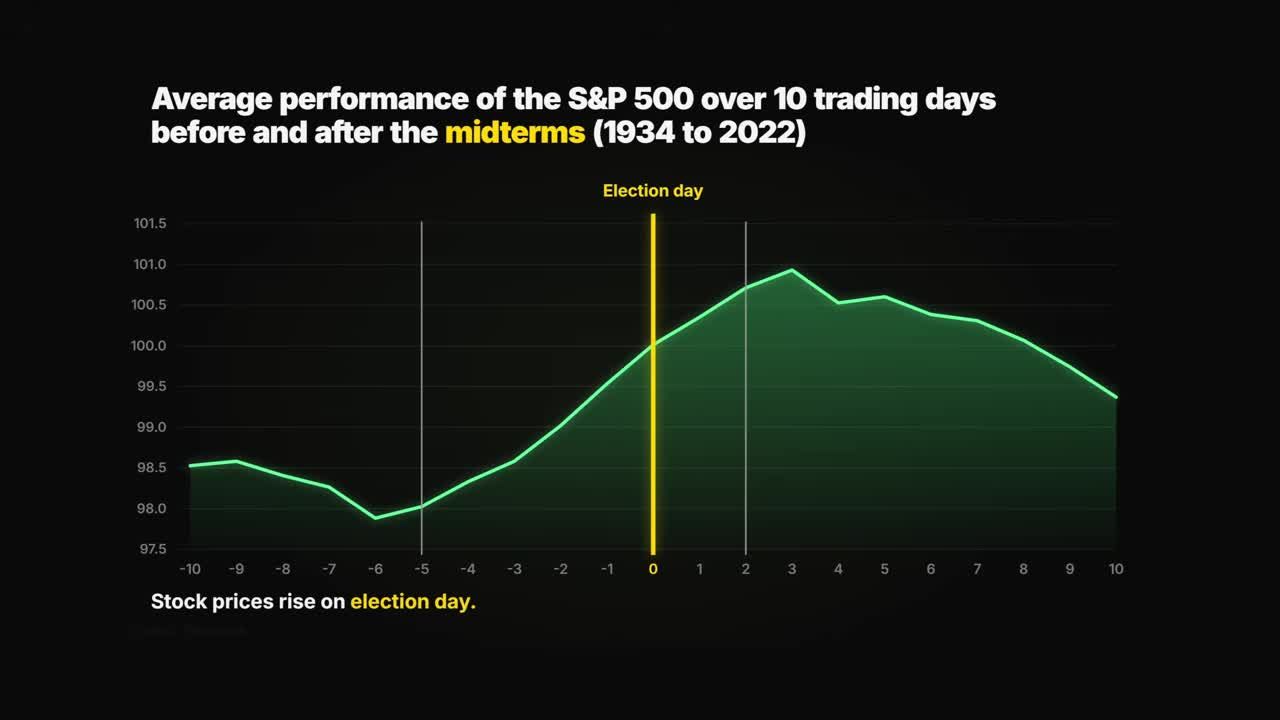
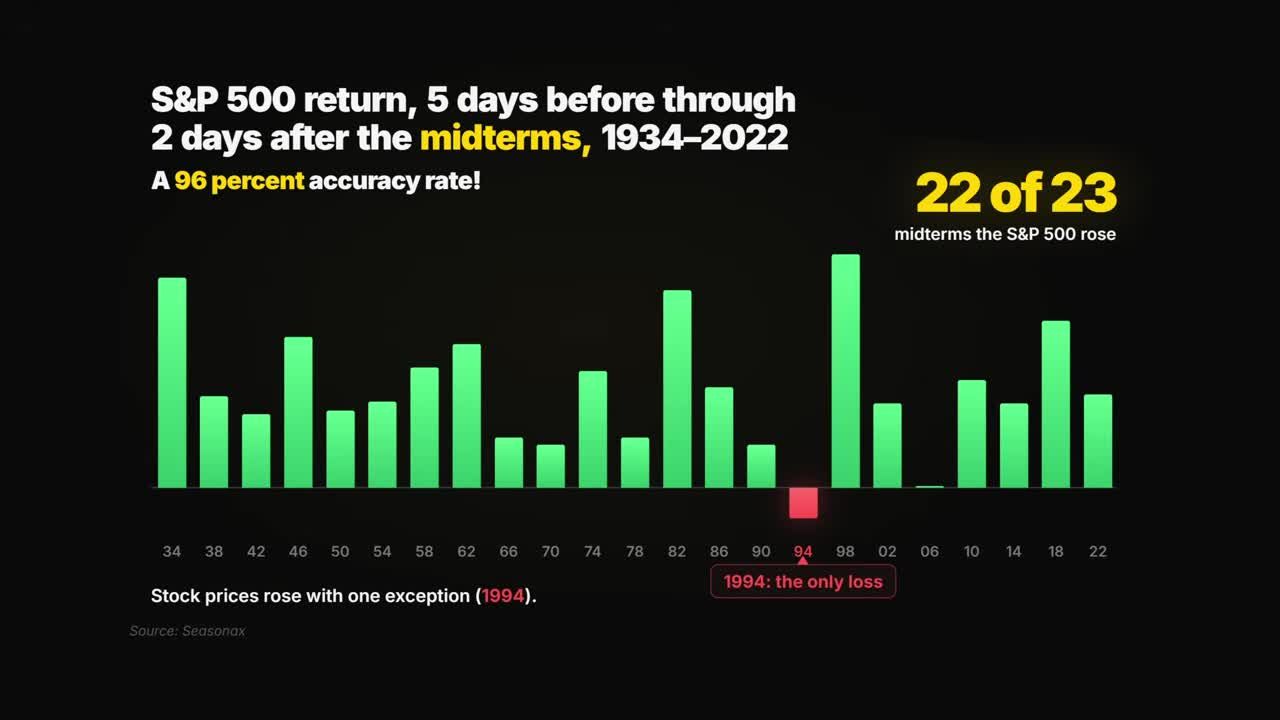
History says we're sitting right in that window heading into this election.
Get an entire year of live weekly mentoring sessions, my newsletter, indicators, bonus reports, tons more. Click the link and I'll see you in the next live session.
Join my Black Ops Trading ClubHealth Care's Seasonal Edge
Health care has historically been one of the stronger sectors during the back half of midterm years. Spending in that space tends to keep growing no matter which party wins, which makes it less sensitive to the political outcome than most other corners of the market.
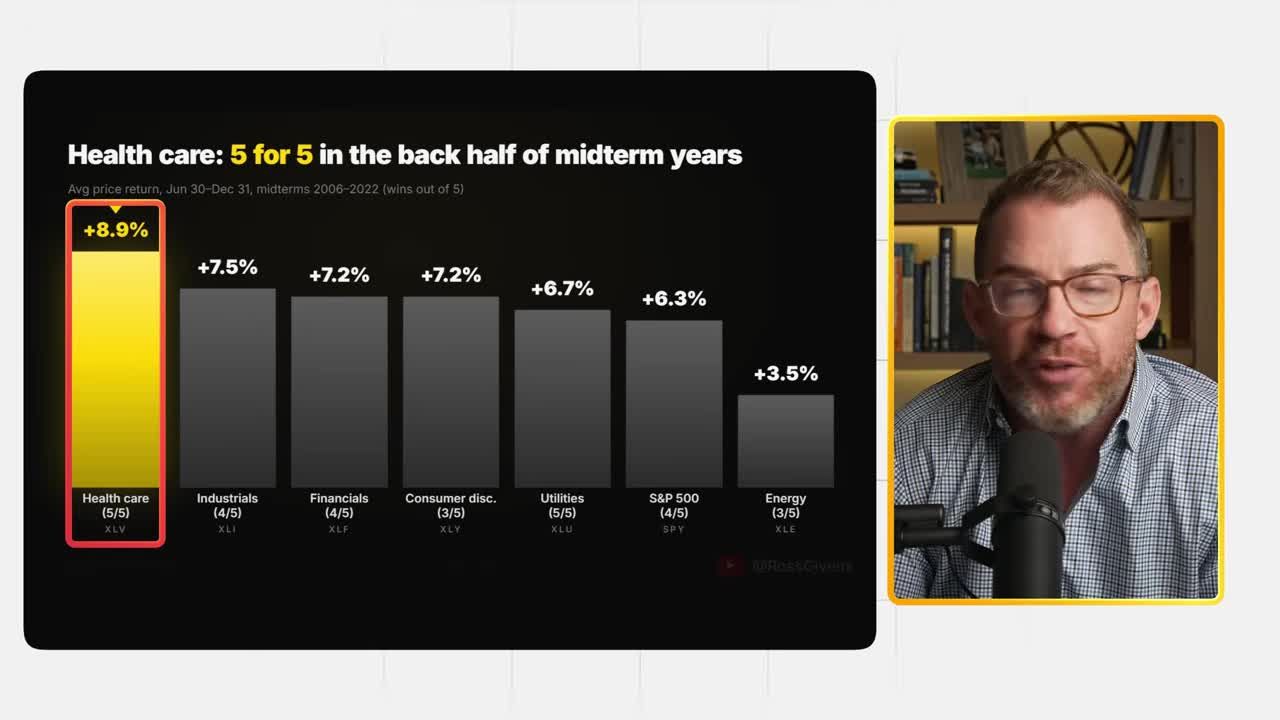
I flagged this on September 8th while preparing for the fourth quarter, pointing to Hinge Health (HNGE) as a name showing a breakout pattern inside that strong sector. Investors who got in around that time are now sitting on roughly a 24% gain in about seven weeks. That breakout is why the stock outran both the health care sector and the broader market.
This is also why I always push a top-down approach to trading:
- Confirm the market trend. A strong overall market puts the wind at your back.
- Find the leading sector. Look for a group that's either leading the market or sitting in a historically strong seasonal window, like health care in Q4.
- Buy breakouts, not guesses. Enter stocks as they break out of consolidation patterns within that leading sector.
Stack those three factors together and you massively tip the odds in your favor.
The Political Setup That Wins
Split Congress, not a sweep, has been the market's favorite outcome
A split Congress has historically produced the strongest returns of any political combination since 1950. When neither party controls everything, sweeping legislation becomes harder to pass, and Wall Street prefers that kind of gridlock.
I checked this directly from 1950 through 2025, and it holds up. When one party controls the House and the other controls the Senate, very little sweeping legislation gets passed, which is exactly what the market wants. Wall Street isn't rooting for a particular winner. It wants predictability, not sudden tariff shifts, war footing, or health care overhauls it never saw coming.
Unfortunately, the betting odds heading into this election favor a Democratic sweep. Polymarket was giving Democrats about a 92% chance of winning the House and roughly a 67% chance of taking the Senate.
That number can mislead, though. A large chunk of that weakness comes from just two brutal stretches: the oil shock years and the 2008 financial crisis. Those were black swan events that had nothing to do with political gridlock itself. Strip them out and the gap narrows considerably.
The bigger point stands regardless: the 12 months following a midterm have gone 19 for 19 in the plus column, a record that includes Republican sweeps, Democrat sweeps, and split outcomes alike. Wall Street doesn't need a specific party to win. It just needs the election to be over.
Why 2026 Looks Different
The setup heading into this midterm looks a little different than past cycles, because the betting markets are pricing in a near-sweep for one party rather than the split outcome that has historically produced the strongest returns. That doesn't break the long-term pattern for the stock market after midterms, but it does change which political combination investors should expect.
If Democrats do take both chambers alongside a Republican president, that's historically been the weakest combination in the data, averaging about 7% a year. Even the weakest combination in a 19-for-19 streak still landed in positive territory. The uncertainty resolving, regardless of who wins, has been the real driver behind the rally, not the specific outcome itself.
What Traders Should Take From This
- The S&P 500 has been higher 12 months after every midterm election since 1950, 19 for 19, averaging about 15%.
- The fourth quarter of midterm years is the strongest Q4 of the entire cycle, averaging 6.6% and positive 86% of the time.
- In 18 of 19 midterm years, the yearly low came before election day, meaning the bottom is usually already in by the time most people start paying attention.
- Split Congress has historically produced the best market returns of any political combination since 1950.
- Betting markets currently favor a Democratic sweep, the historically weakest combination, though still part of a 19-for-19 positive streak.
The Bottom Line
The data on the stock market after midterms is about as consistent as market history gets. Nineteen elections, nineteen positive 12-month returns, through wars, recessions, inflation spikes, and oil shocks. The driver isn't which party wins. It's the simple fact that uncertainty gets resolved, and money that was sitting on the sidelines comes back into the market.
The fourth quarter we're in right now has historically been the strongest quarter of the entire four-year presidential cycle, and midterm-year lows tend to form before election day rather than after. The moment of maximum nervousness has repeatedly turned out to be the best entry point, not the worst.
Whatever happens on November 3rd, the history says the same thing it always has: Wall Street doesn't need a winner. It just needs an answer.
Get an entire year of live weekly mentoring sessions, my newsletter, indicators, bonus reports, tons more. Click the link and I'll see you in the next live session.
DISCLAIMER: Traders Agency does not offer financial advice. The information provided is for educational purposes only and should not be considered financial advice. Traders Agency is not responsible for any financial losses or consequences resulting from the use of the information provided. Trading carries inherent risks and may not be suitable for all individuals. You are advised to conduct your own research and seek personalized advice before making any investment decisions, recognizing the potential risks and rewards involved.
See more from Traders Agency on Google
Make us a preferred source and our market analysis will appear more prominently in your Google Search, Top Stories, and AI results.
Add to Preferred Sources