
A roaring kitty stock analysis is the research process Keith Gill used to build his GameStop thesis: a fundamentals-based breakdown of a company's cash, debt, short interest, and upcoming trigger events rather than a hype-driven guess. He posted this research on Reddit well before GameStop became a headline stock. In this guide, we'll show you how to build that same kind of research process for any stock you're considering.
You've probably seen the headlines: a guy in a cat t-shirt turns a modest starting stake into millions, Wall Street loses its mind, and the internet decides it's all one big joke. But the part that gets skipped is that Keith Gill's GME thesis started as a slow, boring, spreadsheet-heavy research project. That's actually the most useful part of the story for traders who want a repeatable process.
In this guide, we'll walk through what the original research actually contained, how it differs from meme-driven trading, and how you can build your own deep-dive process on a stock of your choosing. We'll also cover the risks, because volatility like what happened with GameStop is not something beginners should try to replicate on purpose.
What Was Roaring Kitty's Actual GME Thesis?
Bottom Line: A roaring kitty stock analysis works because it relies on verifiable fundamentals, cash position, debt, short interest, and a dated trigger event, not hype or momentum. Traders who want to replicate the approach should build a similar research checklist while keeping position sizes small, since volatility and timing remain unpredictable even when the underlying thesis is sound.
Before GameStop became a social media event, it was a value investing idea. The early posts focused on the company's balance sheet, its cash position, and a belief that the market was mispricing the business relative to its real assets.
The thesis had three core legs:
- Cash on hand: GameStop was sitting on more cash relative to its market value than the stock price seemed to reflect.
- Short interest: A very large percentage of available shares were being bet against, which created a setup where a price increase could force short sellers to buy back shares.
- Trigger event timing: A new console generation cycle was approaching, which historically boosted GameStop's sales.
This is a fundamentals-based framework, not a momentum bet. We teach roaring kitty stock analysis in its original sense as reading 10-K filings and balance sheets, not chasing a trending ticker.
How Do Fundamental Deep Dives Differ From Meme Trading?
A fundamental deep dive means researching a company's actual financial health before you ever look at its chart. Meme trading, by contrast, is buying because a stock is trending online, regardless of what the underlying business looks like.
The difference matters because one process has a repeatable method and the other does not. Fundamental analysis asks: what is this business worth, and what evidence supports that? Meme-driven buying asks: is everyone else talking about this right now?
The original posts behind this thesis read more like a research memo than a hype thread: specific numbers, clear reasoning, and a thesis that got updated over time. That's the behavior we encourage traders to copy, separate from what the stock eventually did.
Breaking Down the Cash on Hand and Short Interest Numbers
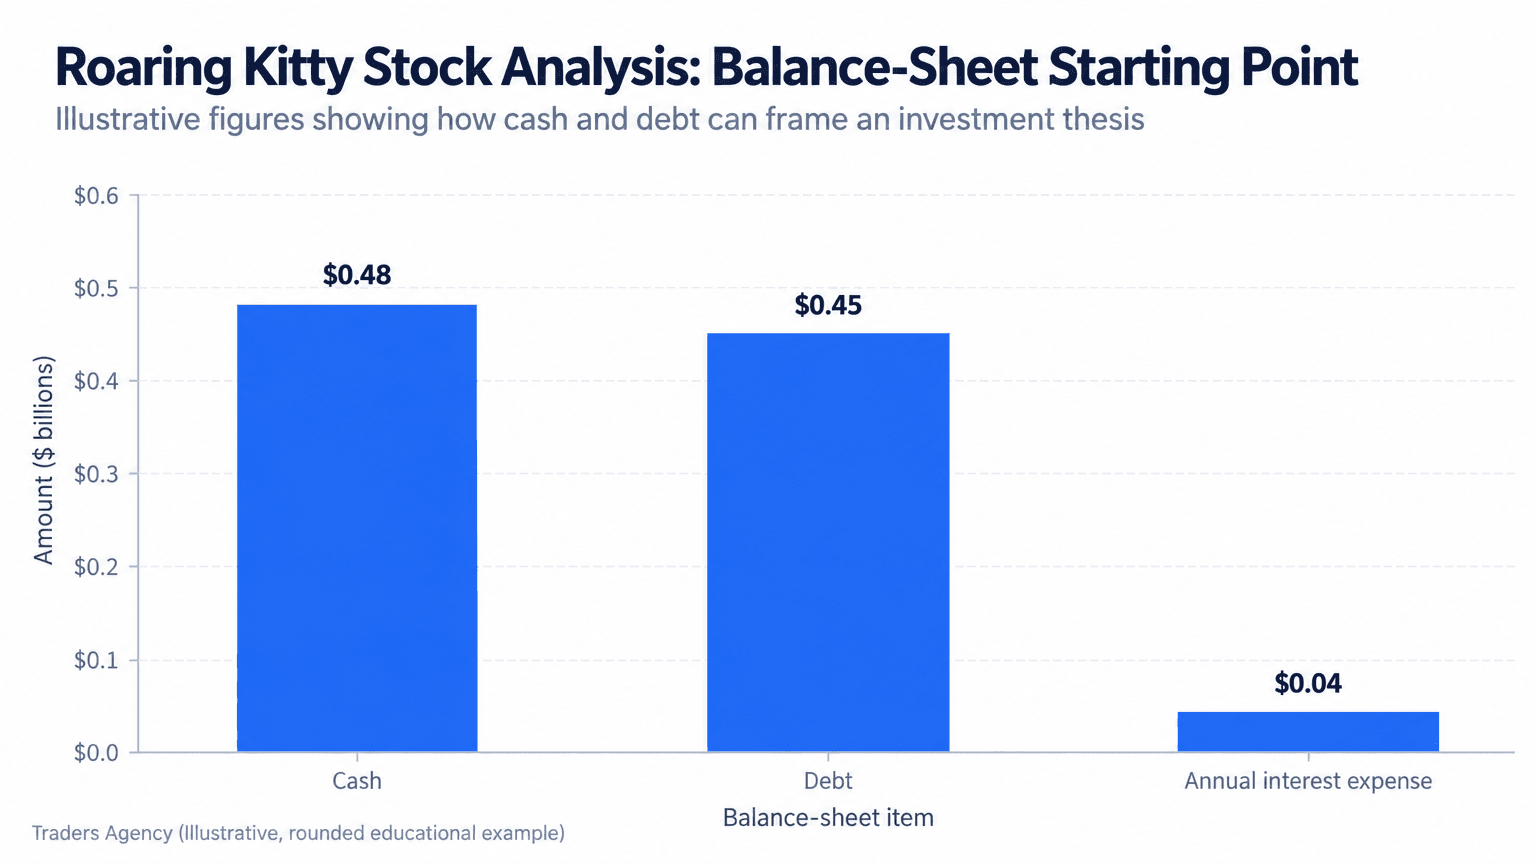
Specific numbers are what separate research from guessing. Here's a simplified, illustrative version of how we'd lay out a cash-and-debt comparison for a retailer trading below the value of its own assets.
In an illustrative deep-value setup, a retailer might hold roughly $500 million in cash, carry modest long-term debt, and have low annual interest expense relative to its cash pile. That combination can mean a company is financially sturdier than its falling stock price suggests, which is exactly the gap a fundamentals-based researcher is hunting for.
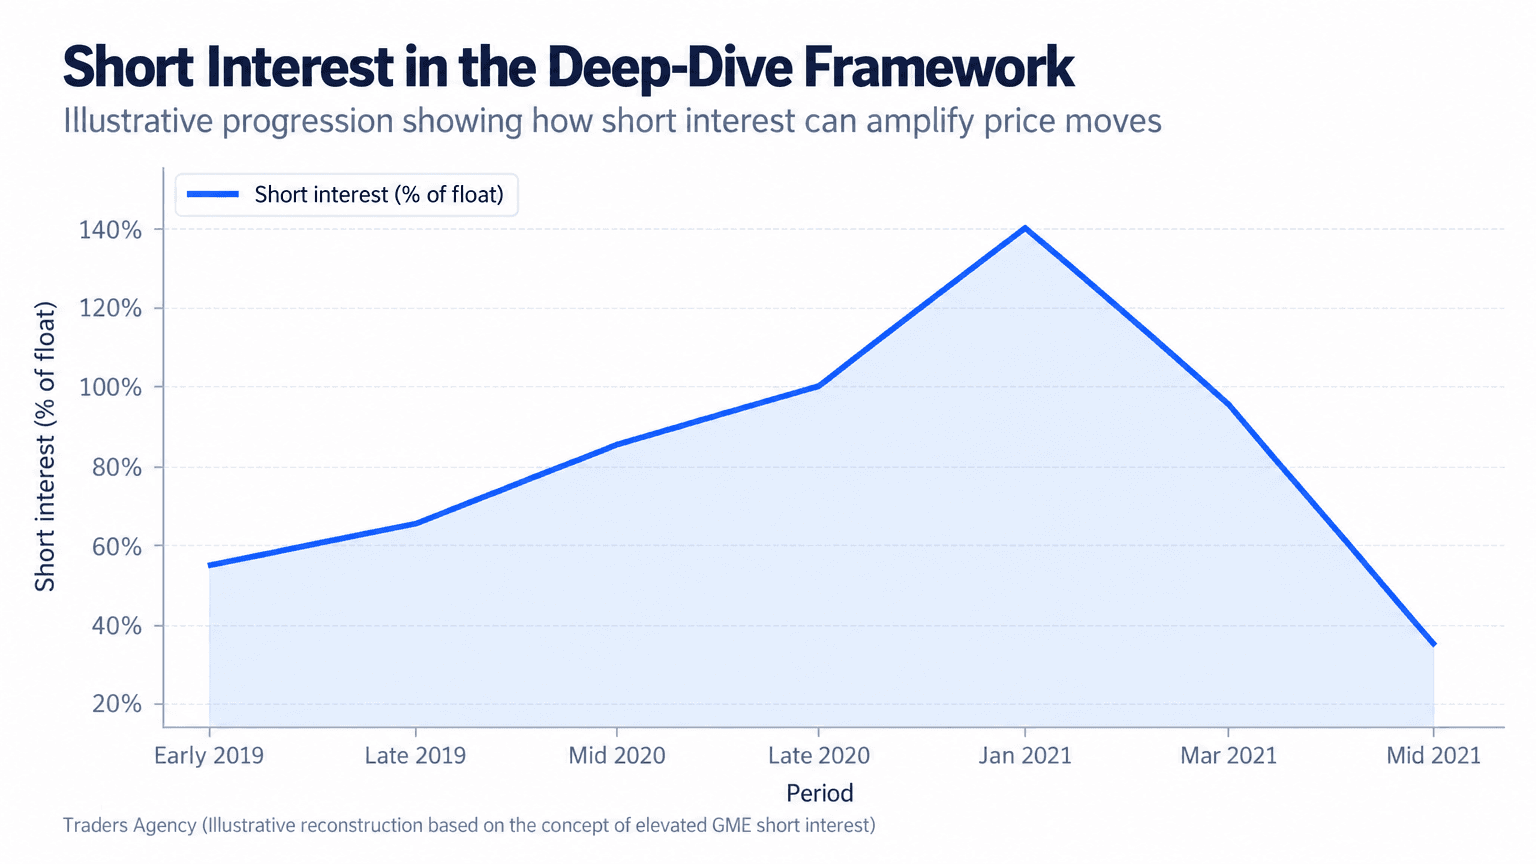
Short interest is the percentage of a company's available shares that have been sold short, meaning traders are betting the price will fall. When short interest climbs above roughly 20% of float, we consider that unusually high by common market convention.
Key Concept: Short interest above 20% of float signals a crowded short position. On its own, that's not a buy signal. It only matters when it's paired with a genuine fundamentals case.
In GameStop's case, reported short interest figures were far beyond that threshold at various points, which is part of why the setup drew so much attention. High short interest alone isn't a reason to buy a stock. It becomes meaningful only when paired with a genuine fundamentals case, which is exactly the combination this thesis laid out.
Want expert trading insights delivered daily?
Join thousands of traders who rely on Traders Agency for market analysis and trade ideas.
Join Traders AgencyWhy Did Social Media Amplify a Fundamentals-Based Trade?
Social media turned a quiet research thesis into a widely visible trade by giving thousands of retail traders a single place to see the same numbers at once. The Roaring Kitty Reddit posts gave the thesis reach that a private spreadsheet never could have achieved on its own.
Once enough people acted on the same idea simultaneously, buying pressure itself became part of the story. That's a separate force from the original fundamentals, and it's the part that created the extreme price swings everyone remembers.
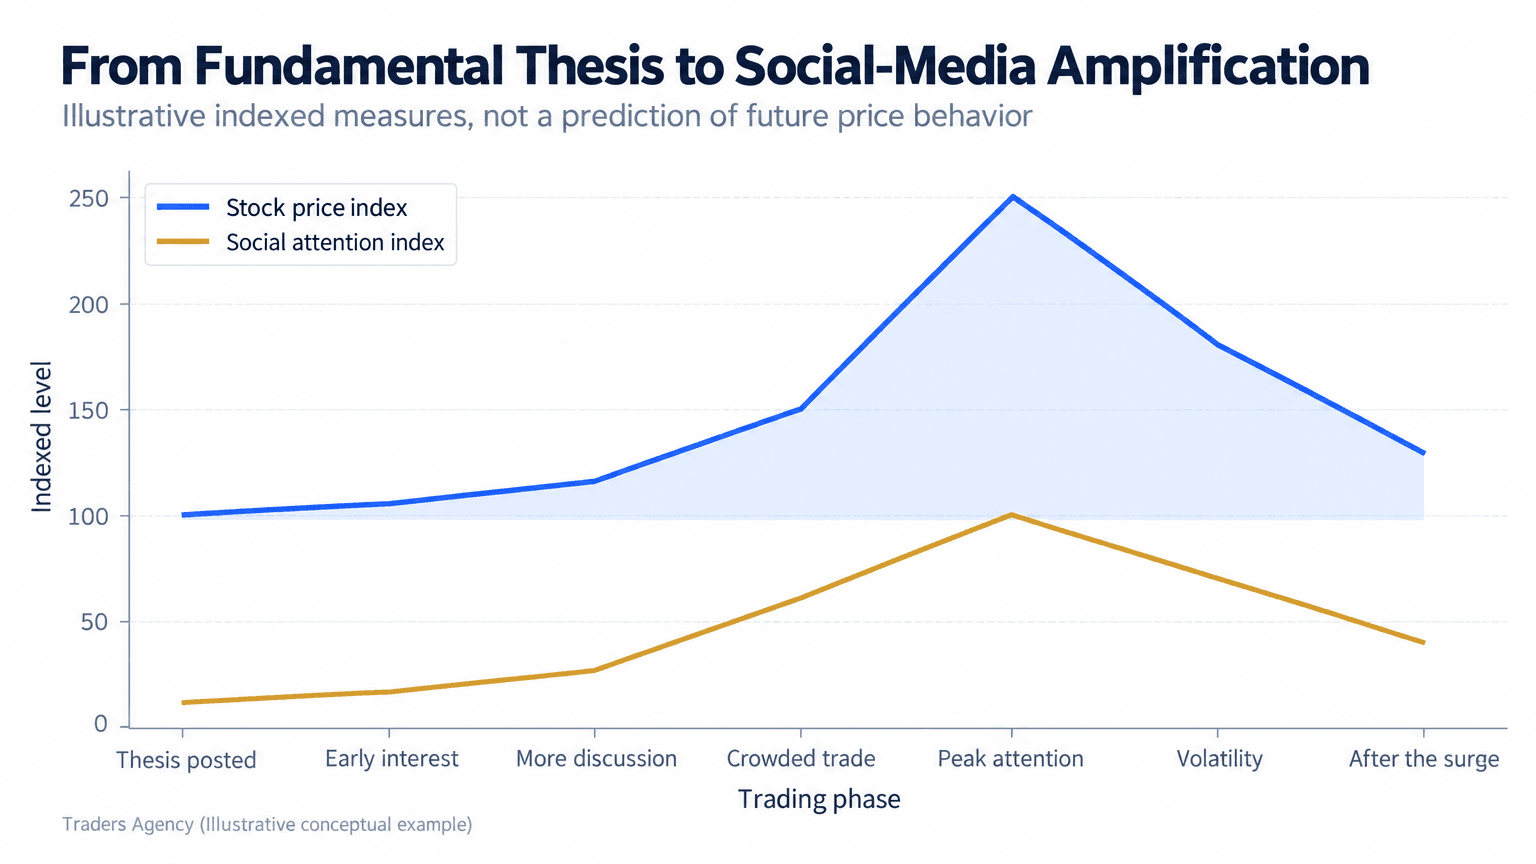
Key Concept: Attention and fundamentals are two different forces. Confusing them is how most traders get hurt chasing a trending ticker.
Did Roaring Kitty Make Any Money?
Yes. Publicly posted brokerage screenshots showed substantial paper gains during GameStop's run, though exact figures tied to Keith Gill's net worth have shifted over time as positions were bought, sold, and re-entered. Posted portfolio screenshots became a recurring moment of public interest each time he resurfaced.
Whether and when he sold has been debated after nearly every public update, since brokerage screenshots only show a snapshot in time, not full trade history. As for whether he's still invested in GameStop, posted positions at various points showed continued large GameStop holdings, though positions can change and any single screenshot shouldn't be treated as current investment advice. Today he's largely a private figure who posts infrequently, which is itself a reminder that chasing someone else's current position is not a repeatable strategy.
Lessons Retail Traders Can Take From This Research
The real takeaway isn't the outcome, it's the process. Here's what we think is worth borrowing:
- Read the actual filings: cash position, debt, and quarterly trends, not just headlines.
- Look for a trigger event: a specific, dated reason the market might re-rate the stock.
- Check short interest: understand if there's a crowded bet on the other side.
- Write your thesis down: forcing yourself to explain it in writing exposes weak logic.
- Separate conviction from position size: a good thesis doesn't mean an all-in bet.
A disciplined roaring kitty stock analysis approach treats research as a repeatable habit, not a one-time lottery ticket.
When Should You Stay Away From Hype-Driven Stocks?
Stay away when a stock's price action is driven almost entirely by social media attention with no supporting balance sheet research behind it. If you can't explain why a company is undervalued using its own financial statements, you're speculating on crowd behavior, not investing.
Common mistakes we see:
- Buying because a ticker is trending without reading a single filing
- Treating extreme volatility as "normal" because of one famous example
- Ignoring position sizing because a story feels compelling
Watch Out: Meme-stock volatility can move a stock 20% or more in a single session, and that kind of swing can wipe out an undersized account fast. We recommend small position sizes and firm stop losses whenever a stock is being driven by social momentum rather than fundamentals alone.
How Do You Start Your Own Deep Dive Analysis?
Here's the process we walk traders through, step by step:
- Pull the financial statements. Start with the most recent 10-K and 10-Q filings, available free through SEC EDGAR, and note cash, debt, and revenue trends over the last several quarters.
- Check short interest and float. Compare current short interest to historical levels for that same stock, available through most broker platforms, to see if there's an unusual imbalance.
- Identify a real trigger event. Look for a dated, concrete event (earnings, product launch, industry cycle) rather than vague optimism.
- Size the position conservatively. Even a strong thesis should only occupy a small slice of a portfolio given how unpredictable short-term price action can be.
Want expert trading insights delivered daily?
Join thousands of traders who rely on Traders Agency for market analysis and trade ideas.
Join Traders AgencyDISCLAIMER: Traders Agency does not offer financial advice. The information provided is for educational purposes only and should not be considered financial advice. Traders Agency is not responsible for any financial losses or consequences resulting from the use of the information provided. Trading carries inherent risks and may not be suitable for all individuals. You are advised to conduct your own research and seek personalized advice before making any investment decisions, recognizing the potential risks and rewards involved.
See more from Traders Agency on Google
Make us a preferred source and our market analysis will appear more prominently in your Google Search, Top Stories, and AI results.
Add to Preferred Sources