Skip to content
Back to Blog
Author

Traders Agency Team

Editorial Team

The Traders Agency editorial team delivers daily market analysis, stock research, and trading education. Our team of analysts covers stocks, options, crypto, commodities, and macroeconomics to help traders make informed decisions.

1812 articles
A split-screen composition showing a trader's hands hovering over a glowing touchscreen interface displaying colorful visual flowchart nodes and decision trees, representing the no-code bot builder.
Deep Dive
Deep Dive

OptionAlpha Review

Option Alpha review: no-code bot builder, unlimited backtesting, and automated options trading for retail traders. See who it's built for and what it deliv

Jun 24, 2026Read article
A split scene showing turbulent, choppy ocean waves on one side transitioning into a calm, focused radar or sonar screen on the other, symbolizing the contrast between market noise and finding the signal. In the foreground, a confident trader stands at the helm of a ship, steady and composed amid the stormy seas. The color palette shifts from dark, stormy blues and grays on the chaotic side to sharp, luminous greens and golds on the signal side, conveying opportunity within volatility.
Traders Daily Direction

Why You Should Love Choppy Markets

There is a powerful trading edge that 99% of traders will never be able to achieve. And the kicker is – it has nothing to do with market knowledge.

Jun 23, 2026Read article
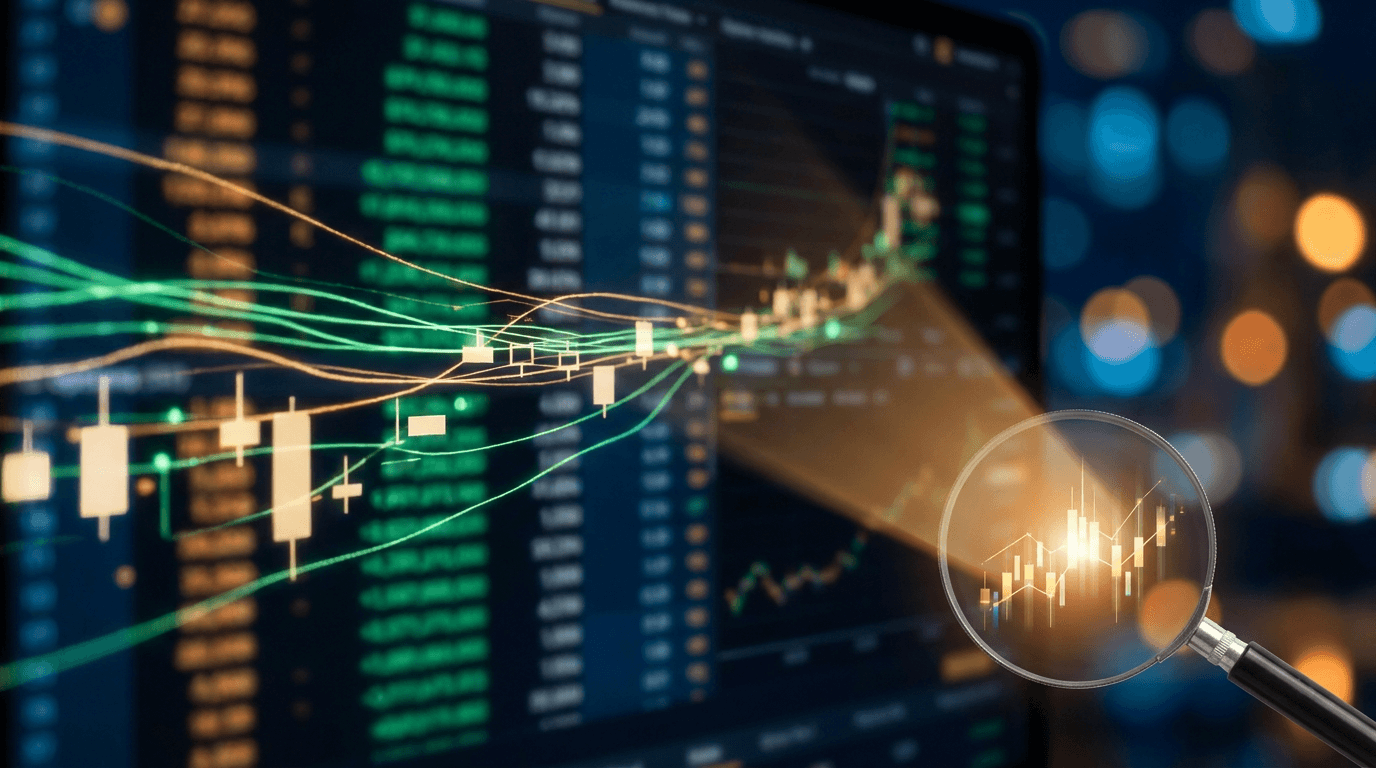
A sleek, multi-panel financial dashboard glows on a modern monitor, displaying colorful stock charts, valuation metrics, and global market data arranged in a clean, organized grid layout.
Deep Dive
Deep Dive

Koyfin Review

Koyfin review: a Bloomberg alternative built for retail traders. See who it's best for, what the data covers, and whether free or pro fits your needs.
Jun 23, 2026Read article
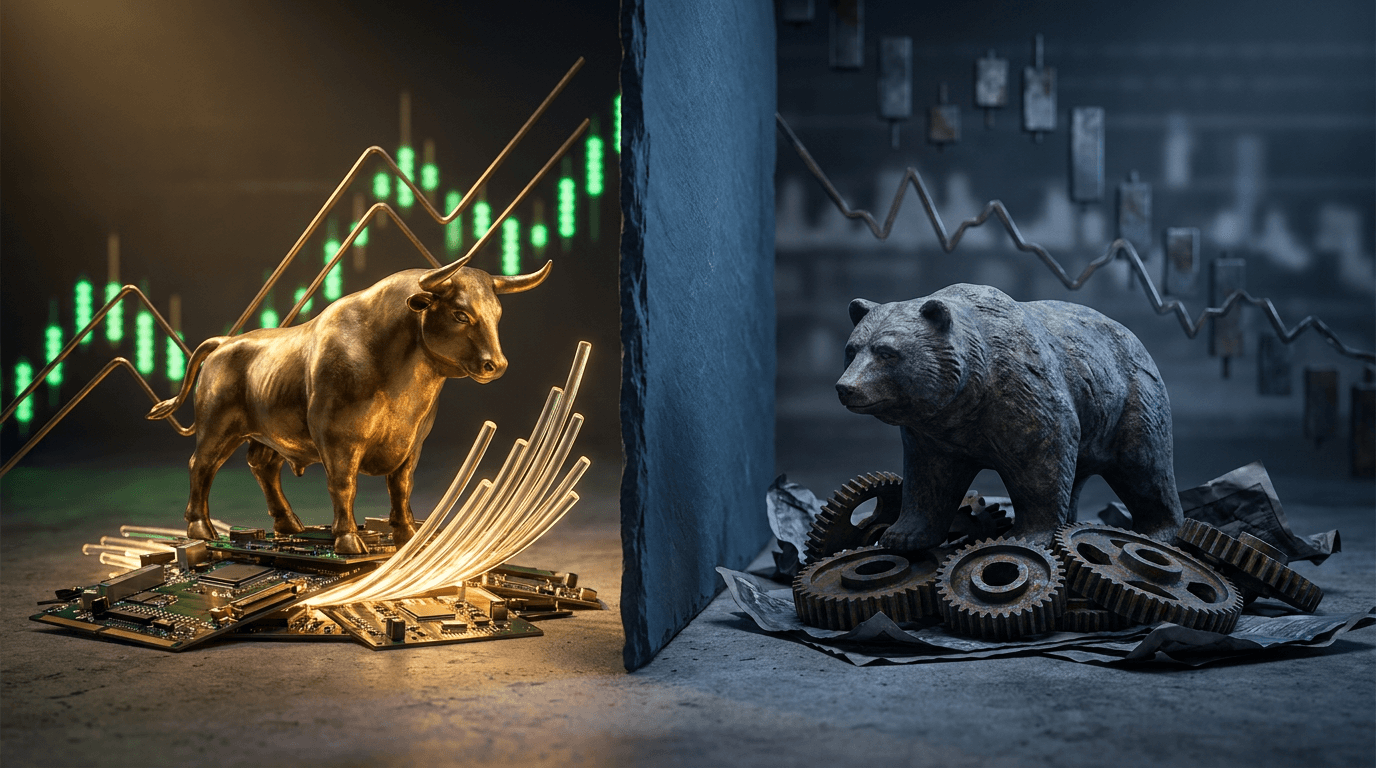
A split-screen or yin-yang style composition showing a bull and bear facing each other, symbolizing two opposing market forces coexisting in tension. One side glows with vibrant green upward-trending stock charts, while the other shows cooler, more muted tones with choppy or flattening lines. The contrast creates a dynamic visual balance that immediately conveys the idea of holding two competing market perspectives simultaneously.
Traders Daily Direction

The Market Can Be Two Things at Once

There is a powerful trading edge that 99% of traders will never be able to achieve. And the kicker is – it has nothing to do with market knowledge.
Jun 22, 2026Read article
A sleek, dark-themed trading terminal screen displays cascading streams of glowing green and amber options data, with bold highlighted rows representing large institutional sweeps cutting through the noise.
Deep Dive
Deep Dive

Cheddar Flow Review

Cheddar Flow review: real-time options flow and dark pool data built for retail traders. See what it delivers, who it suits, and how it compares to rivals.

Jun 22, 2026Read article
A trader sits at a clean, organized desk with a single monitor displaying a focused list of glowing stock tickers, with most of the screen's chaos deliberately blurred or faded into the background.
Educational
Educational

Setting Up a Watchlist That Works

Learn how to set up a watchlist that filters market noise and keeps your trading focused on high-probability setups before the opening bell.

Jun 18, 2026Read article
A split-scene composition showing a rising stock market graph with green upward-trending lines on one side, and an oil barrel or derrick fading into the background on the other, symbolizing the inverse relationship between the Iran deal and
Market News
Market News

Dow Jones Today: Iran Deal Lifts Stocks 0.7%

Dow Jones today climbs 0.7% as the U.S.-Iran peace deal reshapes oil markets. Why stocks are rising and what traders should watch before Monday's open.

Jun 18, 2026Read article
A dramatic aerial view of a massive chess board where giant golden chess pieces (representing institutional players) tower over a single small pawn in the center, illuminated by a stark spotlight. The contrast in scale creates an immediate visual tension, with the lone pawn casting a long shadow that hints at hidden potential despite being surrounded. Dark, moody lighting with gold and shadow tones reinforces the theme of power imbalance in financial markets.
Traders Daily Direction

No Love for the “Little Guy” in the Markets

There is a powerful trading edge that 99% of traders will never be able to achieve. And the kicker is – it has nothing to do with market knowledge.

Jun 18, 2026Read article
A dynamic split-scene composition showing a bold upward-trending stock chart arrow breaking through the center, with the Dow Jones ticker board glowing green on one side and an Intel microchip illuminated in sharp blue light on the other.
Market News
Market News

Dow Jones Today: Jobs Data Lifts Dow, Intel Jumps

Dow Jones today surges as jobless claims beat expectations and traders shrug off the Fed rate decision. Intel shares spike on Trump comments — here's what

Jun 18, 2026Read article
A split-screen visualization showing two contrasting financial graphs side by side — one displaying a steeply climbing revenue growth curve in bold blue, and the other showing a shrinking profit margin line in red, illustrating the tension
Educational
Educational

Revenue Growth vs Profit Margins: What Matters More

Revenue growth vs profit margins — learn which metric actually drives stock value and how to read earnings reports before the market moves against you.
Jun 18, 2026Read article
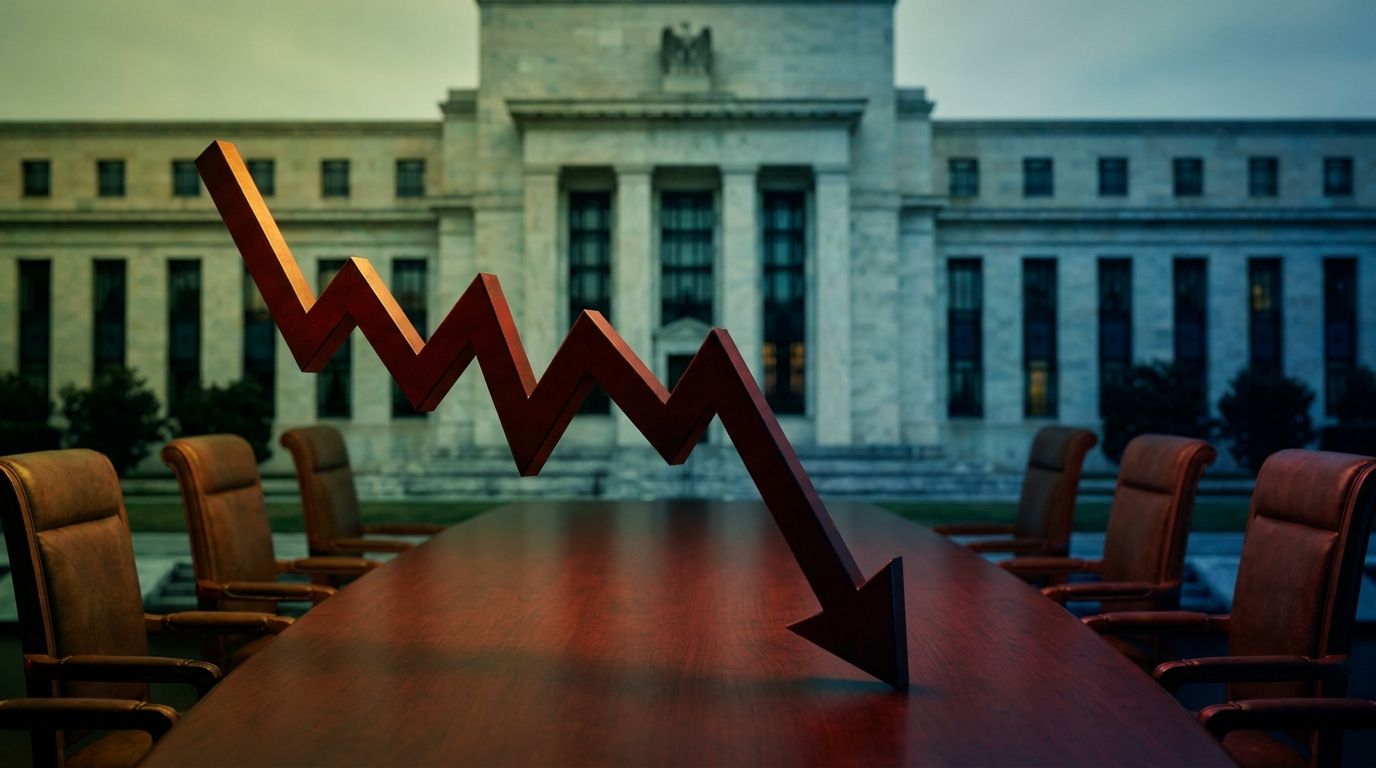
A dramatic downward-plunging stock market graph rendered in deep red dominates the frame, with the Federal Reserve building's neoclassical columns visible and slightly blurred in the background.
Market News
Market News

Fed Guidance Shift Sparks 1.2% S&P 500 Selloff

Fed forward guidance shift under Kevin Warsh rattled markets. A hawkish dot plot sent S&P 500 down 1.2% and 10-year Treasury yields near 4.5% — here's what

Jun 18, 2026Read article
A stylized stock chart displayed on a dark background shows three distinct price peaks forming the classic silhouette of a human head flanked by two shoulders, with a clean horizontal neckline cutting across the base of the formation.
Educational
Educational

Head and Shoulders Pattern

The head and shoulders pattern signals major trend reversals before they happen. Learn to confirm with volume, set price targets, and manage risk precisely

Jun 17, 2026Read article
Join the Edge

Stop watching.
Start winning.

50,000+ traders get our daily brief before the market opens.

Free. No spam. Unsubscribe anytime.

Traders AgencyWhat Customers Say
4.8
1,544
