U.S. stocks are climbing on Thursday as Wall Street processes two major forces at once: the signing of the interim U.S.-Iran peace deal and the Federal Reserve's hawkish rate stance. The tech-heavy Nasdaq Composite is surging 1.5%, the S&P 500 is up 1%, and the Dow Jones Industrial Average has gained 0.7%. Our team is tracking a significant shift in energy pricing and equity rotation that traders need to understand before the long weekend.
What's Driving the Dow Jones Today?
The Dow Jones Industrial Average gained 0.7% today, reaching 52,063.00, as investors digested the newly signed U.S.-Iran peace agreement and mixed labor market data. President Trump and his Iranian counterpart signed the memo on Wednesday outlining their countries' peace agreement, a move previously expected for Friday.
The deal went into effect on Thursday, potentially speeding up the timeline for reopening the Strait of Hormuz to commercial traffic and lifting sanctions on Iranian oil. The Dow Jones is up 119.00 points, representing a +0.23% move as of 12:12 PM EDT. The index is bouncing back from sharp closing losses, making this recovery particularly significant for retail traders watching for follow-through.
Key Move: The primary driver of today's positive price action is Middle East de-escalation. The agreement potentially speeds up the timeline for reopening the Strait of Hormuz to commercial traffic and lifts sanctions on Iranian oil, repricing energy assets.
How Will the Iran Peace Deal Affect Oil and Stocks?
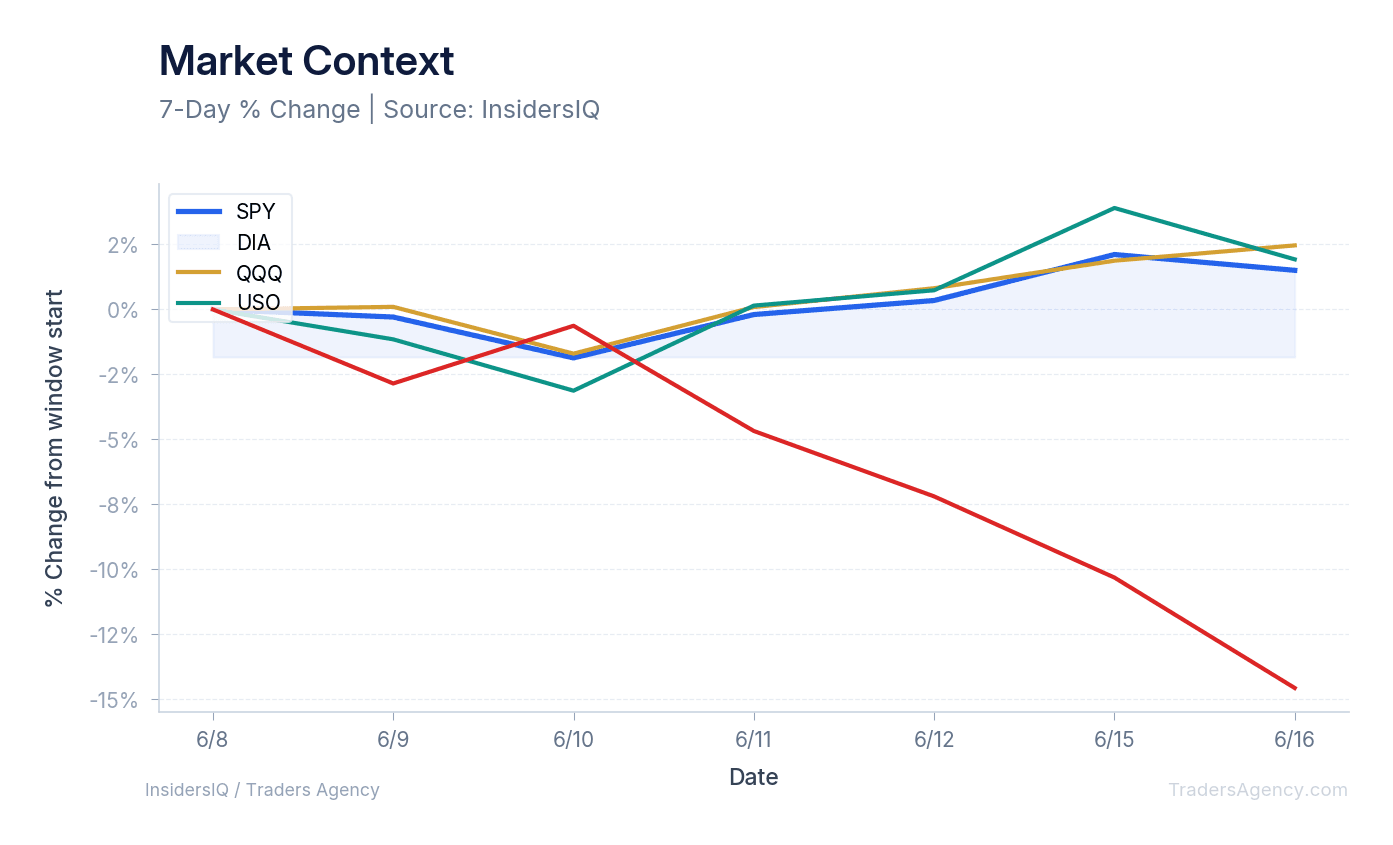
The peace agreement directly impacts energy markets by potentially reopening the Strait of Hormuz and removing sanctions on Iranian oil. This expected influx of supply has pushed oil prices sharply lower. The USO fund has dropped 14.56% over the last 10 days.
Brent crude futures sank as much as 3% following the news, chipping away at most of the war-time gains. But oil prices pared losses somewhat during the first crossings of the strait, leaving Brent at around $78 a barrel. West Texas Intermediate is currently trading just above $74.
The broader market is reacting positively to this drop in energy costs. The SPY ETF has recorded a 1.50% gain over the past 10 days. The Dow Jones Industrial Average has gained more than the S&P 500 in this window, with the DIA ETF up 2.46%.
What Do the Fed's Hawkish Signals Mean for Traders?
More Fed officials signaled that a hike is on the table for later this year, after standing pat on policy in their decision on Wednesday. The central bank's hawkish tilt comes as inflation has remained elevated and the job market steady during the conflict with Iran.
Data from the Labor Department on Thursday showed initial jobless claims were slightly hotter than estimates but cooled over the week prior, presenting a mixed picture of the labor market.
Despite the threat of higher interest rates, the tech sector is absorbing the outlook well. The QQQ ETF, which tracks the Nasdaq 100, is up 1.93% over the last 10 days. Tech stocks are pacing the broader market gains, showing that investors are willing to buy growth assets even with a hawkish Federal Reserve.
Want expert trading insights delivered daily?
Join thousands of traders who rely on Traders Agency for market analysis and trade ideas.
Join Traders AgencyWhat Does Retail Sentiment Say About Today's Market Structure?
While institutional investors control the vast majority of equities, retail traders remain a powerful force in tracking market momentum. Our data shows a Fear and Greed index reading of 68, indicating strong bullishness, alongside 2,748 mentions on WallStreetBets with a sentiment score of 0.03.
Sentiment Check: A Fear and Greed reading of 68 tells us market participants are aggressively buying the dip following recent sharp losses. The Nasdaq Composite surging 1.5% shows clear institutional accumulation in tech stocks, and retail sentiment data confirms the bullish momentum.
Large funds dictate the primary trends, but retail participants must trade the tape in front of them. The sentiment indicators we track provide a real-time window into market momentum, and right now that window shows conviction on the buy side.
What Key Dates and Data Points Should Traders Watch Next?
The next two months will bring significant developments for traders to process. We're watching several specific events that will dictate the next major market moves.
- The 60-Day Nuclear Window: Negotiations on more protracted issues, including Tehran's nuclear program, are expected to take place over the next 60 days. This introduces a specific timeline for potential geopolitical headlines that could move markets in either direction.
- Strait of Hormuz Traffic: The first crossings of the strait have already begun. We're watching to see if sustained traffic keeps West Texas Intermediate prices suppressed near the $74 level.
- Holiday Schedule: Thursday marks the final trading session of the week. Wall Street stock markets will be closed on Friday to observe the Juneteenth holiday.
Traders must position themselves accordingly before the long weekend. The combination of a closed market on Friday and the newly active peace deal means Monday could bring significant gap-ups or gap-downs depending on weekend news flow.
The Bottom Line for the Dow Jones Today
Our analysis shows a market successfully digesting both geopolitical relief and hawkish monetary policy at the same time. The Dow Jones today reflects a clear rotation into equities as oil prices deflate and the USO fund drops. We're watching the $74 level on WTI crude closely and monitoring tech sector strength as the 60-day Iran negotiation window officially opens.
What We're Watching: WTI crude at $74, QQQ momentum for tech leadership confirmation, and any weekend headlines from the Iran nuclear negotiation timeline. Monday's open could be volatile.
Want expert trading insights delivered daily?
Join thousands of traders who rely on Traders Agency for market analysis and trade ideas.
Join Traders AgencyKey Takeaways
- The Dow Jones gained 0.7% to reach 52,063.00, with the S&P 500 up 1% and Nasdaq surging 1.5% on Thursday following the U.S.-Iran peace deal signing.
- The agreement was signed Wednesday, a day ahead of the expected Friday timeline, accelerating the potential reopening of the Strait of Hormuz and lifting of Iranian oil sanctions.
- Energy assets are repricing downward as a direct result of the deal, with traders watching WTI crude at the $74 level and the USO fund dropping on the session.
- The Fed's hawkish rate stance is running simultaneously with geopolitical relief, yet markets are absorbing both without reversing, which signals broad risk-on appetite.
- Monday's open carries elevated volatility risk as the 60-day Iran nuclear negotiation window officially begins and weekend headlines could shift sentiment quickly.
DISCLAIMER: Traders Agency does not offer financial advice. The information provided is for educational purposes only and should not be considered financial advice. Traders Agency is not responsible for any financial losses or consequences resulting from the use of the information provided. Trading carries inherent risks and may not be suitable for all individuals. You are advised to conduct your own research and seek personalized advice before making any investment decisions, recognizing the potential risks and rewards involved.
See more from Traders Agency on Google
Make us a preferred source and our market analysis will appear more prominently in your Google Search, Top Stories, and AI results.
Add to Preferred Sources