Traders Agency Team
Editorial Team
The Traders Agency editorial team delivers daily market analysis, stock research, and trading education. Our team of analysts covers stocks, options, crypto, commodities, and macroeconomics to help traders make informed decisions.

Finviz Review
Finviz review verdict: a powerful stock screener for retail traders. See who benefits most, what Elite adds, and whether the upgrade is worth the price.
LEAPS Options for Long-Term Investors
A LEAPS options strategy lets long-term investors control 100 shares with far less capital. Learn deep ITM strikes, risk management, and when LEAPS beat bu
Nasdaq 100 Futures Rise Ahead of Fed Decision
Nasdaq 100 futures contracts climb 0.56% as traders brace for the first Fed rate decision under Chairman Kevin Warsh. SpaceX surge adds fuel to tech premar
The True Cost of Trading Success
There is a powerful trading edge that 99% of traders will never be able to achieve. And the kicker is – it has nothing to do with market knowledge.

How to Spot a Pump and Dump Before It Dumps
Learn to identify a pump and dump scheme before the collapse. Spot the warning signs in volume, charts, and social media hype that signal manipulation.
Fed Rate Decision: Dow Hits Record, Nasdaq Drops
Fed meeting rate decision looms as Dow surges to 52,173 under new Chair Kevin Warsh. Why is the stock market mixed today — and where is capital flowing?

Dow Jones Today: Fed Meeting Stalls Rally
Dow Jones today hits 52,008 as Kevin Warsh's first Fed meeting begins. S&P 500 and Nasdaq stall while Strait of Hormuz delays cloud the outlook.

Trade Ideas Review
Trade Ideas review: a real-time stock scanner with Holly AI built for active day traders. See who it suits, what it costs, and whether Premium is worth it.
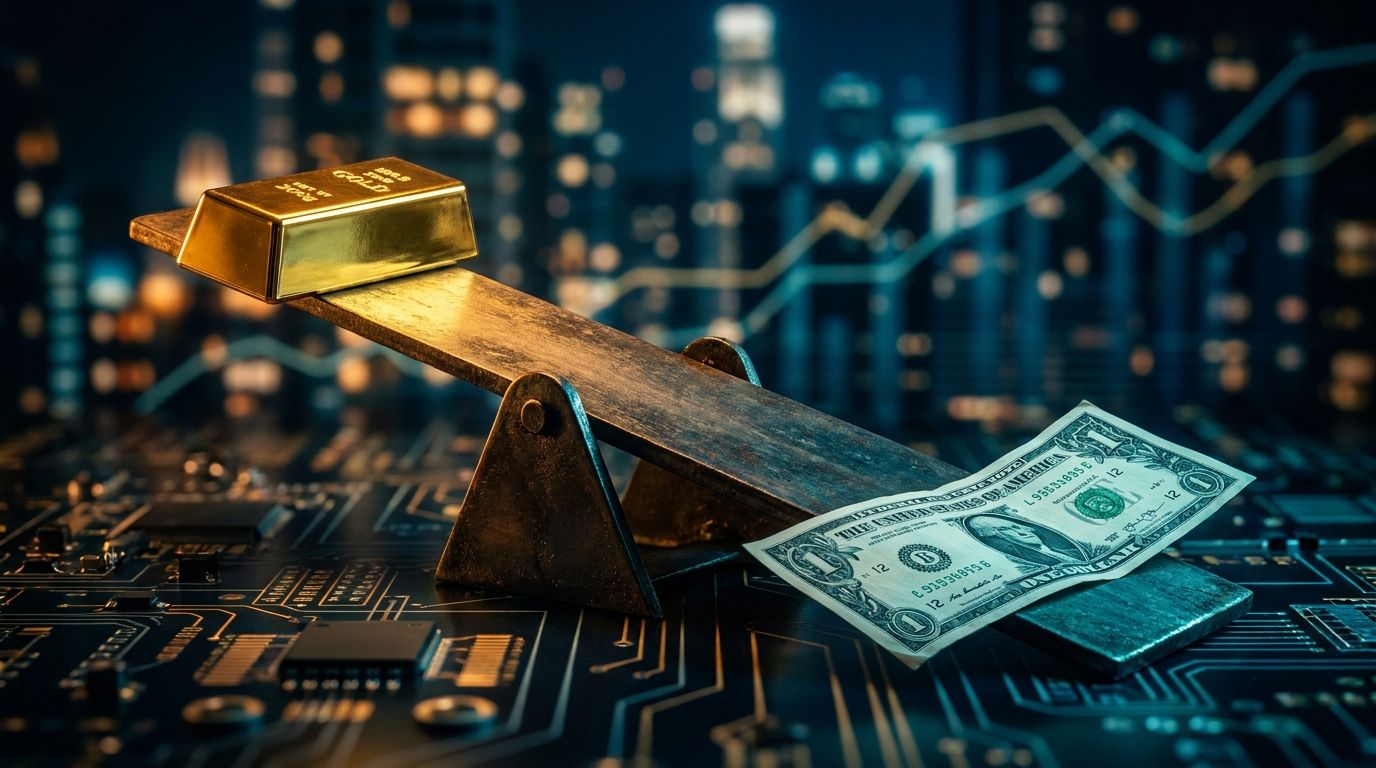
Understanding the Gold-Dollar Relationship
The gold-dollar relationship drives precious metals prices daily. Learn why gold and USD move inversely, when it breaks down, and how to trade GLD with def

Kevin Warsh Fed Chair Era Begins: Markets Wait
Kevin Warsh's first Fed meeting as chair kicks off with markets on pause. Will the dot plot signal rate hikes? What traders need to watch before Wednesday.

Stock Market Today: Tech +3.8%, Oil Craters
Stock market today: Nasdaq surged 3.07% as SpaceX mania and Iran deal crushed oil prices 4.1%. VIX drops to 16 — what traders watch next.
Reading Level 2 Market Data
Level 2 market data reveals the full order book behind every price move. Learn to spot bid ask stacking, market maker activity, and time trades with precis
Stop watching.
Start winning.
50,000+ traders get our daily brief before the market opens.
You're subscribed!
Check your inbox.
Free. No spam. Unsubscribe anytime.
