
Hey, Ross here:
AI stocks are in a bubble, and that bubble will burst. I’m not saying that to be dramatic. I’ve traced every major tech bubble back to the 1840s, and they all collapse in the exact same four steps. The AI stock bubble has already hit three of those four steps. The fourth one is the step that actually kills a bubble, and it hasn’t started yet, but I can show you exactly what to watch so you know the moment it does.
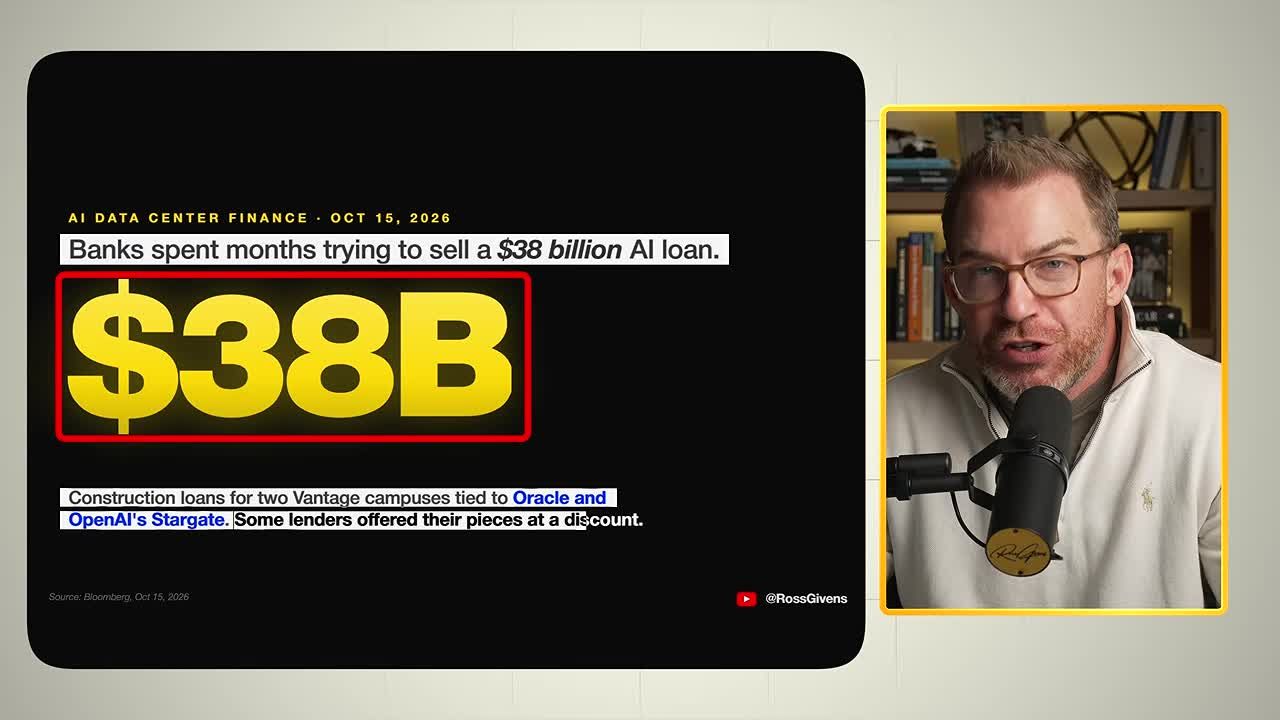
This matters right now because the warning signs are no longer theoretical. Last week, Bloomberg reported that some of the biggest banks in the world got stuck holding a $38 billion AI loan tied to data centers being built for Oracle and OpenAI. It took months to sell off pieces of that loan, and some lenders offered their slices at a discount just to get them off the books. When the people whose entire job is lending money don’t want to lend it, that’s not noise. That’s the first crack.
Is AI Turning Into a Bubble?
Yes, and the evidence is already stacking up. Every time a new technology arrives, the same sequence plays out: massive borrowed-money spending, a price collapse in the product being built, lenders pulling back, and then the weakest, most leveraged players breaking first.
That exact pattern happened with British railroads in the 1840s, American railroads in the 1890s, radio in 1929, the Nifty Fifty in the 1970s, and fiber optic cable in 2000. Different centuries, different technology, same four steps. The technology itself was always real. Trains, radio, the internet, all of it changed the world. The stocks still got destroyed along the way.
This is why an ai stock bubble isn’t a fringe idea. It’s pattern recognition. And right now, three of the four historical warning steps have already shown up in AI.
What Is an AI Bubble, and How Does AI Actually Make Money?
An AI bubble forms when the money poured into AI infrastructure runs far ahead of what that infrastructure can actually earn back, funded increasingly by debt instead of cash flow. Understanding how AI companies make money is the key to seeing why this gap exists.
When you subscribe to ChatGPT or Claude, you’re paying for access to an AI model, which is really just one enormous file of numbers, tuned during an expensive training process until it gets good at predicting the next word. Once that training is done, the file is frozen. It doesn’t learn anything new. Every single time you ask it a question, that file has to run on a rack of expensive chips, mostly NVIDIA chips, sitting in a building that eats power like a small city.
That’s the problem. Normal software gets written once and sold a million times for almost nothing. AI has to run constantly on expensive compute every single time it’s used.
Here’s where it gets tougher for AI companies. Epoch AI, a research group that tracks this, found the cost to reach the same level of AI performance has fallen roughly 13-fold a year since 2023. That’s great for customers. It’s brutal for the businesses selling it, because if your product gets 13 times cheaper every year, you have to sell 13 times more of it just to stand still.
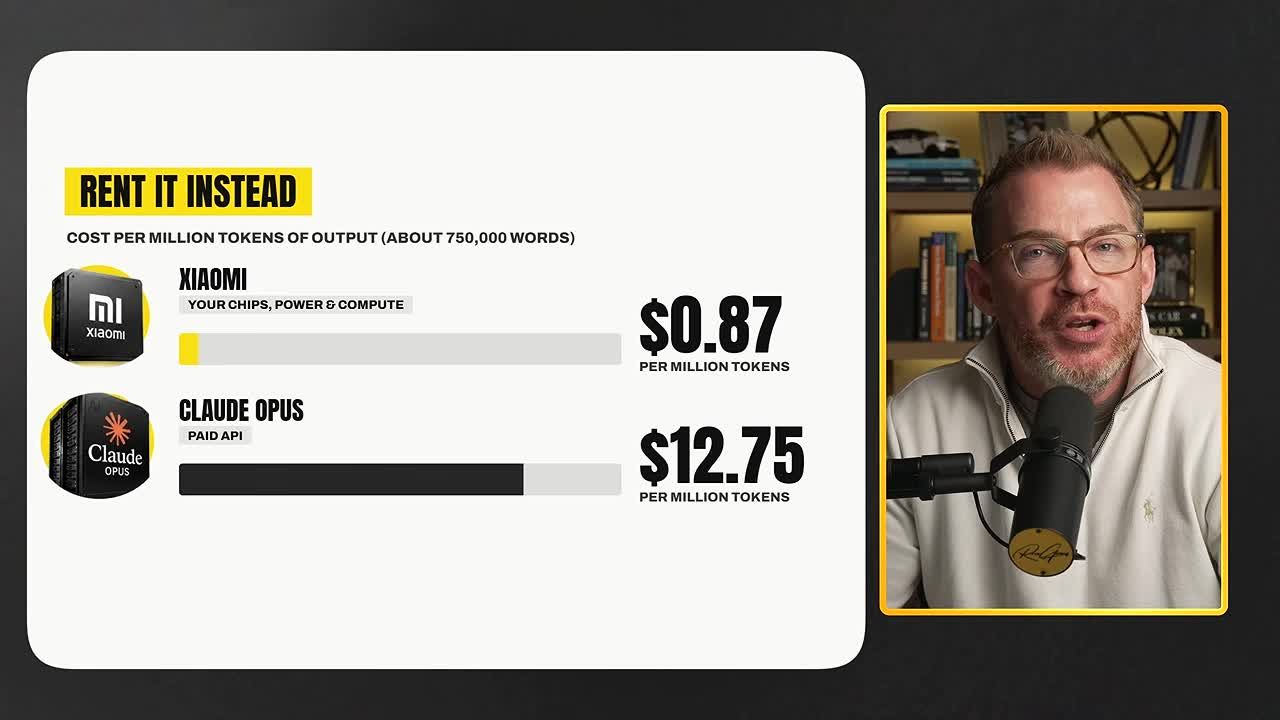
Free and open models are closing the gap fast, too. On the most watched AI scorecard, the top downloadable model, from Xeomi, scored a 46. The best paid model, Anthropic’s Claude Opus, scored 58. That means the free option is already about 80% of the way to matching the best paid model. Rent them instead, and the price gap is staggering: Xeomi’s model costs 87 cents per million words of output, Claude Opus charges $20.
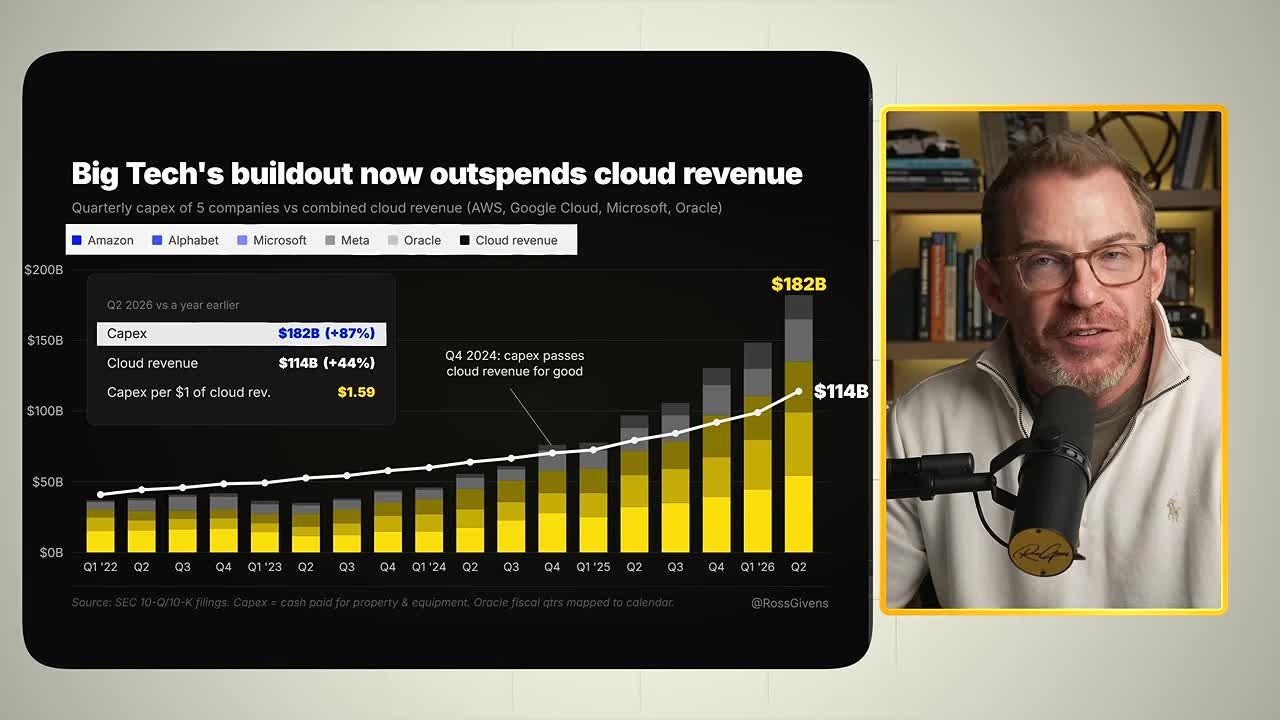
So who’s actually footing the bill for all this infrastructure? Mostly five companies: Amazon, Microsoft, Alphabet, Meta, and Oracle. Last quarter alone, those five spent $181.5 billion on buildings and equipment, up 87% from a year earlier. Their cloud business, the part that rents the computing power out, brought in $114 billion, up 44%. That’s a strong growth rate for almost any business on earth.
But spending growth has beaten cloud revenue growth for ten quarters straight. For every $1 of cloud revenue coming in, these companies are putting about $1.59 into building more. Microsoft and Meta plowed 96% of their main business cash flow into this AI build-out last quarter. Amazon and Alphabet each spent more than they brought in entirely.
So where does the rest of the money come from? Borrowing. And that, right there, is step one of every tech bubble in history.
The Four Stages Every Tech Bubble Follows
Every tech bubble in history, going back roughly 30 to 40 years at a time, collapses in the same four stages. Railways in Britain, American railroads, radio, the Nifty Fifty, fiber optic cable, even power plants in 2001. The technology changes. The steps do not.
1. Build Way Ahead of Demand With Borrowed Money
In Britain in the 1840s, investment in new railway track jumped from 13 million pounds in 1845 to 44 million pounds in 1847. At the peak, the country poured roughly 7% of its entire economy into railways. Many of those shares were bought on partial payment, with investors owing the rest later. When the companies came calling for that remaining money, people had to sell other assets to pay for it. Railway stocks fell 64%.
2. The Price of the Thing You Built Collapses
In the late 1990s, telecom companies buried fiber optic cable across the country, and it all came online around the same time. In 2000, leasing a fast lane between New York and Los Angeles cost about $1.8 million a year. A year later it was $597,000. A year after that, $248,000. That’s an 86% drop in two years. The loan payments on that cable didn’t drop 86%. The revenue did.
3. Money Gets Expensive
Once lenders see the price of the underlying product falling, they panic, and nervous lenders either charge more or stop lending altogether. In 2000, the Fed pushed rates to 6.5% and the market for new tech stock offerings dried up. In 2001, it was power plants. After Enron collapsed, power prices fell and lenders ran for the exits.
4. The Most Borrowed-Up Players Break First
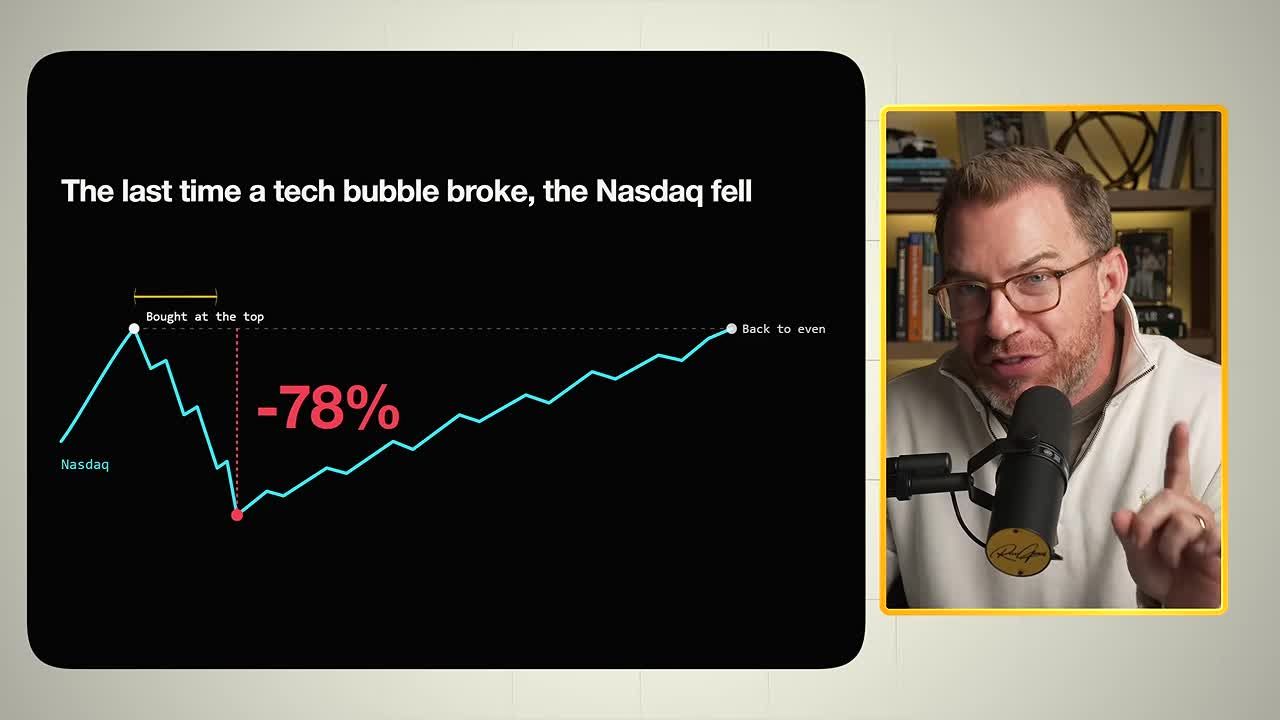
Global Crossing filed for bankruptcy in January 2002. WorldCom filed six months later, the biggest bankruptcy in American history at the time, with accounting fraud layered on top. The companies that supplied their equipment went down too: Nortel and Lucent each fell about 99%. Even the good companies got crushed. Amazon fell 94% before eventually becoming one of the biggest companies in the world.
Get an entire year of live weekly mentoring sessions, my newsletter, indicators, bonus reports, tons more. Click the link and I’ll see you in the next live session.
Join my Black Ops Trading Club
Comparing the AI vs. Dot-Com Eras
The ai bubble vs dot-com bubble comparison is the clearest way to measure where we actually stand today. Both involve real technology, massive borrowed-money infrastructure spending, and a product whose price behaves very differently than people expect.
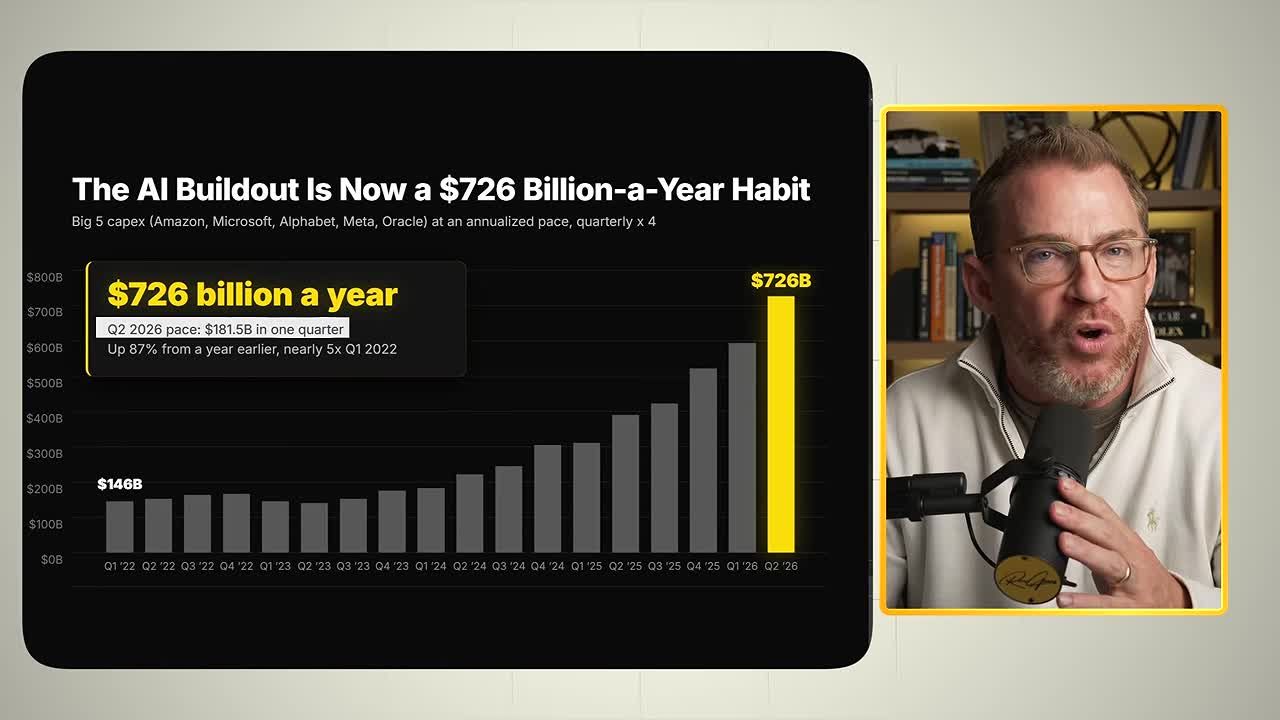
Step one for AI is already undeniable. Amazon, Microsoft, Alphabet, Meta, and Oracle spent $181.5 billion on buildings, chips, and equipment last quarter alone, a pace of $726 billion a year. That’s up 87% from a year ago and nearly five times what these companies were spending in early 2022. Morgan Stanley projects the world will spend about $2.9 trillion on data centers through 2028. More of that spending every quarter is coming from debt. Amazon, Alphabet, Meta, and Oracle sold about $194 billion in bonds through July of this year alone, compared to roughly $108 billion for all of 2025. Alphabet even sold a 100-year bond. For a company that’s been around less than 30 years, that’s not a typo.
Step three, money getting expensive, is where the $38 billion Vantage loan fits in. Morgan Stanley figures there’s a $1.5 trillion gap between what data center construction will cost through 2028 and what big tech can actually pay out of pocket. It expects about $800 billion of that gap to come from private credit, meaning lending that doesn’t go through a bank, funded by pension funds, insurance companies, and retail investors.
That pipe is already drying up. In the second quarter, retail private credit funds raised just $2 billion, compared to about $11 billion a year earlier, while investors pulled out $5.9 billion. According to Stanger, the first quarter of this year was the first time on record that more money left these funds than came in. The second quarter made it two in a row.
The $38 billion loan itself, put together by JPMorgan and MUFG for Vantage’s data center campuses tied to Oracle and OpenAI’s Stargate project, normally would have sold off within weeks. This one took months, with some lenders unloading pieces at a discount. That same week, a $5 billion data center loan called Volta had to raise its interest rate just to find buyers. The price of insurance against Oracle defaulting on its debt hit a record high. CoreWeave had to offer 9.625% interest to sell its bonds; the market now wants 14.6% to hold that same debt. Meta’s $27.3 billion bond behind its Hyperion data center is already trading below face value. The Fed raised rates in September, and the 10-year Treasury yield topped 5% for the first time since 2007.
Why Are AI Stocks Crashing Now?
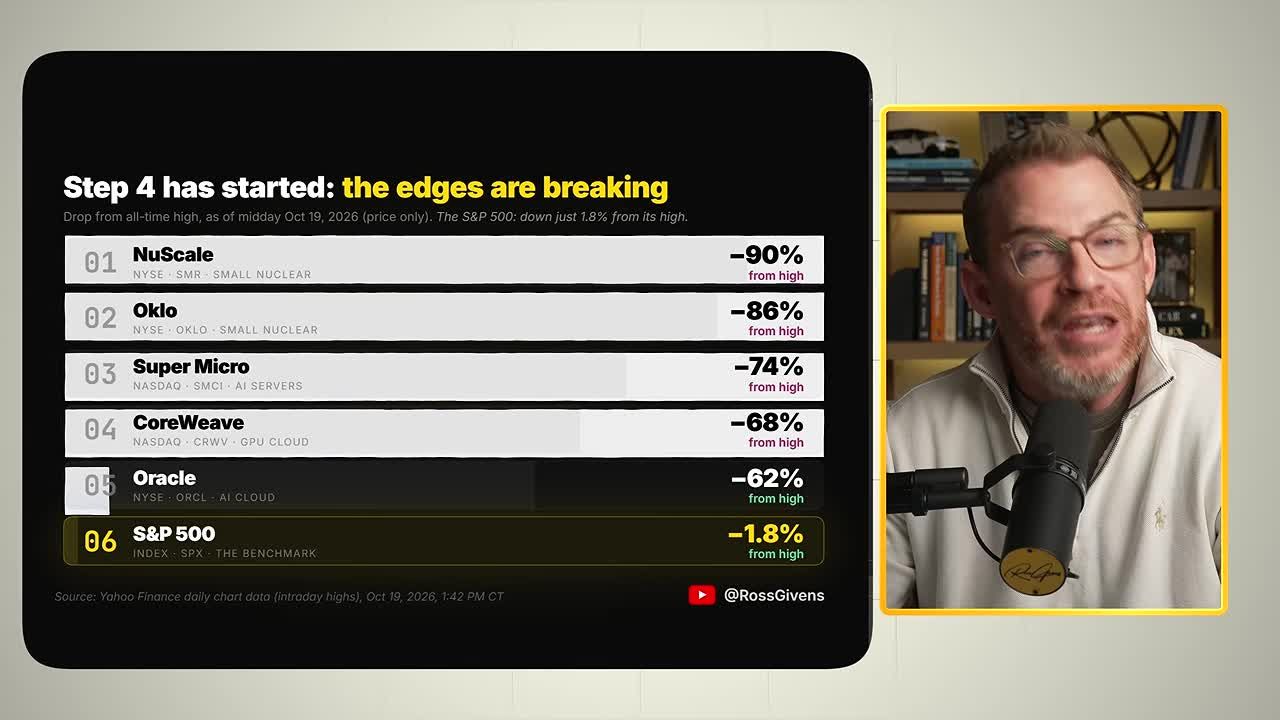
AI-adjacent stocks are falling because step four, the “weakest players break first” stage, is already beginning, even though the broader market hasn’t noticed yet. The most borrowed-up, hype-driven names are dropping hard while the index stays calm.
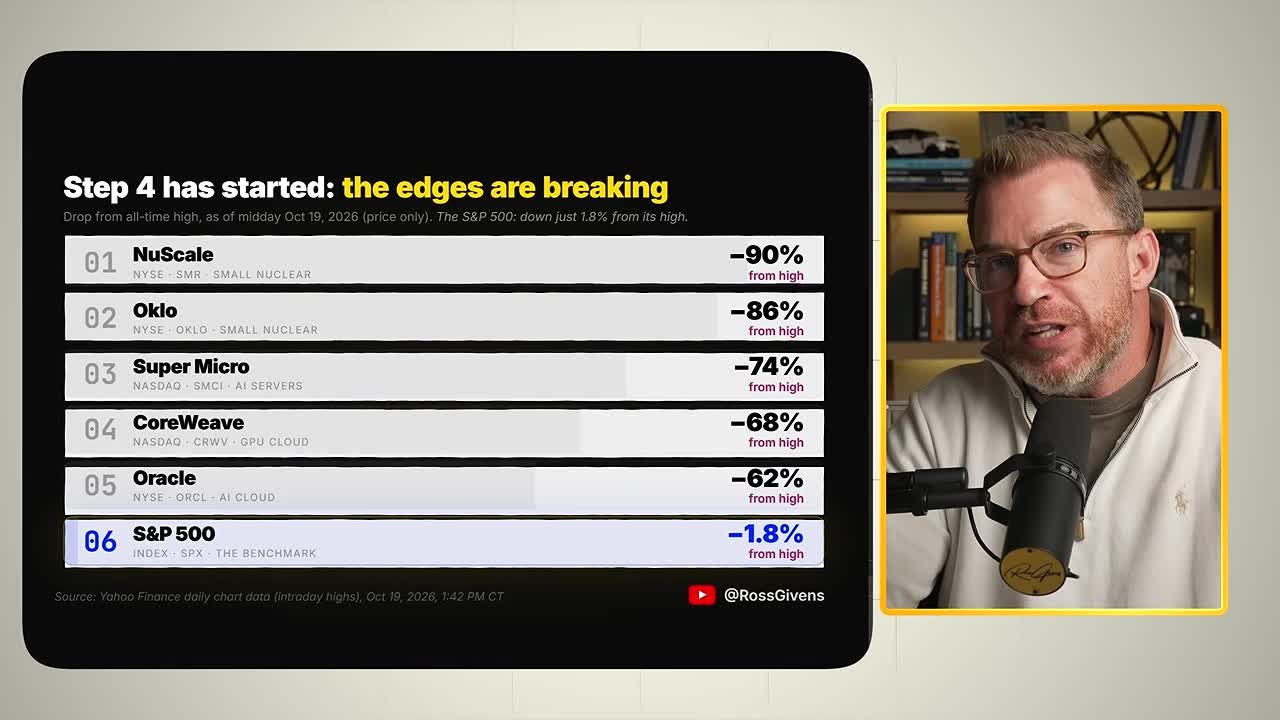
From their highs as of October 19th, NuScale Power is down 90%, Oklo is down 86%, Supermicro (which builds servers for NVIDIA’s chips) is down 74%, CoreWeave is down 68%, and Oracle, a company nearly 50 years old, is down 62%. Meanwhile, the S&P 500 is down less than 2% from its highs. That gap is exactly what step four looks like in its early innings: the edges breaking while the index still looks fine. Most people miss this coming because the headline numbers don’t move yet.
Will the AI Bubble Burst in 2026?
The AI stock bubble hasn’t fully burst yet because the one missing ingredient, a collapse in the price of the actual product, hasn’t happened. Until GPU rental prices start falling for a sustained stretch, demand is still outrunning supply, and that keeps the bubble inflated for now.
Remember the 13-fold drop in the cost to get the same AI answer? That’s not the number these loans depend on. The loans depend on what people will pay to rent the chips, and that price is rising, not falling. The median price to rent one NVIDIA H100 chip for an hour is $3.81 today, up from about $3 a year ago, a 28% increase. Across all chips tracked, rental prices are up roughly 21% this year. Compare that to 2001, when the price of bandwidth between New York and Los Angeles fell 67% in a single year. Right now, AI computing power is getting more expensive, not cheaper, which tells me step two hasn’t been triggered yet.
But when it is triggered, here’s what happens. A lot of these AI loans are backed by the chips themselves as collateral. If rental prices start falling, the chips are worth less, lenders demand more collateral, and borrowers have to sell chips to raise cash. Whoever buys those chips at a discount rents them out even cheaper to undercut competitors, pushing rental prices down further and feeding the spiral. That’s the same mechanism that took down the fiber optic companies in 2000, just with a different product.
The ai stock bubble prediction I’m watching closely comes down to one number: GPU rental rates, published weekly and available to anyone. When that line rolls over and keeps falling for a couple of months, step two has started. The other thing to watch is spending. Microsoft and Alphabet report earnings on October 28th, Amazon the day after on the 29th. If any of them cuts their spending plans for next year, that’s the market’s first real crack in step one, and it will get punished.
What Will Happen When the AI Bubble Bursts
When the AI stock bubble finally breaks, expect the same pattern every prior bubble has followed: the most leveraged, hype-driven names collapse first, their suppliers get dragged down next, and even strong survivors get temporarily crushed before eventually recovering. The technology itself keeps changing the world. The stock prices just don’t reflect that on the way down.
That’s exactly what happened in 2000 and 2001. Global Crossing and WorldCom went bankrupt. Nortel and Lucent fell about 99%. Amazon fell 94% before becoming one of the largest companies on earth. The pattern isn’t “the technology fails.” It’s “the stocks get destroyed on the way to the technology mattering.”
This is also where the opportunity shows up. Busts are when fortunes get made, because when a sector sells off, investors dump the good and the bad together. ETFs own every stock in the basket, so when tens of billions of dollars exit, they’re forced to sell everything, not just the weak names. That indiscriminate selling is exactly why the best deals always show up in the wreckage, not before it.
Every bubble also leaves something useful behind. Britain kept its railways. America kept its fiber optic cable. Whatever happens to the current crop of AI stocks, we’ll keep the data centers, and AI will keep changing daily life the way the internet eventually did. You just don’t want to be the one who paid the highest price for the stocks at the top.
Key Takeaways
- Step one is confirmed: Big tech is spending $726 billion a year building AI infrastructure, up 87% from a year ago, increasingly funded by debt rather than cash flow.
- Step three is confirmed: Lenders are demanding higher rates (CoreWeave bonds jumping from 9.625% to a market demand of 14.6%) and private credit funds are seeing more money leave than come in for two quarters straight.
- Step four has started at the edges: NuScale, Oklo, Supermicro, CoreWeave, and Oracle are all down between 62% and 90% from highs while the S&P 500 is barely down 2%.
- Step two is the missing piece: GPU rental prices are rising 21-28% this year, not collapsing like bandwidth prices did in 2001, which means the final trigger hasn’t fired yet.
- Watch two things going forward: weekly GPU rental rate data and the upcoming earnings calls from Microsoft, Alphabet, and Amazon in late October, where any spending cuts would mark a real crack in step one.
- Every bubble bursts the same way: the most leveraged names break first, their suppliers follow, and even the eventual winners get crushed temporarily before the real opportunity shows up in the wreckage.
Final Thoughts: Patience Pays More Than Prediction
The ai stock bubble today isn’t a mystery. Three of the four historical warning steps are already sitting in plain sight: massive borrowed-money spending, lenders demanding higher rates, and the most leveraged names already cracking while the broader index stays calm. The only piece missing is a collapse in GPU rental prices, and that number is published every single week for anyone willing to check it.
This isn’t a call to panic, and it isn’t a call to ignore AI stocks either. It’s a call to know exactly which number flips the switch, and to have a plan ready before it does. The technology is real. The companies building it will likely still matter years from now. But the stocks at the top of this run are not guaranteed to survive the same way the technology will.
When this bubble turns, and based on history, it will, the biggest wins won’t go to the people who panicked or the people who ignored the warning signs completely. They’ll go to the people who already knew what they wanted to buy and at what price, long before everyone else figured it out.
Get an entire year of live weekly mentoring sessions, my newsletter, indicators, bonus reports, tons more. Click the link and I’ll see you in the next live session.
Join my Black Ops Trading Club
DISCLAIMER: Traders Agency does not offer financial advice. The information provided is for educational purposes only and should not be considered financial advice. Traders Agency is not responsible for any financial losses or consequences resulting from the use of the information provided. Trading carries inherent risks and may not be suitable for all individuals. You are advised to conduct your own research and seek personalized advice before making any investment decisions, recognizing the potential risks and rewards involved.
See more from Traders Agency on Google
Make us a preferred source and our market analysis will appear more prominently in your Google Search, Top Stories, and AI results.
Add to Preferred Sources