


Two new positions went on the books this week, and both rank among the best stocks to buy now based on the cleanest buy points I've seen in weeks: Workday (WDAY) and CDW. Both are high-momentum names that move three percent or more per day on average. Both are showing textbook technical patterns that hand me a defined entry, a tight stop, and a real profit target.
Timing matters here, because the market is lying to most people.
The Nasdaq and S&P are sitting within a couple of percent of all-time highs. On the surface it looks like an easy market, like it wants to explode. Underneath that calm, plenty of individual stocks are weakening. Some of the biggest AI companies have taken 60, 70, even 80 percent hits while the index keeps holding up high.
That disconnect is why you can't just buy the index and call it a day. You have to be choosy. You have to know exactly what you're buying and why.
Two Stocks to Buy Now With Clean Setups
Bottom Line: Two stocks to buy now, Workday and CDW, both show clean technical breakouts backed by solid fundamentals, even as many individual stocks weaken beneath calm-looking index highs. Defining risk with a tight stop before entry, rather than chasing the broader market, is what separates these setups from guesswork.
Same sector, opposite ends of the price cycle
The best stocks to buy now are the ones with strong fundamentals that are also breaking out of clean, low-risk technical patterns. At the moment, that's Workday and CDW, two IT names sitting at very different stages of their cycles.
Workday already had its monster run. It shot from roughly $100 to $300 coming out of the COVID bear market, and now it's getting its legs again. CDW is the mirror image: way off its 2024 peak near $260, absolutely slaughtered over the last two years, and only now showing real signs of life.
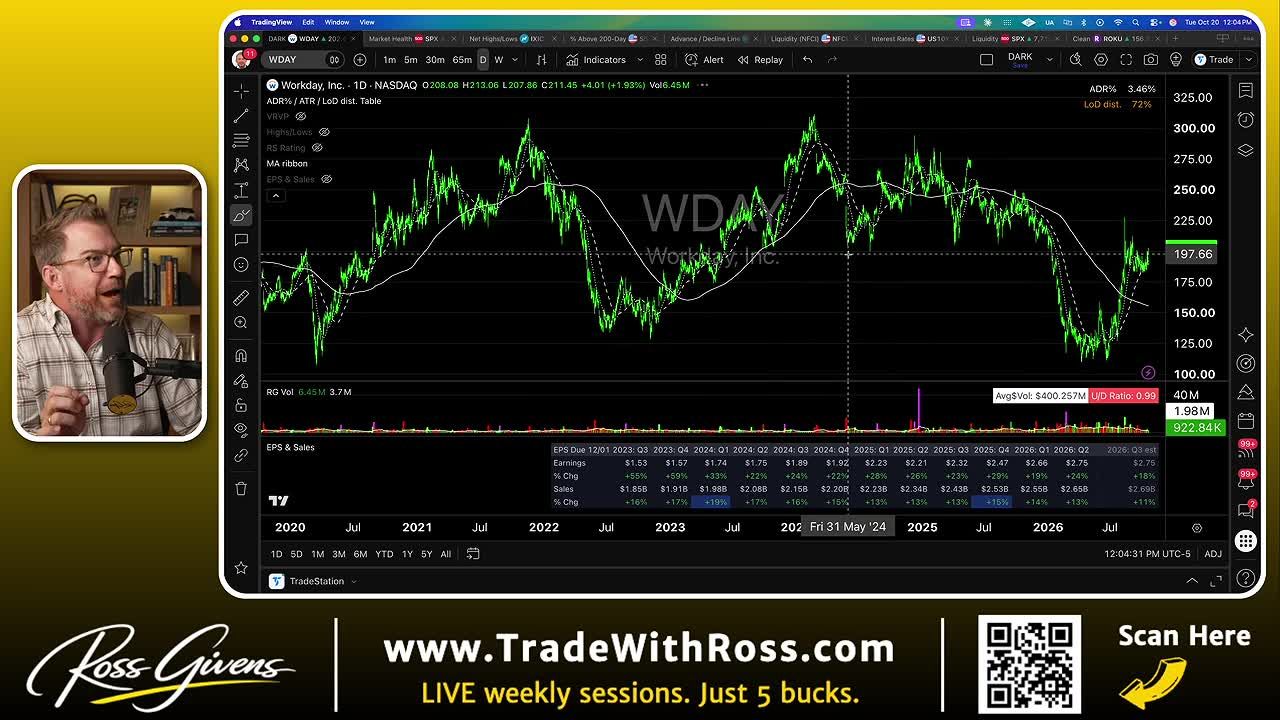
I'll be honest with you: I can tell you roughly what these two companies do, but I don't fully understand the business models. I don't care. I'm only playing supply and demand.
What I care about is whether the chart and the fundamentals line up to give me a trade where the reward dramatically outweighs the risk.
Why Can These Momentum Names Keep Running?
Both WDAY and CDW move more than most stocks in the market, three-plus percent per day on average. Volatility cuts both ways. But catch these names at the right point in the cycle and they can deliver 20, 30, even 40 percent in a matter of weeks.
Workday's fundamentals back the setup.
Everything there looks good.
CDW is a different animal. Its chart shows a massive final sell-off after earnings, followed by heavy accumulation. The stock was driven from 100 to 140 in two weeks. That's massive institutional accumulation. After that spike it consolidated for three or four days up near the highs, held steady, and started pushing higher again.
Neither one of these is a guess. Both are backed by price action showing real money at work.
How Does a High-Tight Flag Pattern Work?
A high-tight flag forms when a stock makes a fast, large move, typically 100 percent or more, then pulls back in a tight, controlled range before breaking out again. The pattern comes from the work of William O'Neil, founder of Investor's Business Daily, and when it breaks, the odds are stacked toward a continuation move.
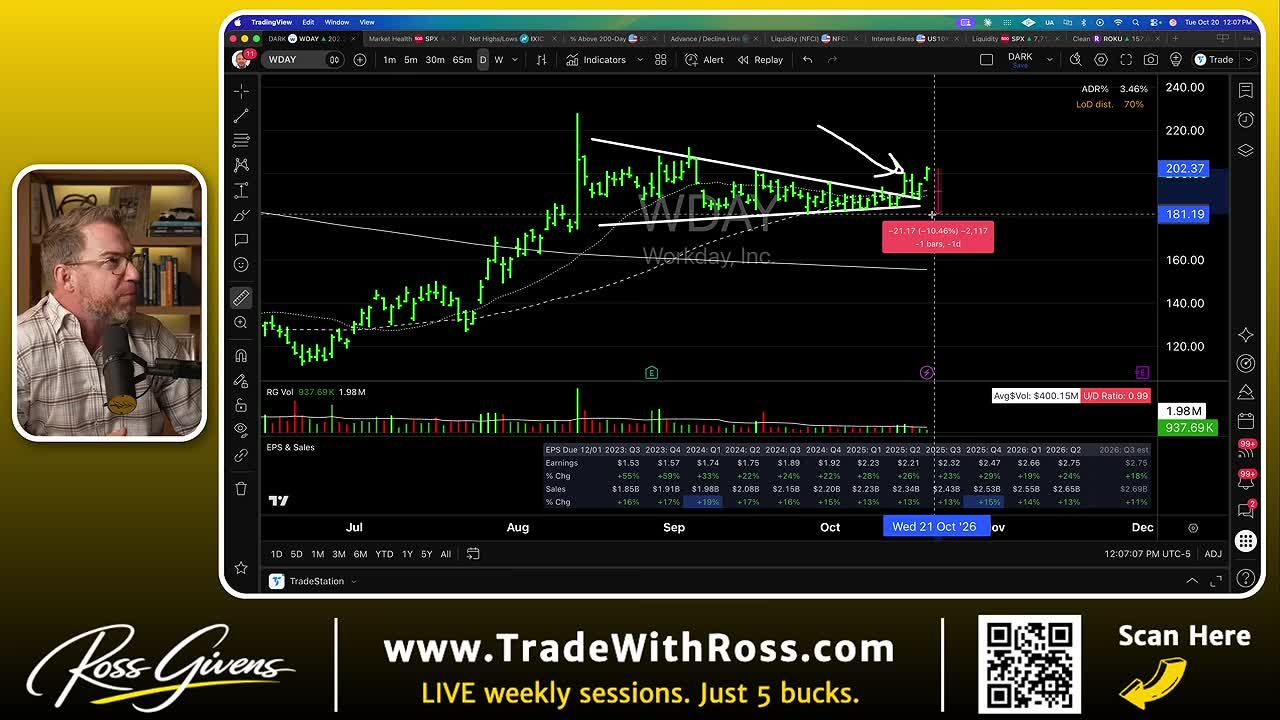
Workday ran the playbook perfectly. Between late June and mid-August, roughly two months, the stock doubled. That's the pole of the flag.
After a double like that, some holders want to sell and take profits. That's normal. I'll be one of them next time around.
What you don't want is the stock giving the entire move back. You want the pullback contained.
- Keep the pullback inside 20% to 25% at maximum. Anything deeper and the pattern starts to fail.
- Look for tightening action, with a declining resistance line catching the tips of the recent highs.
- Buy the breakout, when price pushes back outside the flag and above that declining resistance.
Two things make this work. First, the odds are stacked toward a continuation once the breakout happens. The first double absorbed the sellers who wanted to cash out, so by the time the stock breaks out again, they're out of the way and new buyers are stepping back in.
Second, and just as important: you don't need to risk a lot of money to play it. The stop sits right at the low of the flag.
Workday: The Trade I Took
As of midday Tuesday, October 20, Workday was sitting at $202 and change, right at the breakout point of its high-tight flag.
The low of the flag came in at $181.47, so I worked a stop at $181. Call it a 10% risk on the position.
For the target, I used the standard approach: take the size of the first run-up and add 80% to 100% of that measured move on top of the flag level. In Workday's case the first run was worth roughly $100 a share, closer to $105. Add that to the flag and the target lands around $300 a share, roughly a 50% move from the current price.
I picked up 50 shares, set the stop at $181 (about 10.5% risk), and put the target just under $300, because sometimes they get cute and the stock doesn't quite tag the round number. Both orders good till canceled.
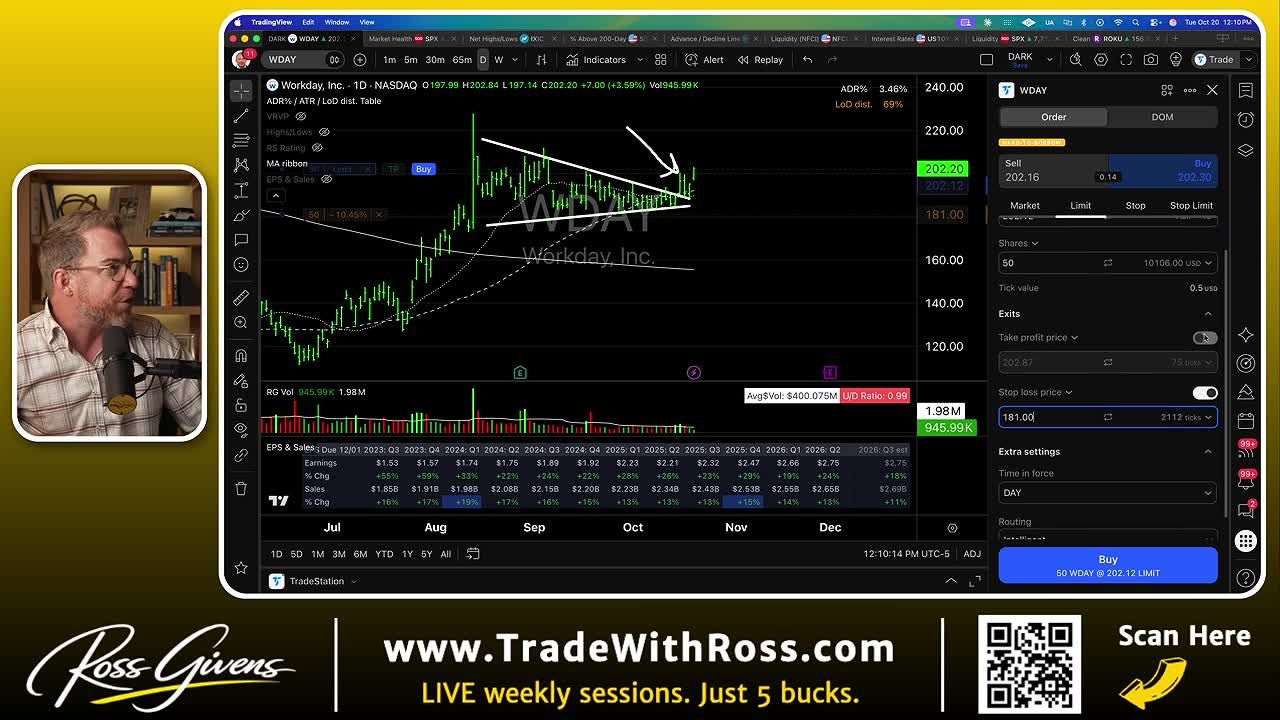
That's the kind of asymmetry I want on every position, especially in a market where the index is masking the weakness underneath. You can review Workday's filings directly through the SEC's EDGAR database if you want to check the growth numbers yourself.
Get an entire year of live weekly mentoring sessions, my newsletter, indicators, bonus reports, tons more. Click the link and I'll see you in the next live session.
Join my Black Ops Trading ClubWhat Are the Four Stages of a Stock?
The best stocks to buy now are the ones coming out of a stage one base into a fresh stage two uptrend. That's where the odds are best weighted in your favor, and it's exactly what CDW is doing right now.
Stocks repeat the same four-stage process over and over:
- Stage one, accumulation. The big shops buy while the stock is cheap relative to sales and profits.
- Stage two, markup. The big uptrend. This is where the money is made.
- Stage three, distribution. Institutions get out near the top.
- Stage four, decline. Leading stocks typically lose 50% to 80% of their value before cycling back to stage one.
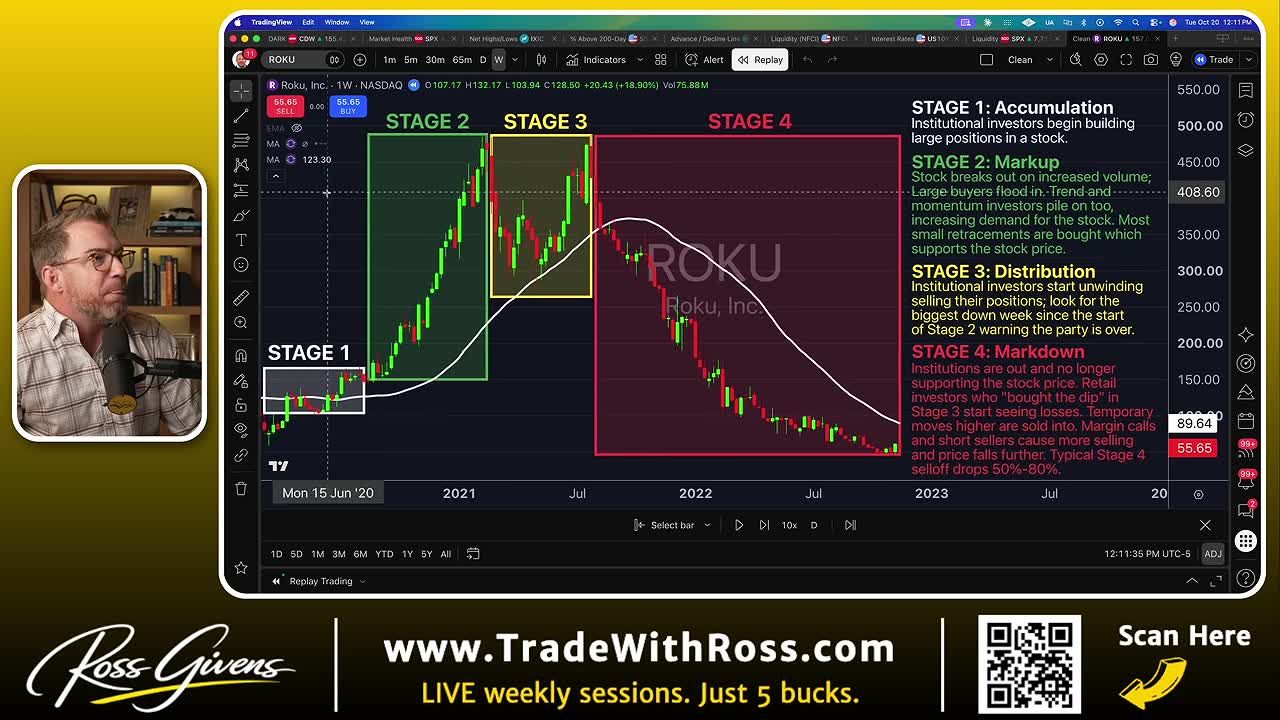
Catch a stock coming out of stage one and into stage two and, all things being equal, you're standing at the highest-probability entry point in the entire cycle.
CDW: A New Stage Two Breakout
CDW's weekly chart shows the cycle almost perfectly. A clear stage two uptrend. A stage three top where it slipped under the moving averages. A brutal stage four decline. Then six to nine months of stage one basing.
It's finally breaking out of that base.
To qualify as a real stage two breakout, a stock has to meet a few rules. It needs to be at least 30% off its low, and CDW is up 60%. It needs to be trading above the 50-day and 200-day moving averages, stacked properly. And the 200-day, the long-term trend line, needs to be flattening out and starting to turn up. CDW is just barely doing that.
I'll be straight with you: this chart isn't perfect. It's not a setup where I look at it and think I have to take this one. But it's showing enough of the right signs, including that 100-to-140 accumulation move in two weeks, that I'm taking the trade.
Where I Put the Stop
The biggest mistake traders make with high-momentum names isn't picking the wrong stock. It's sizing the position wrong or dropping a stop in a careless spot. Every trade I take gets a defined stop before I click buy.
On CDW, the prior swing low measured about 17% below the entry. More risk than I wanted to carry. So instead of using that swing low, I worked the stop just beneath the 20-day and 50-day moving averages, which were sitting right on top of each other.
There was also a specific high-volume up day on the 22nd where the stock tacked on 5.5% on a big spike in buying volume. That's large buyers stepping in aggressively. I don't think price should go back below that low.
The formula is the same on every trade. Identify the pattern. Find the logical stop based on the chart structure, not an arbitrary percentage. Size the position so a stop-out costs a small, known amount. Then set a realistic target off the measured move or prior resistance.
What Makes a Clean Buy Point
A clean buy point pairs strong underlying fundamentals with a technical pattern that gives you a tight, defined stop and a target several times larger than your downside. WDAY and CDW both check those boxes, which is why I entered both instead of waiting.
Workday brings steady double-digit sales growth, steady profit growth, and a textbook high-tight flag breakout with roughly $10 of risk against roughly $50 of reward. CDW brings a stage one to stage two transition backed by fast, high-volume accumulation, with risk contained to around 8.5% to 9%.
Neither setup requires you to predict the future. You're identifying where the risk is small and defined, and where the reward is large by comparison. That's the entire game.
Be Selective or Be Wrong
When the index looks strong while some of the biggest AI names get hit 60 to 80 percent, being selective isn't optional. It's the whole strategy.
You don't need to own everything. When you're hunting for stocks to buy now, you need two or three setups where the chart and the fundamentals agree, and where your risk is small enough that being wrong doesn't hurt.
Workday and CDW both fit. One is a momentum name coming off a massive prior run and breaking out of a tight flag. The other is a beaten-down stock finally showing the first real signs of institutional buying after two years of damage.
Different stories, same discipline. Define your risk first. Size the position second. Let the target take care of itself.
Get an entire year of live weekly mentoring sessions, my newsletter, indicators, bonus reports, tons more. Click the link and I'll see you in the next live session.
DISCLAIMER: Traders Agency does not offer financial advice. The information provided is for educational purposes only and should not be considered financial advice. Traders Agency is not responsible for any financial losses or consequences resulting from the use of the information provided. Trading carries inherent risks and may not be suitable for all individuals. You are advised to conduct your own research and seek personalized advice before making any investment decisions, recognizing the potential risks and rewards involved.
See more from Traders Agency on Google
Make us a preferred source and our market analysis will appear more prominently in your Google Search, Top Stories, and AI results.
Add to Preferred Sources