
The benchmark 10-year U.S. Treasury yield pushed above 5% early Tuesday, its highest level since 2007, as a bond sell-off deepened just hours before the Federal Reserve opens a two-day policy meeting that markets now treat as an almost certain rate-hike decision. The 10-year yield jumped more than 6 basis points to 5.025% as of 1:10 a.m. ET, according to CNBC, extending a rise that has been building since the start of September.
Yields Surge Across the Curve
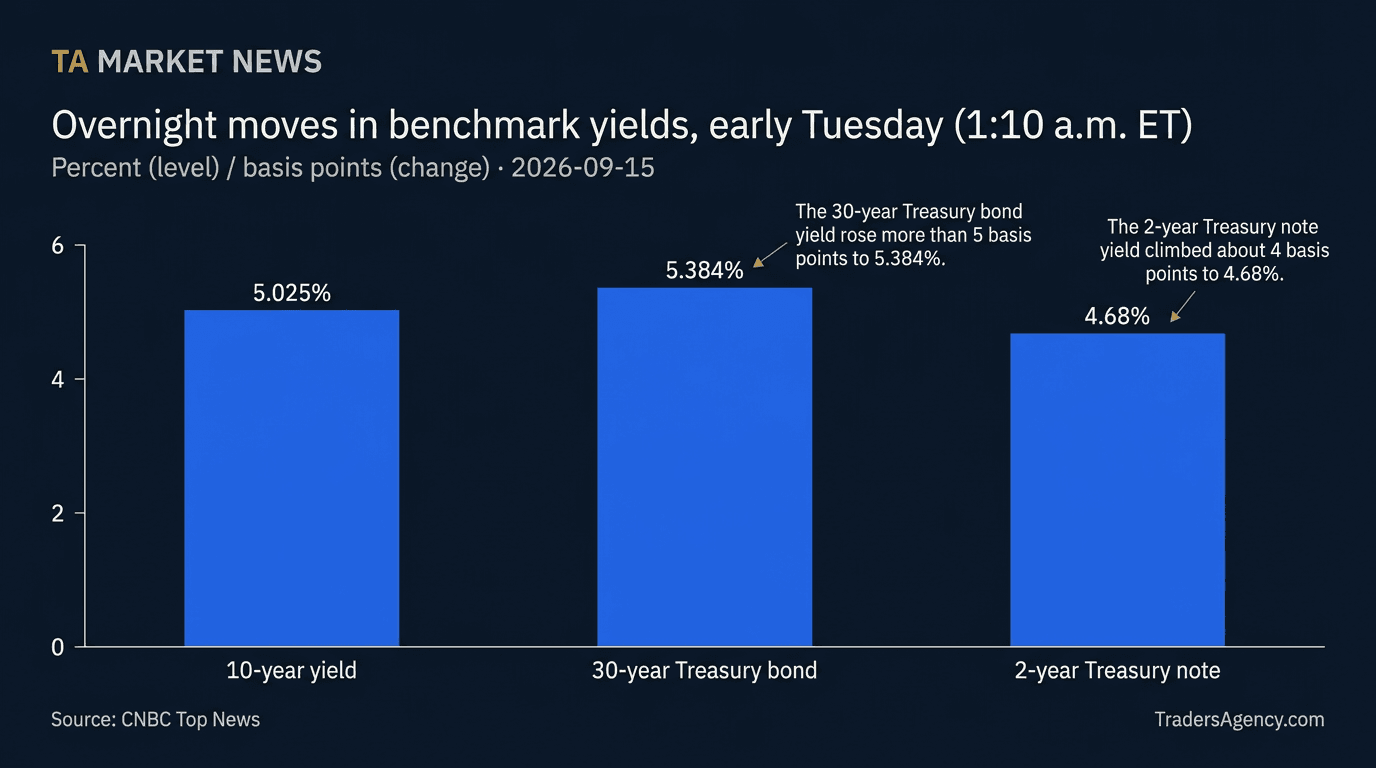
The move was not confined to the 10-year. CNBC reported the 30-year Treasury bond yield rose more than 5 basis points to 5.384%, while the 2-year note climbed about 4 basis points to 4.68%. A same-day snapshot from Trading Economics showed the 10-year at 5.02%, the 5-year at 4.85%, the 7-year at 4.93%, the 20-year at 5.42% and the 30-year at 5.38%, with the 10-year up roughly 0.98 percentage points over the past year.
Using the CNBC-reported levels, the gap between the 2-year and 10-year yields (the 2s10s spread) works out to about 34.5 basis points (5.025% minus 4.68%), our calculation from those figures. Interpretation: a positively sloped curve of this size is consistent with a market pricing near-term policy tightening while still demanding extra compensation to hold longer-dated debt.
Tuesday's move extended a string of multiyear highs. Per CNBC, the 10-year touched 4.792% on Sept. 1 (highest since Jan. 14, 2025), 4.818% on Sept. 2 (highest since November 2023), 4.845% on Sept. 9, and 4.954% on Sept. 10 (highest since Oct. 26, 2023) before clearing 5% on Sept. 15. For context, Trading Economics notes the 10-year's all-time high was 15.82% in September 1981.
Fed Hike Odds Near Certainty
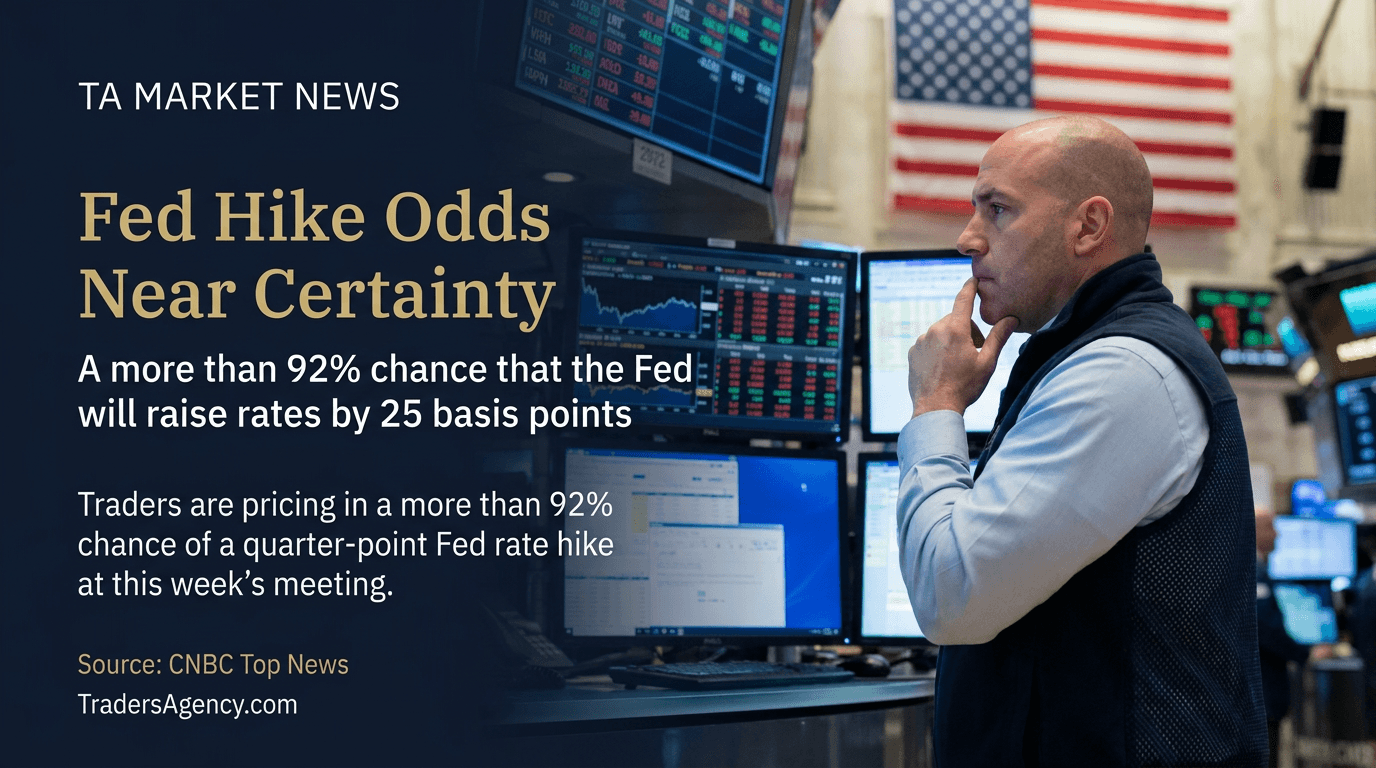
The sell-off comes directly ahead of the Fed's rate decision. CNBC, citing the CME FedWatch tool, reported that traders are pricing in a more than 92% chance of a 25-basis-point rate hike at the two-day meeting that began Tuesday, after August inflation remained well above the central bank's 2% target. Trading Economics separately put the odds of a quarter-point hike at roughly 92%, following what it described as hotter-than-expected inflation data last week.
New York Fed President John Williams offered a more measured read on the yield spike earlier this month. Speaking to CNBC on Sept. 2, Williams said he believes the rise reflects a strong economy, but added he was still processing recent data: "There's no clear signs right now whether monetary policy currently is sufficient to make sure we bring inflation back to target in the next year or two, or whether you need to see further action to do that," he said, adding that "we have to wait and see" on the need for further hikes.
Oil, Inflation Expectations and the Real-Yield Split
Much of the recent pressure has been tied to oil. Brent crude futures settled up 3.36% at $101.21 a barrel on Sept. 9, while West Texas Intermediate rose 3.25% to close at $96.05, according to CNBC — the highest settlements for both benchmarks since May. Trading Economics reported that oil prices resumed their climb with Saudi Arabia's East-West pipeline still shut, while Ukraine disputed President Trump's claim that it had already reached an agreement with Russia to halt attacks on energy infrastructure, keeping supply risk in the headlines.
BMO Capital Markets calculated that the one-month rolling correlation between front-month WTI and the 10-year yield has climbed to 0.96, a tie that Interactive Brokers chief strategist Steve Sosnick called unusually tight: "Normally, the relationship isn't as clean as it is now, but the geopolitical drivers behind the price of oil and global inflation are so prominent that the normally modest correlation has become much tighter," he told CNBC. "As long as oil prices remain firm and continue to drift higher, this will add pressure to interest rates." Standard Chartered's CIO of fixed income and FX, Jonathan Liang, made a similar point to CNBC: "U.S. 10-year treasuries are highly sensitive to inflation expectations, and with inflation gauges still above the Fed's target of 2%, we believe this tight correlation will likely persist for a while."
The Trading Economics snapshot also shows the 10-year TIPS yield at 2.64%, versus the 5.02% nominal 10-year. Subtracting the two implies a market-priced inflation expectation, or breakeven rate, of roughly 2.38% (5.02% minus 2.64%) — our calculation from the same Trading Economics table — above the Fed's 2% target. Interpretation: that same table shows the nominal 10-year up 0.983 percentage points over the past year against a 0.974-point rise in the 10-year TIPS yield, so on those figures most of the past year's increase has come from higher real yields rather than a wider inflation breakeven. On the data front, CNBC reported that August producer prices rose 0.4% month over month, in line with Dow Jones consensus, while core PPI rose 0.2%, slightly softer than the 0.3% forecast, even as August inflation stayed well above the Fed's 2% target, per CNBC.
Treasury Supply and Buyback Dynamics
Supply-side moves have added to the volatility rather than calming it. The Treasury Department said on Aug. 19 it would at least double the size of its liquidity-support buyback operations for longer-dated nominal coupons, from a $2 billion to at least a $4 billion maximum per operation, effective Sept. 9 through Nov. 4, 2026, according to a Treasury Department press release.
Yet the follow-through disappointed some investors. CNBC reported that Treasury Secretary Scott Bessent said on Sept. 9 the department would buy back $6 billion of longer-dated debt, less than the $7 billion to $8 billion some on Wall Street had expected, according to Peter Boockvar of The Boock Report. The next day's operation came in even lighter: Treasury repurchased nearly $5.2 billion in off-the-run 10- and 20-year notes out of $10.5 billion offered, concentrated among a few holders likely to be primary dealers, per CNBC.
Auction demand, by contrast, has held up. BMO Capital Markets said the Sept. 10 30-year auction "was very strong with a stop-through of 2.7 bp and non-dealer bidding of 97.8% vs. an 88.5% 6-reopening average," according to CNBC, and BMO's Ian Lyngen noted the market rallied off session lows following a strong 10-year auction on Sept. 9.
Fiscal Backdrop
The Committee for a Responsible Federal Budget has flagged the fiscal cost of the higher-rate regime. In a Sept. 9 analysis, CRFB said the 10-year had closed at 4.8%, a level not seen in nearly three years and more than 60 basis points above Congressional Budget Office estimates, while the 2-year sat at a near two-year high of 4.4%. CRFB estimated that if rates stayed 64 basis points above CBO projections across the yield curve through the decade, it would add $2.3 trillion to the national debt, pushing debt to 125% of GDP by 2036 instead of 120%.
Where Forecasters See Yields Heading
Trading Economics' global macro models and analyst expectations put the 10-year at 4.96% by the end of this quarter and 4.73% in 12 months, both below Tuesday's 5.02% print. The gap between those two projections is 0.23 percentage points (4.96% minus 4.73%), a roughly 4.9% relative decline, our calculation from the Trading Economics figures. UBS chief investment officer of the Americas Ulrike Hoffmann-Burchardi offered a similar caution in a note earlier this month, telling clients that "uncertainty over the Federal Reserve's policy outlook, fiscal concerns, and rising AI-related debt issuance have all kept bonds under pressure," and that "yield volatility is likely to persist in the near term." Separately, Trading Economics attributed part of the long-end pressure to surging corporate debt issuance from AI companies, which it said has constrained capital allocation by primary dealers and other financial institutions.
Bottom Line
The 10-year Treasury yield's break above 5% marks its highest level since 2007, driven by a near-certain expectation of a Fed rate hike, an oil-driven jump in inflation expectations, and Treasury buyback operations that have come in smaller than some dealers hoped. Auction demand has stayed firm even as spot yields climbed, and forecasters at Trading Economics see yields gradually easing over the next year, though CRFB's fiscal arithmetic underscores how costly a prolonged period of elevated rates could be for the federal budget.
DISCLAIMER: Traders Agency does not offer financial advice. The information provided is for educational purposes only and should not be considered financial advice. Traders Agency is not responsible for any financial losses or consequences resulting from the use of the information provided. Trading carries inherent risks and may not be suitable for all individuals. You are advised to conduct your own research and seek personalized advice before making any investment decisions, recognizing the potential risks and rewards involved.
- CNBC Top News: 10-year Treasury yield rises to highest since 2007 as Fed rate-hike expectations rise · accessed Sep 15, 2026
- www.cnbc.com: 10-year Treasury yield tops 4.9%, highest since 2023, as oil surge raises inflation fears · accessed Sep 15, 2026
- www.cnbc.com: 10-year U.S. Treasury yield hits highest level since November 2023 · accessed Sep 15, 2026
- www.crfb.org: 10-Year Treasury Yield Hit 4.8%, Highest Since 2023 · accessed Sep 15, 2026
- tradingeconomics.com: US 10 Year Treasury Note Yield · accessed Sep 15, 2026
- www.cnbc.com: 10-year yield hits highest since January 2025 · accessed Sep 15, 2026
- ycharts.com: Human Verification · accessed Sep 15, 2026
- www.cnbc.com: 10-year Treasury yield touches highest since 2023 · accessed Sep 15, 2026
- www.macrotrends.net: 10 Year Treasury Yield (1962-2026) · accessed Sep 15, 2026
- home.treasury.gov: Treasury Announces Increased Sizes of Nominal Long-End Liquidity Support Buybacks Beginning September 9 · accessed Sep 15, 2026
- home.treasury.gov: U.S. Department of the Treasury · accessed Sep 15, 2026
See more from Traders Agency on Google
Make us a preferred source and our market analysis will appear more prominently in your Google Search, Top Stories, and AI results.
Add to Preferred Sources