One of the hardest things to do as an investor is buying stocks on the way down. It feels exactly like catching a falling knife. You know you want to own the asset, but stepping in front of a relentless selloff usually means bleeding capital all the way to the bottom.
Blindly guessing where a stock will find its floor is a losing strategy. You need to track exactly where institutional money previously agreed on the stock’s value.
By tracking volume at specific price levels, you can pinpoint where a falling stock is most likely to land. No guessing. Just data.
Traditional Volume Is Useless Here
Most investors rely on traditional volume metrics to confirm a trend. That’s a mistake — at least when you’re trying to find a bottom.
Traditional volume — those bars at the bottom of your chart — only shows how many shares traded at a particular time. A daily chart gives you share volume per day. An hourly chart gives you volume per hour. None of that tells you where buyers are waiting.
To find where buyers will actually step in, you need to know how many shares traded at a specific price.
That’s where an indicator called the Volume Profile becomes your most valuable tool. When you apply it to a chart, it appears as a gray mass on the side of your screen. Instead of measuring time, it measures price density. This completely changes how you read a pullback.
Two Phases of Market Movement
To understand why the Volume Profile works, you need to understand how markets actually function. Stocks constantly move between two distinct phases: price discovery and price acceptance.
Price Discovery
In price discovery, a stock is trending steadily — up or down. Buyers and sellers are actively trying to figure out what the company is worth.
If sales and profits are soaring, the story keeps getting better, and investors will continue paying higher and higher prices until the stock reaches a level that seems unsustainable. The exact opposite happens on the way down. Bad news drops, earnings fall, sellers dump the asset — and the stock stays in downward price discovery until buyers finally think it’s crazy cheap and step in to hold it up.
Price Acceptance
Price acceptance is the opposite. The stock trades in a very tight, range-bound manner. Buyers and sellers are pretty much in agreement about what it’s worth. Heavy trading occurs within this narrow range, building a massive base of historical volume.
Setting Up the Volume Profile
You can access the Volume Profile for free on TradingView, depending on your tier, and it’s available on other platforms as well.
Search your indicators for “Volume Profile” and you’ll see three options. You need to know which ones matter and which to ignore:
- Session Volume Profile: Measures volume for each individual trading session. Ignore it — this is for day traders.
- Visible Range Volume Profile: Maps volume for whatever price action is currently visible on your screen. As you zoom in or move the chart, the profile constantly adjusts to reflect the new data.
- Fixed Range Volume Profile: Your precision tool. It measures volume over a specific time period that you determine.
Get an entire year of live weekly mentoring sessions, my newsletter, indicators, bonus reports, tons more. Click the link and I’ll see you in the next live session.
Magnets vs. Trap Doors
When you apply the Fixed Range Volume Profile to a chart, you’ll immediately notice areas of high acceptance and low acceptance. These are your roadmap.
Areas of massive historical trading are known as High Volume Nodes (HVN). They tend to act as magnets for falling prices. When a stock rolls over, it is likely to fall to the nearest HVN. This is where you want to place your buy orders.
Conversely, you’ll see gaps in the profile where very little trading occurred. These are Low Volume Nodes.
Do not attempt to buy a stock inside a Low Volume Node. The indicator won’t get you to the penny every single time, but the data is clear: falling stocks will typically either reject Low Volume Nodes or blow right through them.
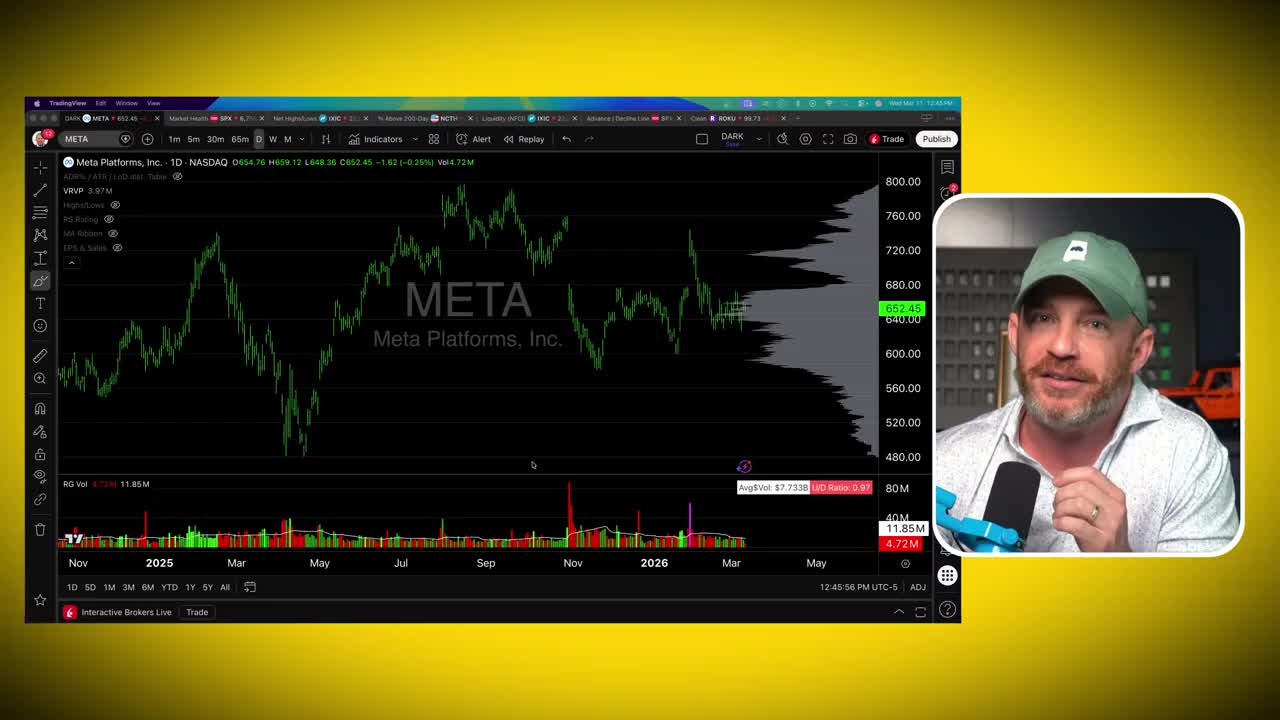
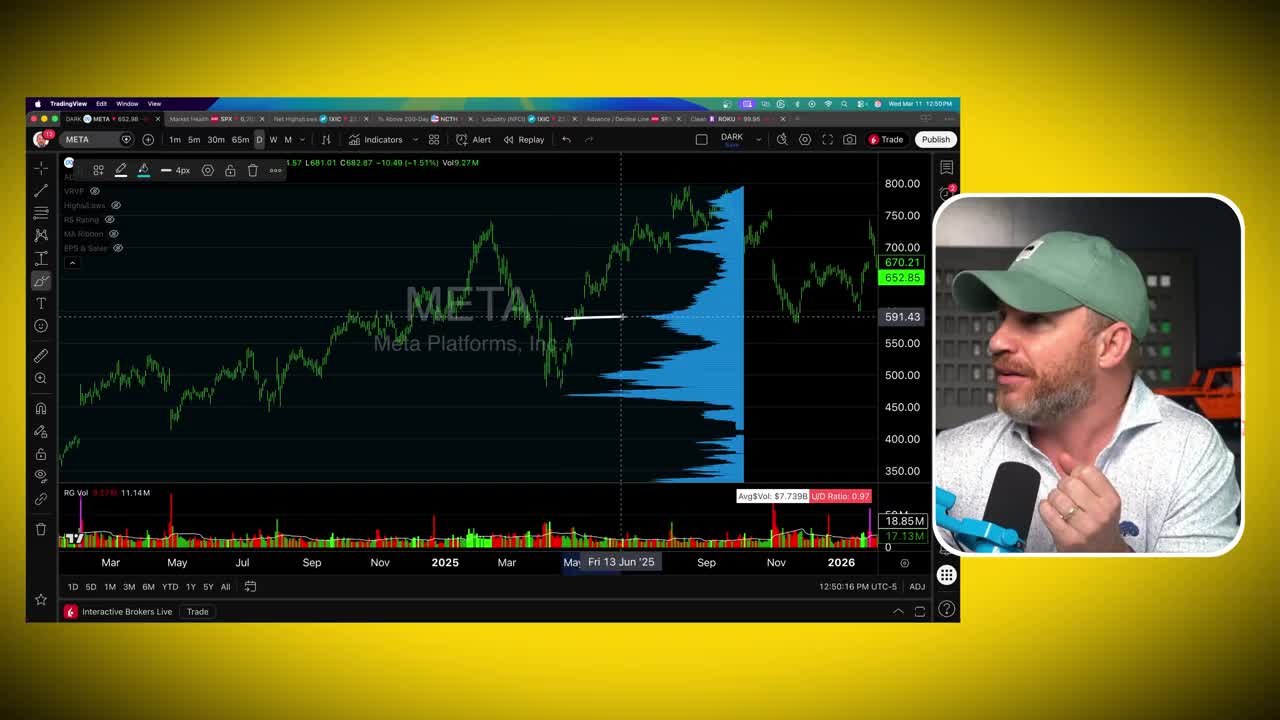
Case Study: The META Pullback
META was cruising higher, riding the momentum of the tariff situation, ripping upward — and then it started to roll over. Whether a stock breaks its 20-day moving average, its 50-day moving average, or breaks support, the result is the same: the asset is in a downtrend.
You might look at META and decide it’s a great company you want to hold for 10 or 20 years. But you don’t want to buy it at $700 if it’s going to keep falling to $600, $500, or $400.
To find the floor, apply the Fixed Range Volume Profile. Don’t pull data from 20 years ago — you’re only going to catch the mega monstrous moves. Instead, draw the Fixed Range from the most recent swing low. For META, that major swing low was in early 2024, which was really the start of the big rally.
Running the profile from that early 2024 low to the peak, the buy targets became clear:
When the stock rolled over, it fell pretty much to the penny right to that High Volume Node. If you picked up shares in that $590 to $600 range, you nailed the low. That was about as good as you could have bought it in the last six months, right off the low.
Case Study: The OKLO Collapse
This pattern repeats over and over. The exact same structure played out with OKLO, one of last year’s high flyers.
OKLO ripped from $22 to $200 last year. Eventually, the stock got weak, rolled over, broke support, and went into a steep downward spiral.
When a stock falls from $200, retail investors constantly try to catch the knife. They buy at $120. Then $110. Then $100. Then $90. They bleed capital the entire way down because they’re guessing.
Apply the Fixed Range Volume Profile from the swing low to the peak, and the guessing stops. The profile clearly showed the last major area of price acceptance sitting between $55 and $73 per share. The odds dictated that the stock was going to fall back to that historical base.
Instead of getting in at $120 or $110 or $100 or $90, the data gave you a buy target in the $60 to $70 range.
Executing This on Your Charts
You can apply this exact methodology to any stock pulling back from a major run. Stop trusting your gut and start trusting the historical volume data.
1. Wait for the Trend Break
Don’t preemptively jump in. Wait for the asset to actually break support or lose its key moving averages. Once the downtrend is confirmed, the setup begins.
2. Identify the Swing Low
Locate the most recent major swing low that initiated the massive run-up. Draw your Fixed Range Volume Profile from that specific low directly to the peak before the rollover.
3. Map the High Volume Nodes
Locate the largest clusters of volume on the side of your screen. Ignore the Low Volume Nodes. Set your buy targets directly inside the thickest areas of historical price acceptance.
Stop Guessing the Bottom
You cannot control what a stock does after you buy it. But you have control over where you choose to enter.
Buying stocks in a downtrend requires precision, not hope.
When you use the Volume Profile to identify High Volume Nodes, you strip the emotion out of the trade. You stop buying in the middle of a freefall and start accumulating shares where the largest buyers have already proven they see value.
Stop catching falling knives. Let the price come to the volume.
Get an entire year of live weekly mentoring sessions, my newsletter, indicators, bonus reports, tons more. Click the link and I’ll see you in the next live session.
DISCLAIMER: Traders Agency does not offer financial advice. The information provided is for educational purposes only and should not be considered financial advice. Traders Agency is not responsible for any financial losses or consequences resulting from the use of the information provided. Trading carries inherent risks and may not be suitable for all individuals. You are advised to conduct your own research and seek personalized advice before making any investment decisions, recognizing the potential risks and rewards involved.
See more from Traders Agency on Google
Make us a preferred source and our market analysis will appear more prominently in your Google Search, Top Stories, and AI results.
Add to Preferred Sources