BLOG

Stock Market Blog

Daily stock market analysis, trade alerts, and trading education from Ross Givens and the Traders Agency team.

Showing 1–11 of 2673 articles
A stylized stock chart displayed on a dark background shows three distinct price peaks forming the classic silhouette of a human head flanked by two shoulders, with a clean horizontal neckline cutting across the base of the formation.
Educational
Latest Educational

Head and Shoulders Pattern

The head and shoulders pattern signals major trend reversals before they happen. Learn to confirm with volume, set price targets, and manage risk precisely

TAT
Traders Agency Team
Jun 17, 2026
A sleek, menacing autonomous drone silhouetted against a dramatic dusk sky hovers over a vast battlefield landscape, with faint radar dish and military installation targets visible far below.
Stock Analysis
Stock Analysis

The Pentagon Could Hand This $6 Stock $200 Million

A Pentagon defense contract small cap could hand a $6 stock a $200M loitering munition award. Which company holds exclusive Israeli combat drone rights?

Ross Givens
Ross Givens
Jun 17, 2026
A dramatic upward-sweeping stock ticker board or digital financial display glows in blue and green, with the iconic Wall Street bull statue prominently silhouetted in the foreground.
Market News
Market News

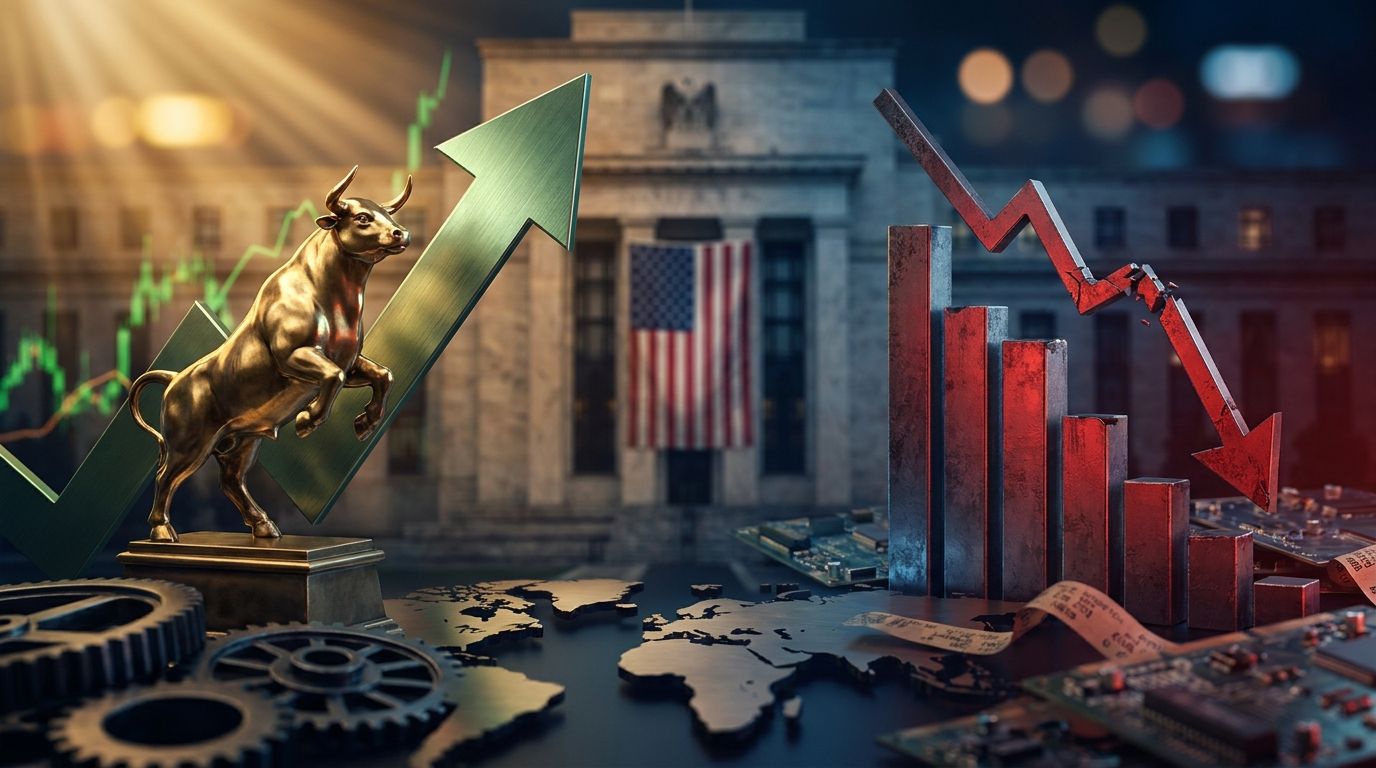
Dow Jones Hits Record: Fed Rate Decision Today

Dow Jones Industrial Average hits a third straight record while S&P 500 flatlines. Fed Chair Kevin Warsh delivers first rate decision — here's what traders

TAT
Traders Agency Team
Jun 17, 2026
A wide-angle view of a crowded racetrack where a single sleek AI-branded car leads far ahead, while a large pack of colorful cars from diverse industries — healthcare, energy, manufacturing — are surging forward together in a powerful catch
Market News
Market News

Catch-Up Rally: Best Stocks to Buy Outside AI

The catch-up rally in non-AI stocks is accelerating. Equal-weighted S&P 500 is beating cap-weighted for the first time since 2022 — here's where capital is

TAT
Traders Agency Team
Jun 17, 2026
A glowing computer monitor displays a dense grid of colorful stock data, heatmaps, and financial charts, with vibrant green and red blocks representing market sectors.
Deep Dive
Deep Dive

Finviz Review

Finviz review verdict: a powerful stock screener for retail traders. See who benefits most, what Elite adds, and whether the upgrade is worth the price.

TAT
Traders Agency Team
Jun 17, 2026
A split-screen visual shows a large stack of bundled cash on one side contrasting with a much smaller stack on the other, connected by a bold upward-trending stock chart arrow that bridges both sides.
Educational
Educational

LEAPS Options for Long-Term Investors

A LEAPS options strategy lets long-term investors control 100 shares with far less capital. Learn deep ITM strikes, risk management, and when LEAPS beat bu

TAT
Traders Agency Team
Jun 17, 2026
A dynamic split composition showing a rocket launching upward on one side, with glowing stock market charts and candlestick graphs trending sharply higher on the other, all bathed in electric blue and green light against a dark background.
Market News
Market News

Nasdaq 100 Futures Rise Ahead of Fed Decision

Nasdaq 100 futures contracts climb 0.56% as traders brace for the first Fed rate decision under Chairman Kevin Warsh. SpaceX surge adds fuel to tech premar

TAT
Traders Agency Team
Jun 17, 2026
A split composition showing Wall Street's gleaming rocket (representing SpaceX hype) launching in the background, while in the sharp foreground, a hard-hatted worker oversees massive data center construction with electrical infrastructure a
Stock Analysis
Stock Analysis

Wall Street Is Chasing SpaceX... Smart Money Is Buying These 4 Stocks

Smart money stock picks are beating the SpaceX IPO pop. These 4 backdoor plays in AI infrastructure and oil shipping offer real upside without chasing hype

Ross Givens
Ross Givens
Jun 16, 2026
A dramatic stock chart rockets upward in a sharp, exaggerated spike before plummeting straight down, rendered in bold red and green against a dark background.
Educational
Educational

How to Spot a Pump and Dump Before It Dumps

Learn to identify a pump and dump scheme before the collapse. Spot the warning signs in volume, charts, and social media hype that signal manipulation.

TAT
Traders Agency Team
Jun 16, 2026
A split-screen visual showing a soaring green arrow or bull charging upward on one side representing the Dow's record high, contrasted against a downward-trending red graph or falling bars on the other side symbolizing the Nasdaq's decline.
Market News
Market News

Fed Rate Decision: Dow Hits Record, Nasdaq Drops

Fed meeting rate decision looms as Dow surges to 52,173 under new Chair Kevin Warsh. Why is the stock market mixed today — and where is capital flowing?

TAT
Traders Agency Team
Jun 16, 2026
A split visual showing the iconic Dow Jones ticker board displaying record-high green numbers on one side, while the other side features a Federal Reserve building bathed in cool, hesitant blue light, symbolizing the tension between market
Market News
Market News

Dow Jones Today: Fed Meeting Stalls Rally

Dow Jones today hits 52,008 as Kevin Warsh's first Fed meeting begins. S&P 500 and Nasdaq stall while Strait of Hormuz delays cloud the outlook.

TAT
Traders Agency Team
Jun 16, 2026
Join the Edge

Stop watching.
Start winning.

50,000+ traders get our daily brief before the market opens.

Free. No spam. Unsubscribe anytime.

Traders Agency What Customers Say
4.8
1,326
4.7
676
Hi, I'm GENTSY